Open Access
Research article
Metabolic modelling of polyhydroxyalkanoate copolymers
production by mixed microbial cultures
João ML Dias
†, Adrian Oehmen
†, Luísa S Serafim
†, Paulo C Lemos
†,
Maria AM Reis
†and Rui Oliveira*
Address: REQUIMTE, Chemistry Department, FCT/Universidade Nova de Lisboa, 2829-516 Caparica, Portugal
Email: João ML Dias - [email protected]; Adrian Oehmen - [email protected]; Luísa S Serafim - [email protected]; Paulo C Lemos - [email protected]; Maria AM Reis - [email protected]; Rui Oliveira* - [email protected]
* Corresponding author †Equal contributors
Abstract
Background: This paper presents a metabolic model describing the production of
polyhydroxyalkanoate (PHA) copolymers in mixed microbial cultures, using mixtures of acetic and propionic acid as carbon source material. Material and energetic balances were established on the basis of previously elucidated metabolic pathways. Equations were derived for the theoretical yields for cell growth and PHA production on mixtures of acetic and propionic acid as functions of the oxidative phosphorylation efficiency, P/O ratio. The oxidative phosphorylation efficiency was estimated from rate measurements, which in turn allowed the estimation of the theoretical yield coefficients.
Results: The model was validated with experimental data collected in a sequencing batch reactor
(SBR) operated under varying feeding conditions: feeding of acetic and propionic acid separately (control experiments), and the feeding of acetic and propionic acid simultaneously. Two different feast and famine culture enrichment strategies were studied: (i) either with acetate or (ii) with propionate as carbon source material. Metabolic flux analysis (MFA) was performed for the different feeding conditions and culture enrichment strategies. Flux balance analysis (FBA) was used to calculate optimal feeding scenarios for high quality PHA polymers production, where it was found that a suitable polymer would be obtained when acetate is fed in excess and the feeding rate of propionate is limited to ~0.17 C-mol/(C-mol.h). The results were compared with published pure culture metabolic studies.
Conclusion: Acetate was more conducive toward the enrichment of a microbial culture with
higher PHA storage fluxes and yields as compared to propionate. The P/O ratio was not only influenced by the selected microbial culture, but also by the carbon substrate fed to each culture, where higher P/O ratio values were consistently observed for acetate than propionate. MFA studies suggest that when mixtures of acetate and propionate are fed to the cultures, the catabolic activity is primarily guaranteed through acetate uptake, and the characteristic P/O ratio of acetate prevails over that of propionate. This study suggests that the PHA production process by mixed microbial cultures has the potential to be comparable or even more favourable than pure cultures.
Published: 8 July 2008
BMC Systems Biology 2008, 2:59 doi:10.1186/1752-0509-2-59
Received: 31 January 2008 Accepted: 8 July 2008 This article is available from: http://www.biomedcentral.com/1752-0509/2/59
© 2008 Dias et al; licensee BioMed Central Ltd.
This is an Open Access article distributed under the terms of the Creative Commons Attribution License (http://creativecommons.org/licenses/by/2.0), which permits unrestricted use, distribution, and reproduction in any medium, provided the original work is properly cited.
Background
Polyhydroxyalkanoates are biopolymers with physico-chemical properties similar to polypropylene but with the advantage of being biodegradable and biocompatible. Industrial PHA production technology is currently based on bacteria cultivation using pure cultures grown in well-defined nutrient deficient synthetic media with single substrates [1]. The relatively high production costs consti-tute presently the most important barrier to PHA becom-ing a commodity polymer in direct competition with oil-based polymers. The cost of the substrate and of the equipment required for aseptic operation is responsible for about 40% of the total PHA production cost [1]. Potential strategies for reducing both the operational and capital expenses of PHA production are the use of open mixed cultures of microorganisms instead of pure cul-tures, and the use of waste materials as the carbon sub-strate. Activated sludge is known to accumulate up to 65% PHA per cell dry weight [2-4]. There are currently many possibilities of industrial and agricultural wastes that could be directed to the production of PHA on the basis of open mixed microbial systems [5,6].
Mixed microbial cultures cannot directly metabolize sug-ars into PHA. A pre-fermentation step is required in order to convert sugars into volatile fatty acids (VFA) such as acetic, propionic, valeric and butyric acid. This pre-fer-mentation step can, however, be accomplished with high yield [5,7]. The final PHA molecular structure is highly dependent on the VFA composition used as carbon source. The most well-studied case is the production of polyhydroxybutyrate (PHB), a homopolymer, obtained when acetic acid is used as the sole carbon source. The metabolism for this transformation (included in Figure 1) can be defined by 6 basic reactions [8,9]: acetate uptake (R1), growth on acetyl-CoA (R4), catabolism (R6), oxida-tive phosphorylation (R8), maintenance (R7) and PHB production (RPHB). A metabolic model based on these reactions was comprehensively validated with experimen-tal data [10]. This study demonstrated an excellent agree-ment between the model predictions and experiagree-mental data.
The properties and quality of PHA are highly dependent on the monomeric composition, which, in turn, is dependent on the VFA mixture adopted as carbon source. PHB is a relatively low quality polymer since it is too brit-tle for many applications [1,11]. In terms of PHA process-ing, the production of copolymers appears to be of higher commercial interest [12-14]. The production of PHB homopolymer and copolymers of 3-hydroxybutyrate (3HB), 3-hydroxyvalerate (3HV) and 3-hydroxy-2-meth-ylvalerate (3H2MV) from mixtures of acetic and propi-onic acid has been studied by several researchers
[11,15-17]. There are, however, no metabolic models currently available describing the production of such copolymers. Metabolic models can be used to facilitate process optimi-zation, and also serve as a reference basis in the interpre-tation of data arising from the study of biological processes. The comparison of experimentally-determined stoichiometry with the theoretical model predictions allows a better understanding of the processes under study. The main objective of this work was to extend exist-ing PHB models [8,10] to the production of PHA copoly-mers from mixtures of VFA. This study will be focused on the PHA production phase, and is confined to mixtures of acetic and propionic acid, which are seen as the most promising for the synthesis of high quality PHAs [11,18].
Metabolic model
A schematic of the metabolic model developed in this study is shown in Figure 1. Acetate and propionate are taken up inside the cell, and used for PHA production and biomass growth. Energy is generated within the cells through oxidative phosphorylation, while a portion of this energy is also necessary for cell maintenance. A detailed description of the biochemical reactions, mate-rial and energy balances, kinetic reactions and metabolic fluxes is provided below.
Basic reactions
The detailed biochemical reactions involved in the PHA production process using acetate and propionate carbon sources under aerobic conditions are shown in Table 1. All reactions are expressed on a carbon-mole basis. In the feast phase, acetate and propionate are taken up inside the cells by means of active transport, requiring one mole of ATP per mole of carbon source. They are then converted into acetyl-CoA and propionyl-CoA, respectively, at the cost of another mole of ATP per mole of acetate or propi-onate. The net reactions are shown in R1 and R2 [19]. While acetate is converted to acetyl-CoA and propionyl-CoA is produced from propionate, it has also been observed that a portion of the propionyl-CoA produced from propionate uptake is converted into acetyl-CoA [11]. This transformation may potentially proceed through 5 different biochemical pathways [11], however, the net material and reducing power transformations are identi-cal through each pathway. The difference between the pathways lies only in the amount of energy generated. For the purposes of this model, it was assumed that propio-nyl-CoA was first converted to succipropio-nyl-CoA via the meth-ylmalonyl-CoA pathway, then converted to oxaloacetate, pyruvate and acetyl-CoA. The net reaction is described in R3.
In PHA production, acetyl-CoA and propionyl-CoA are reduced and condensed to produce a polymer consisting
of various 3-hydroxyalkanoates (3HAs) monomers. 3HB is formed from 2 acetyl-CoA monomers, one acetyl-CoA and one propionyl-CoA combine to form either 3HV or 3-hydroxy-2-methylbutyrate (3H2MB) (which are isomers of each other, and henceforth expressed only as 3HV, indi-cating the sum of these 2 compounds), while 2 propionyl-CoA monomers form 3H2MV. The fraction of each PHA monomer produced by the cells depends on the fluxes of acetyl-CoA and propionyl-CoA available for polymer pro-duction. It also depends on whether the cells tend to reduce and condense acetyl-CoA and propionyl-CoA in a random fashion, or whether preferential binding occurs between e.g. acetyl-CoA and propionyl-CoA. For the pur-poses of metabolic model development, however, it is necessary to express each reaction in relation to the overall mass, energy and redox transformations. Thus, it is more convenient to express the various potential PHA fractions produced by the cells in terms of the reduced and con-densed monomers produced from acetyl-CoA or propio-nyl-CoA. As shown in R9 and R10, these monomers are represented as acetyl-CoA* and propionyl-CoA*, respec-tively, in a similar fashion as expressed by a previous study [20]. The PHA formation process from acetyl-CoA* and
propionyl-CoA* has no further demand for energy or reducing power.
Biomass growth occurs from acetyl-CoA and propionyl-CoA, respectively. The energy required for the production of 1 C-mol of biomass from acetyl-CoA is represented as K1, which has been estimated as 1.7 mol ATP [21]. The reaction of biomass growth from acetyl-CoA was deter-mined through stoichiometric and redox balancing, and is shown in R4. The amount of energy required for biomass synthesis from propionyl-CoA is represented as K2, which has been estimated to be 1.38 mol ATP per C-mol of bio-mass formed [22]. Similarly, it was assumed that propio-nyl-CoA is converted to succipropio-nyl-CoA for biomass synthesis [22]. The net reaction is shown in R5. The bio-mass formula was assumed to be CH1.4O0.4N0.2 [23]. Catabolism of acetyl-CoA and propionyl-CoA also occurs in the microbial cells. Acetyl-CoA is converted to CO2 through the tricarboxylic acid cycle (TCA) as described in R6 [19]. The catabolism of propionyl-CoA is assumed to occur via acetyl-CoA, where R3 is followed by R6.
PHA metabolic network
Figure 1
PHA metabolic network. Figure shows schematic representation of the metabolic reactions, substrates, products (both
Energy in the form of ATP is produced from NADH2 through oxidative phosphorylation. The amount of ATP generated per mole of NADH2 oxidized is expressed by the P/O ratio, δ, which represents the efficiency of oxidative phosphorylation [24]. This reaction is expressed in R8. In addition to the energetic transformations described above, energy is also required for cell maintenance. The rate of ATP consumption for maintenance purposes is described in R7 as mATP.
Pseudo steady-state material balancing of intracellular intermediates
The metabolic network of Figure 1 has q = 13 metabolic reactions, m = 6 intracellular metabolites (marked by dashed lines), 4 input substrates (acetic and propionic acid, ammonia and oxygen) and 5 end-products [bio-mass, PHB, poly(3-hydroxyvalerate) (PHV), poly(2-methyl-3-hydroxyvalerate) (PH2MV) and CO2]. The steady state material balances to the m intracellular inter-mediates (acetyl-CoA, acetyl-CoA*, propionyl-CoA, pro-pionyl-CoA*, NADH2 and ATP) are:
Ac-CoA: R1 + R3 - 1.27·R4 - R6 - R9= 0 (1a) Ac-CoA*: R9 - RPHB - 0.4·RPHV = 0 (1b) Prop-CoA: R2 - 1.5·R3 - 1.06·R5 - R10 = 0 (1c) Prop-CoA*: R10 - 0.6·RPHV - RPH2MV = 0 (1d) NADH2: 1.5·R3 + 0.53·R4 + 0.47·R5 + 2·R6 - R8 - 0.25·R9 - 0.17·R10 = 0 (1e) ATP: -R1 - 0.67·R2 - K1·R4 - K2·R5 + 0.5·R6 - R7 + δ·R8 = 0 (f)
Constraints to the metabolic network
From acetyl-CoA* and propionyl-CoA*, the resulting PHA polymer can be comprised of either PHB (2 acetyl-CoA* molecules), PHV (one acetyl-acetyl-CoA* and one propi-onyl-CoA*) and PH2MV (2 propipropi-onyl-CoA*). The PHA composition depends on whether selective or random condensation of acetyl-CoA* and propionyl-CoA* takes place. In the propionate enriched culture selective con-densation was observed, where acetyl-CoA* preferentially bounds with propionyl-CoA*, forming PHV [11]. Since acetyl-CoA* was generated in higher abundance than pro-pionyl-CoA*, the remaining acetyl-CoA* condensed to form PHB, while PH2MV was not produced by the sludge. This selective condensation is expressed by the following three additional equations:
RPH2MV = 0 (2c)
since RPH2MV = 0 (Eq. 2c), Eqs. (2a–b) are linearly depend-ent to Eqs. (1a–f), only a single additional constraint is introduced with RPH2MV = 0.
In the acetate enriched culture, the PHA composition con-sisted of a lower PHV fraction and a higher PH2MV and PHB fraction, as is expected by microorganisms perform-ing random condensation of acetyl-CoA* and propionyl-CoA*. In this latter case the following three equations are applied [20]: RPHB =R9− ⋅R10 2 3 (2a) RPHV = ⋅5 R 3 10 (2b) R R R R PHB = ⋅ ⋅ + ⋅2 9 2 2 9 3 10 (3a) Table 1: Metabolic model of PHA production from mixtures of acetate and propionate by mixed microbial cultures
Reaction Stoichiometry
R1: Acetate Uptake CH2O + ATP → CHO0.5 + 0.5·H2O
R2: Propionate Uptake
+ 0.67·ATP → + 0.33·H2O
R3: Propionyl-CoA converted to Acetyl-CoA
1.5· + H2O → CHO0.5 + 1.5·NADH2 + 0.5·CO2
R4: Growth on Acetyl-CoA 1.27·CHO0.5 + 0.2·NH3 + K1·ATP + 0.3·H2O → CH1.4N0.2O0.4 + 0.53·NADH2 + 0.27·CO2
R5: Growth on Propionyl-CoA
1.06· + 0.2·NH3 + K2·ATP + 0.17·H2O → CH1.4N0.2O0.4 + 0.47·NADH2 + 0.06·CO2
R6: Catabolism CHO0.5 + 1.5·H2O → CO2 + 2·NADH2 + 0.5·ATP
R7: Maintenance ATP → mATP
R8: Oxidative Phosphorylation NADH2 + 0.5·O2 → H2O+δ·ATP
R9: Acetyl-CoA* Production CHO0.5 + 0.25·NADH2 → CH1.5O0.5
CH O2 2 3 CH4 O 3 13 CH4 O 3 13 CH4 O 3 13
The R9 and R10 fluxes are sufficient to calculate the fluxes of RPHB, RPHV and RPH2MV.
On the other hand, constraints (3a–c) automatically obey the material balances (1a–f) (see [20] for details), thus also a single additional constraint can also be added to the material balances here (1a–f).
Dynamic material balancing of substrates and end-products
The transient material balances in a batch system of input substrates (acetate, propionate, active biomass, ammo-nia) and intracellular contents of PHB, PHV and PH2MV are the following:
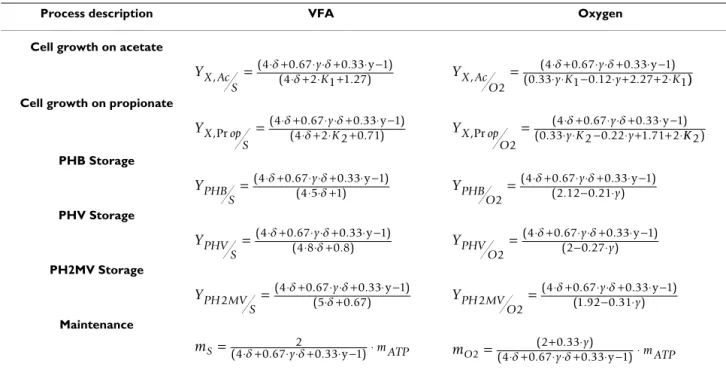
Theoretical yields
The theoretical yields and VFA and oxygen maintenance coefficients were derived analytically from the material balance equations (1a–f). The expressions are compiled in Table 2. The theoretical yield coefficients are functions of δ, K1, K2 and y, the ratio of propionate flux to total carbon flux (see Eq. 5):
Kinetic model
As stated above, the metabolic network has q = 13 fluxes and a total number of 7 constraints. Therefore, at least 6 fluxes must be defined a priori in order to calculate the net-work fluxes. Table 3 compiles the kinetic equations used in this work to model the missing fluxes. This model is an extension of a previous acetate to PHB metabolic model [10]. Briefly, the model defines the following kinetic rates: • Growth on acetyl-CoA (R4) is limited by the concentra-tions of acetate and ammonia.
• Growth on propionyl-CoA (R5) is limited by the concen-trations of propionate and ammonia.
• Catabolism (R6) is limited by total VFA concentration. The kinetic equation for catabolism is only used for mix-tures of acetate and propionate to fulfil the 6 fluxes required to perform MFA.
• Maintenance (R7) is limited by total VFA concentration. • Acetyl-CoA* synthesis (R9) is limited by total VFA con-centration and inhibited by the intracellular PHA content. Intracellular PHA inhibition has been validated experi-mentally by several authors [8-10,25-27].
• Propionyl-CoA* synthesis (R10) is limited by propionate concentration and inhibited by the intracellular PHA con-tent. R R R R R PHV = ⋅ + ⋅5 9 10⋅ ⋅ 2 9 3 10 (3b) R R R R PH MV2 3 10 2 2 9 3 10 = ⋅ ⋅ + ⋅ (3c) dAc dt = − ⋅R1 X (4a) d op dt R X Pr = − ⋅ 2 (4b) dN dt = −0 2. ⋅(R4+R5)⋅X (4c) dX dt =(R4+R5)⋅X (4d) dfPHB dt =RPHB−(R4+R5)⋅fPHB (4e) dfPHV dt =RPHV −(R4+R5)⋅fPHV (4f) dfPH MV dt RPH MV R R fPH MV 2 2 4 5 2 = −( + )⋅ (4g) y R R R = +2 1 2 (5) R10: Propionyl-CoA* Production + 0.17·NADH2 → RPHB: PHB Production CH1.5O0.5 → PHB RPHV: PHV Production 0.4·CH1.5O0.5 + 0.6· → PHV RPH2MV: PH2MV Production → PH2MV
Table 1: Metabolic model of PHA production from mixtures of acetate and propionate by mixed microbial cultures (Continued) CH4 O 3 13 CH5 O 3 13 CH5 O 3 13 CH5 O 3 13
Methods
Reactors operation
In this study, two SBR for the production of PHA, were operated over four years. The sludge in each reactor was adapted to either acetate or propionate as the sole carbon source. The reactors working volume was 1 litre and the total SBR cycle duration was 12 h, consisting of 10.5 h of
aerobiosis, 1 h of settling (agitation and air sparging switched off) and 0.5 h to withdraw half of the volume, which was replaced by the same volume of fresh medium during the first 15 min at the beginning of the next cycle. The hydraulic retention time (HRT) was therefore 1 day. At the end of each cycle, before settling, a defined volume of biomass was removed to keep the sludge retention time Table 2: Theoretical yields and maintenance coefficients
Process description VFA Oxygen
Cell growth on acetate
Cell growth on propionate
PHB Storage PHV Storage PH2MV Storage Maintenance YX Ac S y K , ( . . ) ( . ) = 4⋅ +0 67⋅ + ⋅⋅ ⋅ ++0 33⋅ −1 4 2 1 1 27 δ δ δ y YX Ac O y y K y K , ( . . ) ( . . . 2 4 0 67 0 33 1 0 33 1 0 12 2 27 2 1 = ⋅ ⋅⋅ +δ − ⋅ ⋅ +δ⋅ + ⋅ −y+ ⋅ )) YX op S y K ,Pr ( . . ) ( . ) = 4⋅ +40 67⋅ + ⋅2⋅ ⋅ ++0 33⋅ −1 2 0 71 δ δ δ y YX op O y y K y ,Pr ( . . ) ( . . . 2 4 0 67 0 33 1 0 33 2 0 22 1 71 2 = ⋅ ⋅⋅ +δ − ⋅ ⋅ +δ⋅ + ⋅ −y+ ⋅KK 2) YPHB S y =(4⋅ +δ 0 67.(4 5⋅ ⋅ +⋅ ⋅ +δδ 10 33). ⋅ −y 1) YPHB O y y 2 4 0 67 0 33 1 2 12 0 21 =( ⋅ +δ ( .. ⋅ ⋅ +−δ. ⋅. )⋅ −y ) YPHV S y =(4⋅ +δ 0 67(.4 8⋅ ⋅ +⋅ ⋅ +δδ0 80 33. ). ⋅ −y 1) YPHV O y y 2 4 0 67 0 33 1 2 0 27 =( ⋅ +δ .( −⋅ ⋅ +.δ ⋅.) ⋅ −y ) YPH MV S y 2 4 0 67 0 33 1 5 0 67 =( ⋅ + . ⋅ +⋅ ⋅ + . ⋅ − ) ( . ) δ δ δ y YPH MV O y y 2 2 4 0 67 0 33 1 1 92 0 31 =( ⋅ + . ⋅ ⋅ +− ⋅. ⋅ − ) ( . . ) δ δ y mS =(4⋅ +δ 0 67. ⋅ ⋅ +y2δ 0 33. ⋅ − ⋅y 1) m ATP m O y y m ATP 2 2 0 33 4 0 67 0 33 1 =( ⋅ +δ .( +⋅ ⋅ +.δ ⋅.) ⋅ − ⋅y )
Table 3: Kinetic model
Reaction Kinetics R4: Growth on Acetyl-CoA R5: Growth on Propionyl-CoA R6: Catabolism R7: Maintenance R9: Acetyl-CoA* Production R10: Propionyl-CoA* Production R R Ac Ac K S N N K N 4 = 4,max⋅ + ⋅ + R R op op K S N N K N 5= 5,max⋅ + ⋅ + Pr Pr R R S S K S 6= 6,max⋅ + R R S S K S 7= 7,max⋅ + R R S S K S fPHA fPHA R 9= 9 ⋅ 1 23 10 ⎧ ⎨ ⎪ + ⋅ −⎛⎝⎜ ⎞⎠⎟ ⎡ ⎣ ⎢ ⎢ ⎤ ⎦ ⎥ ⎥ ⋅ max ,max ,max , α ⎩⎩⎪ ⎫ ⎬ ⎪ ⎭⎪ R R S S K S fPHAfPHA 10 = 10 ⋅ + ⋅ 1−⎛ ⎝ ⎜ ⎞ ⎠ ⎟ ⎡ ⎣ ⎢ ⎢ ⎤ ⎦ ⎥ ⎥ ,max ,max α
(SRT) at 10 days. Oxygen was supplied by an air compres-sor through a ceramic membrane disperser introduced inside the reactor at an airflow rate of 1.0 vvm (volume air/(volume reactor.min)), allowing for the dissolved oxy-gen (DO) concentration to be around 80% of the satura-tion value. The reactors were operated without pH control but its value was monitored on-line and ranged between 8.0 and 9.2; the temperature was controlled at 22°C and the stirring rate at 250 rpm.
Culture medium
The standard medium used in the SBRs was composed of (per litre of distilled water): 1.269 g CH3CH2COOH or 4.0796 g of CH3COONa.3H2O, 600 mg MgSO4.7H2O, 160 mg NH4Cl, 100 mg EDTA, 92 mg K2HPO4, 45 mg KH2PO4, 70 mg CaCl2.2H2O and 2 ml of trace elements solution. The trace solution consisted of (per litre of dis-tilled water): 1500 mg FeCl3.6H2O, 150 mg H3BO3, 150 mg CoCl2.6H2O, 120 mg MnCl2.4H2O, 120 mg ZnSO4.7H2O, 60 mg Na2MoO4.2H2O, 30 mg CuSO4.5H2O and 30 mg of KI. Thiourea (10 mg/l) was added to inhibit nitrification. The pH of the salt solution was adjusted to 7.2 and then sterilized, where the phos-phorus components of the solution was sterilized sepa-rately. After sterilization, the two solutions were allowed to cool, and were then mixed together.
In the batch experiments, different concentrations of ace-tate, propionate and ammonia were tested for the two sys-tems and different feeding regimens were used. For the acetate reactor: the acetate concentrations tested with 1.4 N-mmol/l of ammonia were 15 C-mmol/l, 30 C-mmol/l and 60 C-mmol/l. The ammonia concentrations with 30 Cmmol/l of acetate: 0.7 N-mmol/l, 1.4 N-mmol/l and 2.8 N-mmol/l. The feeding regimen was tested by supplying multiple pulses of 60 C-mmol/l of acetate (3 tests with 3 pulses and 1 test with 4 pulses), where 0.7 N-mmol/l of ammonia was also added in the first pulse for these tests. Two more assays were performed by supplying a 30 C-mmol/l of propionate and a mixture of acetate and propi-onate with 15 C-mmol/l each. The batch tests performed in the propionate system analyzed the effect of different concentrations of propionate (30 C-mmol/l, 60 C-mmol/ l, 90 C-mmol/l and 120 C-mmol/l) with 1.4 N-mmol/l of ammonia and the use of acetate (in one pulse of 30 C-mmol/l and mixed with propionate, 15 C-C-mmol/l each). In total, 18 batch tests were performed with the two sys-tems.
Analytical techniques
Cell dry weight was determined as volatile suspended sol-ids (VSS), according to Standard Methods [28]. Acetate and propionate were analyzed by HPLC using a BioRad Aminex HPX-87H column, with 0.01 N sulphuric acid as eluent, an elution rate of 0.6 ml/min and an operating
temperature of 50°C. A UV detector (Merck) set at 210 nm was used. Prior to injection, samples were filtered using a 0.2 μm membrane. PHA were determined by GC after acidic estherification (see [4,11] for details). Ammonia was analyzed using an ammonia gas sensing combination electrode (ThermoOrion 9512).
Parameter estimation
The kinetic parameters were estimated by non-linear weighted least-squares (MATLAB's lsqnonlin function) using the Levenberg-Marquardt algorithm. The program minimized the root mean squared error:
with e the vector of residuals scaled by their maximum values, n the number of measurements and p the number of parameters to estimate.
The confidence bounds of the parameters were estimated by the approximation of the Hessian matrix, H, by the Jacobian matrix, J, at the minimum root mean squared error, rmse.
H = JT·J·rmse (7)
Finally, confidence bounds, CBp, were obtained by the estimate of standard deviations for a level of confidence of 95%:
CB = diag(H)·t(1 - 0.95, n - p) (8)
with t the t-student distribution.
For the calculation of residuals, Eqs. (4a–g) were inte-grated using a 4th/5th order Runge-Kutta solver (MATLAB's
ode45 function), with the obtained concentrations of
ace-tate, propionate, PHB, PHV, PH2MV and oxygen sub-tracted from the respective measured values to give the residuals.
Metabolic Flux Analysis
Metabolic Flux Analysis (MFA) is a methodology that allows the determination of a set of unknown metabolic fluxes, vn, from a set of known fluxes, vb [29] by steady-state material balancing (here using Eqs. (1a–f)). In the present case, vb is composed of the modelled fluxes:
vb = [R4, R5, R6, R7, R9, R10]T
The remaining fluxes were calculated by solving the cen-tral MFA equation [29]:
rmse T n p = ⋅ −
(
e e)
(6)vn = -An-1·A
b·vb
with vn the vector of unknown fluxes,
vn = [R1, R2, R3, R8, RPHB, RPHV, RPH2MV]T
An and Ab are the corresponding stoichiometric matrices
of the unknown and known fluxes respectively. Note that in this case An is a square (7 × 7) matrix.
For single substrate feeding studies, either R1 or R2 equals zero, thus only 5 modelled
fluxes had to be included in vb, being R6 moved to vn.
Flux Balance Analysis
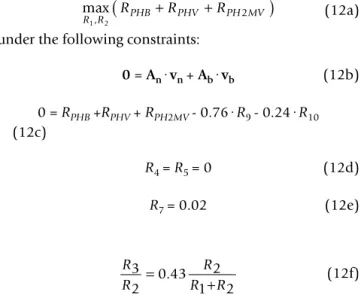
Flux Balance Analysis (FBA) is a method to optimize a given metabolic objective function under the constraints of steady-state material balancing of intracellular interme-diates and other known biological constraints [30]. FBA was applied in this study to maximize the flux of PHA syn-thesis with a desired 24% (C-mol/C-mol) propionyl-CoA* composition. Mathematically, the problem can be stated in the following way.
under the following constraints:
0 = An·vn + Ab·vb (12b)
0 = RPHB +RPHV + RPH2MV - 0.76·R9 - 0.24·R10 (12c)
R4 = R5 = 0 (12d)
R7 = 0.02 (12e)
Constraint (12c) defines the desired monomeric compo-sition of the final polymer. Constraint (12d) states that the cells are not growing during the PHA synthesis phase. The maintenance flux (Eq. 12e) was set to a known flux (see Table 4). Constraint (12f) was established on the basis of experimental observations and discussed later in the results section. FBA problems are normally solved
max , R R1 2 RPHB RPHV RPH MV 2 + +
(
)
(12a) R R R R R 3 2 0 43 2 1 2 = + . (12f)Table 4: Parameters estimation results of acetate and propionate enriched cultures for the different feeding conditions
Substrate Acetate Propionate Mixture
Culture enrichment Acetate Propionat
e
Acetate Propionate Acetate Propionate
Number of experiments used for parameters estimation/model validation
(7/3) (1/0) (1/0) (3/1) (1/0) (1/0)
P/O ratio, d (mol-ATP/mol-NADH2) 2.94 ± 0.16 1.08 ± 0.12 1.80 ± 0.19 0.94 ± 0.04 2.90 ± 0.27 1.78 ± 0.19
Maximum rates determined by metabolic model [C-mol/(C-mol.h)]
R6, max - - - - 0.092 ± 0.017 0.094 ± 0.046
R9, max 0.52 ± 0.03 0.13 ± 0.01 0.033 ± 0.005 0.053 ± 0.003 0.30 ± 0.03 0.18 ± 0.02
R10, max - - 0.041 ± 0.004 0.052 ± 0.003 0.22 ± 0.02 0.13 ± 0.02
Maximum rates determined by MFA [C-mol/(C-mol.h)]
R1, max 0.73 (0.01) 0.21 (0.02) - - 0.33 (0.07) 0.22 (0.05) R2, max - - 0.12 (0.02) 0.17 (0.02) 0.34 (<0.01) 0.23 (<0.01) R3, max - - 0.049 (0.005) 0.074 (0.005) 0.074 (0.018) 0.059 (0.016) R6, max 0.18 (<0.01) 0.07 (<0.01) 0.016 (<0.001) 0.021 (0.003) - -R8, max 0.24 (0.02) 0.11 (<0.01) 0.094 (0.006) 0.13 (0.02) 0.19 (<0.01) 0.22 (0.01) RPHB, max 0.52 (0.03) 0.13 (0.01) 0.011 (0.003) 0.018 (0.001) 0.14 (0.02) 0.090 (0.005) RPHV, max - - 0.035 (0.006) 0.086 (0.006) 0.26 (0.03) 0.22 (0.03) RPH2MV, max - - 0.026 (0.003) - 0.12 (0.01)
-The confidence bounds in parenthesis were obtained by error propagation of the metabolic model parameters
fPHA, max = 2.47 C-mmol/C-mmol [10]; a = 3.85 (dimensionless) [10]; mATP = 0.02 mol-ATP/(C-mol.h) [39]; KS = 0.062 C-mmol/l [39]; KN = 0.56 N-mmol/l [40]
through linear programming using the simplex algorithm. In our case, constraint (12f) is a nonlinear equation, thus a nonlinear function solver was adopted. The MATLAB function 'fmincon' based on the quasi-Newton optimiza-tion algorithm was adopted to solve the system (12a–f).
Results and discussion
Estimation of the kinetic parameters
The data of 18 batch experiments were used for model cal-ibration and validation. In mixed microbial cultures there is a diversity of organisms with different phenotypes com-peting for the nutrients in the medium. The observed met-abolic activity is thus an "average" metmet-abolic activity over all organisms present in the culture. This metabolic activ-ity is obviously highly dependent on the culture enrich-ment regimen and also on the VFA feeding strategy. As such, the parameter estimation was done separately for the following 6 distinct experimental conditions:
1. Acetate enriched culture fed with acetate. 2. Acetate enriched culture fed with propionate.
3. Acetate enriched culture fed with mixtures of acetate and propionate.
4. Propionate enriched culture fed with acetate. 5. Propionate enriched culture fed with propionate. 6. Propionate enriched culture fed with mixtures of ace-tate and propionate.
The estimated parameter values and respective 95% confi-dence limits are compiled in Table 4. Note that the esti-mated confidence bounds are generally quite low, denoting the high sensitivity of residuals to parameters and the high statistical confidence of the estimated parameter values.
Figures 2, 3, 4, 5, 6, 7 compare model predictions and respective measurements for the data of the 18 experi-ments used in this study. The modelling results for acetate enriched cultures fed with acetate (7 calibration experi-ments and 3 validation experiexperi-ments) and propionate enriched culture fed with propionate (3 calibration exper-iments and 1 validation experiment) are shown in Figures 2 and 3, respectively. Full symbols represent calibration points while open symbols denote validation points. These results show that the model was able to consistently describe the experimental data for a wide range of acetate and propionate feeding conditions, with regression coef-ficients, r2, always above 0.94. Figures 4, 5, 6, 7 show the modelling results obtained for the remaining experi-ments, where both cultures were fed with substrates other
than those used in the enrichment phase. In these Figures, the experimental data of the acetate, propionate, PHB, PHV, PH2MV and oxygen is represented by full symbols and the model prediction by full lines. A good agreement between experimental data and model predictions was obtained in all cases.
P/O ratio
The P/O ratio is a measure of the efficiency of ATP synthe-sis coupled to cell respiration, indicative of the efficiency of catabolism. In acetate enriched cultures, the P/O ratio was significantly higher than in propionate enriched cul-tures (Table 4). Moreover, the acetate feast and famine enrichment strategy yielded an extremely energetically effective population with a P/O ratio close to the theoret-ical maximum, which is between 2–3 mol-ATP/mol-NADH2 in bacteria [9,10,31-33]. This result may suggest that the feast and famine strategy may induce not only the accumulation of intracellular reserves but also the optimi-zation of the global energetic efficiency of the final selected culture.
The P/O ratio results in Table 4 also show that after a short term swap in substrate, the P/O ratio is highly affected. This behaviour is common to both cultures used in the present study. When propionate is the main source of energy, the P/O ratio is consistently much lower (~1 in both acetate enriched and propionate enriched cultures) than when acetate is the main source of energy (2.9 and 1.8 in acetate and propionate enriched cultures, respec-tively). This result is also consistent with the generally lower energetic efficiency associated with the propionate enriched culture. Interestingly, when mixtures of acetate and propionate are fed to the culture, the characteristic P/ O ratio of acetate prevails over that of propionate, which suggests that catabolic activity and respiration is preferen-tially executed through acetate metabolism (see discus-sion below for more detail).
A detailed study about the P/O ratio for microbial cells using different substrates was performed by Stouthamer [34]. In this study, a range of P/O ratios between 2.25 and 3 were found for different substrates, whereas 2.25 was the value calculated for acetate. On the other hand, Gottschalk [19] stated that P/O ratio may also vary with bacterial species and more specifically with the number of phospholylation sites they contain. In mixed cultures con-taining enrichments of polyphosphate and glycogen-accu-mulating organisms (PAO and GAO), different P/O ratios have been reported depending on the carbon source used for culture enrichment, namely acetate and propionate. The P/O ratio reported for acetate enriched cultures was 1.85 for PAO [35] and 1.73 for GAO [22], while in propi-onate enriched cultures the P/O ratio was reported as 1.37 for PAO and 1.29 for GAO [36]. Furthermore, it was
observed that the mixed microbial culture fed with acetate exhibited a significantly lower P/O ratio (1.38) at the beginning of the reactor operational period, before the acetate culture had adapted to a feast and famine regimen (data not shown). A very high P/O ratio (2.88) was also observed for a pure culture of Cupriavidus necator (for-merly Ralstonia eutropha) when imposed to the feast and famine regimen for PHA production [33]. These state-ments support the hypothesis that the carbon source affects the P/O ratio and the feast and famine regimen may enable the selection of bacteria with a higher P/O ratio, mainly in acetate enriched cultures.
Higher P/O ratios are normally associated with lower maintenance coefficients and higher biomass/substrate and product/substrate yields. Table 5 compiles the theo-retical yields for the different culture enrichment scenar-ios. As expected, for the same feeding conditions a higher P/O ratio led to higher yields and lower maintenance coefficients. Within this frame, it is clear that the acetate feast and famine culture enrichment strategy produces the highest yields of cell growth and PHA formation.
Metabolic flux distribution
The calculated metabolic flux distribution (MFD) was obtained in all cases in conditions of excess of carbon
Modelling results
Figure 2
Modelling results. Figure shows the results obtained for acetate enriched cultures under acetate feeding conditions. Full
symbols represent parameter estimation results and open symbols the model validation results. Dashed lines are the 95% con-fidence limits for the parameter estimation and model validation results.
Measur ed PHB
(C-mmol/l)
0
40
80
120
160
Pr
ed
ic
te
d P
H
B
(C
-m
m
o
l/l)
0
40
80
120
160
Measur ed O2
(mmol/l)
0
10
20
30
40
50
Pr
ed
ic
te
d
O
2
(m
m
o
l/
l)
0
10
20
30
40
50
R2 = 0.9687
Measur ed Acetate
(C-mmol/l)
0
50
100
150
200
P
red
ic
te
d
A
cet
a
te
(C
-m
m
o
l/l)
0
50
100
150
200
250
R2 = 0.9821
R2 = 0.9700
source material and negligible cell growth conditions (low ammonia concentration in the medium). The results are shown in Figures 8a–d. When acetate is fed as the sole carbon source to acetate or propionate enriched cultures, the overall metabolic activity is significantly higher in the former case than in the latter case (Figure 8a). All fluxes are at least two-threefold higher in the acetate enriched culture as compared to the propionate enriched culture. On the other hand, if propionate is fed to both cultures, all fluxes, without exception, are higher in the propionate enriched culture when compared to the acetate culture (Figure 8b). These results confirm that the substrate used
for culture enrichment is more effectively metabolized by the selected culture. However, the differences between the fluxes of both cultures in Figure (8b) are markedly lower than those of Figure (8a). In particular, the total carbon uptake and corresponding PHA storage are much higher in the acetate enriched culture fed with acetate. It seems that acetate was a much more effective substrate than pro-pionate for selective enrichment of PHA producing cul-tures, leading to higher quantities of PHA stored.
The simultaneous feeding of acetate and propionate to the enriched cultures is shown in Figure 8c. Acetate and pro-pionate are taken up at similar fluxes in each culture: 0.33
Modelling results
Figure 3
Modelling results. Figure shows the results obtained for propionate enriched cultures under propionate feeding conditions.
Full symbols represent parameter estimation results and open symbols the model validation results. Dashed lines are the 95% confidence limits for the parameter estimation and model validation results.
Measur ed O
2(mmol/l)
0
10
20
30
40
Pr
ed
ic
te
d O
2(mmo
l/l
)
0
10
20
30
40
Measur ed PHV
(C-mmol/l)
10
20
30
40
50
60
Pr
ed
ic
te
d
PH
V
(C
-m
m
o
l/
l)
10
20
30
40
50
60
Measur ed PHB
(C-mmol/l)
4
6
8
10
12
14
16
Pr
ed
ic
te
d PH
B
(C
-m
m
o
l/
l)
4
6
8
10
12
14
16
R2 = 0.9494
Measur ed Pr opionate
(C-mmol/l)
0
20
40
60
80
100
P
re
d
ic
te
d
P
ro
p
io
n
a
te
(C
-m
m
o
l/
l)
0
20
40
60
80
100
R2 = 0.9584
R2 = 0.9445
R2 = 0.9932
Modelling results
Figure 4
Modelling results. Figure shows the results obtained for acetate enriched cultures under propionate feeding conditions. Full
symbols represent the experimental data and full lines the modelling results.
Time (h)
0.0
0.5
1.0
1.5
2.0
P
ro
p
io
n
a
te
(
C
-m
m
o
l/l)
0
6
12
18
24
Time (h)
0.0
0.5
1.0
1.5
2.0
P
H
B
(
C
-m
m
o
l/l)
2.7
3.0
3.3
3.6
3.9
4.2
4.5
P
H
V
(C
-m
m
o
l/
l)
0
2
4
6
P
H
2
M
V
(C
-m
m
o
l/l)
0
1
2
3
4
Time (h)
0.0
0.5
1.0
1.5
2.0
O
2(m
m
o
l/l)
0
2
4
6
Modelling results
Figure 5
Modelling results. Figure shows the results obtained for acetate enriched cultures under acetate and propionate feeding
con-ditions. Full symbols represent the experimental data and full lines the modelling results.
Time (h)
0.0
0.1
0.2
0.3
0.4
0.5
A
ce
ta
te
(C
-m
m
o
l/l)
0
4
8
12
16
Time (h)
0.0
0.1
0.2
0.3
0.4
0.5
P
ro
p
io
n
a
te
(
C
-m
m
o
l/l)
0
3
6
9
12
P
H
B
(C
-m
m
o
l/l)
9
10
11
12
13
P
H
V
(C
-m
m
o
l/l
)
0
2
4
6
8
Time (h)
0.0
0.1
0.2
0.3
0.4
0.5
P
H
2
M
V
(
C
-m
m
o
l/l)
0
1
2
3
4
Time (h)
0.0
0.1
0.2
0.3
0.4
0.5
O
2(
m
m
o
l/l)
0
1
2
3
C-mol/(C-mol.h) of acetate and 0.34 C-mol/(C-mol.h) of propionate was taken up in acetate enriched cultures and 0.22 mol.h) of acetate and 0.23 C-mol/(C-mol.h) of propionate was taken up in propionate enriched cultures. The total carbon flux is 33% higher in acetate enriched cultures when compared to the propion-ate enriched cultures. The acetpropion-ate enriched culture pro-duced a total PHA flux of 0.52 C-mol/(C-mol.h), whereas the PHA flux in the propionate enriched culture is 0.31 C-mol/(C-mol.h) (40% lower). However, the catabolism flux, R6, is about the same in both cultures, suggesting that the percentage of carbon source spent for maintenance is higher for propionate enriched cultures due to the much
lower P/O ratio in propionate enriched cultures. This is further confirmed by the higher oxidative phosphoryla-tion flux, R8, for the propionate enriched culture.
It is also clear from Figures 8b–c that PH2MV was pro-duced in the acetate culture and not in the propionate cul-ture, due to the fact that acetyl-CoA* and propionyl-CoA* tended to condense randomly in the acetate culture and selectively in the propionate culture. A possible explana-tion for this result is that selective condensaexplana-tion of propi-onyl-CoA* with acetyl-CoA* may be a property of cells acclimatized to a propionate substrate, and that the ace-tate culture, which was never previously exposed to
propi-Modelling results
Figure 6
Modelling results. Figure shows the results obtained for propionate enriched cultures under acetate feeding conditions. Full
symbols represent the experimental data and full lines the modelling results.
Time (h)
0.0
0.3
0.6
0.9
1.2
A
cet
a
te (
C
-m
m
o
l/
l)
0
10
20
30
Time (h)
0.0
0.3
0.6
0.9
1.2
P
H
B
(C
-m
m
o
l/l
)
0
5
10
15
Time (h)
0.0
0.3
0.6
0.9
1.2
O
2(
m
m
o
l/
l)
0
2
4
6
Modelling results
Figure 7
Modelling results. Figure shows the results obtained for propionate enriched cultures under acetate and propionate feeding
conditions. Full symbols represent the experimental data and full lines the modelling results.
Time (h)
0.0
0.2
0.4
0.6
0.8
1.0
A
ce
ta
te
(C
-m
m
o
l/l)
0
4
8
12
16
20
Time (h)
0.0
0.2
0.4
0.6
0.8
1.0
P
ro
p
io
n
a
te
(C
-m
m
o
l/l)
0
3
6
9
12
P
H
B
(C
-m
m
o
l/l)
4
6
8
10
P
H
V
(
C
-m
m
o
l/l)
15
18
21
24
Time (h)
0.0
0.2
0.4
0.6
0.8
1.0
O
2(m
m
o
l/l)
0
2
4
6
8
onate, may have lacked the necessary enzymes or microbial population that is responsible for selective con-densation.
Figure 8d shows a comparison of the fluxes for some of the main reactions in the two enriched cultures during the different feeding conditions. In acetate enriched cultures, the total VFA uptake capacity obtained with acetate feed-ing (0.73 C-mol/(C-mol.h)) was approximately equal to the sum of acetate and propionate uptake, when the sub-strates were fed simultaneously. Propionate enriched cul-tures showed a completely different behaviour. The total carbon uptake observed when both substrates were fed to this culture was approximately double that of the propi-onate or acetate uptake when the substrates were fed indi-vidually. A similar trend can be observed for the oxygen consumption flux and total PHA production flux, where the total flux in the propionate culture is approximately equal to the individual acetate and propionate fluxes combined, while the mixed substrate feed exhibited simi-lar fluxes to the case of acetate feeding in the acetate cul-ture. The mixed substrate feed had a synergistic effect on the individual metabolism of both substrates: both stud-ied cultures were more able to take up propionate and convert it into PHA with a combined acetate/propionate feeding. This increase in VFA uptake was also observed in a culture adapted to a mixture of acetate, propionate and lactic acid [16]. A possible explanation for this result is that the conversion of propionyl-CoA to acetyl-CoA is the rate limiting step for PHV synthesis using only propion-ate. The effect of this limitation on VFA uptake rate is attenuated when acetate is also fed, because the require-ment of propionyl-CoA driven to acetyl-CoA is lower and more propionyl-CoA can be driven for propionyl-CoA* synthesis without losing carbon in reaction, R3.
Since the fraction of propionate per total VFA in the feed had a substantial influence on the amount of propionate uptake driven to acetyl-CoA, a relationship was estab-lished based on these two fractions, for each mixed culture under either a propionate or a mixed propionate-acetate feed (see Eq. 12f). The linear regression coefficient, r2, for this equation was found to be 0.98, based on the data pre-sented in Table 4. It is clear that an increase in the propi-onate fraction fed to the mixed cultures leads to an increase in the amount of propionate converted through propionyl-CoA to acetyl-CoA. Thus, there was a higher requirement for acetyl-CoA production when the relative acetate uptake rate is lower. This supports the hypothesis discussed above, where it was proposed that energy gener-ation through the catabolic activity of the cells are prefer-entially executed through acetyl-CoA.
Overall, the results from the tests with the simultaneous feeding of acetate and propionate again corroborate the hypothesis that acetate was a much more effective sub-strate than propionate for the selection of an optimal PHA producing culture through enrichment via the feast and famine regimen.
Flux balance analysis
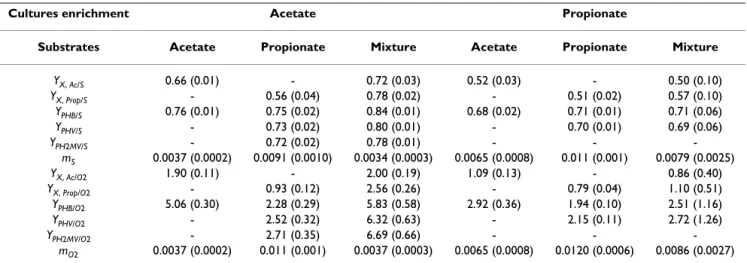
From the results presented above, it is clear that acetate is a superior substrate to propionate for the enrichment of a microbial culture performing PHA production under the feast and famine regimen, due to the higher oxidative phosphorylation efficiency with this carbon source, resulting in higher PHA productivity. It is also clear that the feeding of both acetate and propionate carbon sources simultaneously resulted in either a similar or higher total PHA productivity, with a higher diversity of 3HA mono-mers as compared to the feeding of a single substrate. Table 5: Yields and maintenance coefficients for acetate and propionate enriched cultures for the different feeding conditions
Cultures enrichment Acetate Propionate
Substrates Acetate Propionate Mixture Acetate Propionate Mixture
YX, Ac/S 0.66 (0.01) - 0.72 (0.03) 0.52 (0.03) - 0.50 (0.10) YX, Prop/S - 0.56 (0.04) 0.78 (0.02) - 0.51 (0.02) 0.57 (0.10) YPHB/S 0.76 (0.01) 0.75 (0.02) 0.84 (0.01) 0.68 (0.02) 0.71 (0.01) 0.71 (0.06) YPHV/S - 0.73 (0.02) 0.80 (0.01) - 0.70 (0.01) 0.69 (0.06) YPH2MV/S - 0.72 (0.02) 0.78 (0.01) - - -mS 0.0037 (0.0002) 0.0091 (0.0010) 0.0034 (0.0003) 0.0065 (0.0008) 0.011 (0.001) 0.0079 (0.0025) YX, Ac/O2 1.90 (0.11) - 2.00 (0.19) 1.09 (0.13) - 0.86 (0.40) YX, Prop/O2 - 0.93 (0.12) 2.56 (0.26) - 0.79 (0.04) 1.10 (0.51) YPHB/O2 5.06 (0.30) 2.28 (0.29) 5.83 (0.58) 2.92 (0.36) 1.94 (0.10) 2.51 (1.16) YPHV/O2 - 2.52 (0.32) 6.32 (0.63) - 2.15 (0.11) 2.72 (1.26) YPH2MV/O2 - 2.71 (0.35) 6.69 (0.66) - - -mO2 0.0037 (0.0002) 0.011 (0.001) 0.0037 (0.0003) 0.0065 (0.0008) 0.0120 (0.0006) 0.0086 (0.0027)
MFD results
Figure 8
MFD results. Figure shows MFD results for acetate (a), propionate (b) and acetate + propionate (c) feeding using acetate (■)
and propionate (䊐) enriched cultures. Figure 8d presents MFD results of the main substrates uptake, PHA and oxidative phos-phorylation fluxes for the two enriched cultures.
0 0.1 0.2 0.3 0.4 0.5 0.6 0.7 0.8 R ea ct ion r a te s (m ol/ (m ol .h
)) Acetate enriched culture
Propionate enriched culture
R1 R6 R7 R8 R9 RPHB 0.00 0.02 0.04 0.06 0.08 0.10 0.12 0.14 0.16 0.18 0.20 R ea cti o n r a te s (m o l/ (mo l. h) )
Acetate enriched culture Propionate enriched cultures
R2 R3 R6 R7 R8 R9 R10 RPHA RPHB RPHVRPH2MV 0 0.1 0.2 0.3 0.4 0.5 0.6 0.7 0.8 R ea cti o n r a te s (m ol /( mo l. h)
) Acetate enriched culture
Propionate enriched culture
R2 R3 R6 R8 R9 R10 RPHA RPHB RPHVRPH2MV R1 RS R7 0 0.1 0.2 0.3 0.4 0.5 0.6 0.7 0.8 R ea cti o n r a te s (m o l/ (mo l. h )) Acetate feeding Propionate feeding Acetate + propionate feeding
RS RPHA R8 RS RPHA R8
Acetate enr iched cultur es Pr opionate enr iched cultur es a)
b)
c)
Thus, in PHA producing systems where the microbial cul-ture enrichment and PHA production phases are sepa-rated, it is desirable to enrich the microbial culture using acetate, while feeding a combination of acetate and propi-onate in the PHA production phase.
During the PHA production phase, it is possible to control the final PHA polymer composition through manipulat-ing the acetate and propionate feedmanipulat-ing fractions, usmanipulat-ing the metabolic model presented in this study. It was stated that a PHA copolymer with 15–20 mol % of propionyl-CoA* (18–24 C-mol %) is desired for improved toughness of the final polymer [18]. Assuming this propionyl-CoA* content as a constraint, the optimal feeding strategy required to obtain this copolymer was defined by per-forming FBA on the acetate enriched culture, where Eq. 12f was also used as a constraint. The FBA results are pre-sented in Figure 9. These results show that the maximum PHA production rate with the desired propionyl-CoA* content is obtained when the propionate uptake rate is below the maximum calculated from parameter estima-tion (0.34 C-mol/(C-mol.h)). The limitaestima-tion of the propi-onate uptake rate can be achieved by ensuring that the feeding rate of propionate is equal to the desired propion-ate uptake rpropion-ate during reactor operation. When the proc-ess was operated at the maximum propionate uptake rate, the obtained propionyl-CoA* content in the PHA poly-mer was about 42%.
Metabolic comparison of PHA production by pure and mixed cultures
The process efficiency for PHA production by mixed microbial cultures was evaluated through a comparison of the metabolic fluxes for the PHA production process by pure cultures of microorganisms using the same carbon substrates (i.e. acetate and propionate). In the present study using mixed microbial cultures, the biomass growth was assumed to be negligible based on the very low feed concentration of ammonia. In the pure culture studies
[18,37], the maximum carbon fraction used for biomass growth was less than 15%, providing a good basis for comparison with the present study. MFA was performed for a pure culture of Cupriavidus necator using acetate as the sole carbon source [37]. As shown in Table 6, the ace-tate uptake rate is higher for mixed microbial cultures enriched on acetate (0.73 C-mol/(C-mol.h)) than for pure cultures (0.44 C-mol/(C-mol.h)). However, the acetate uptake rate in the cultures enriched on propionate is half of the rate observed in pure cultures (0.21 C-mol/(C-mol.h)). The fluxes for CO2 formation and O2 consump-tion are slightly higher for pure cultures. These differences could be explained by the additional energetic consump-tion for cell growth in pure cultures that is negligible in both mixed cultures. The fraction of carbon driven for PHB is significantly higher for both mixed cultures. This is likely due to the very high P/O ratio observed, especially in the mixed culture fed with acetate and, hence, a more efficient utilization of the carbon supply is expected. For the case of a Cupriavidus necator culture fed with a mix-ture of acetate and propionate [18], the VFA uptake kinet-ics were observed to be different from the mixed microbial cultures enriched with either acetate or propionate, despite the fact that the initial fraction of acetate and pro-pionate were the same in all cases (50:50 on a C-mol basis). The VFA uptake rate observed in the acetate enriched culture is much higher than in pure cultures (about twofold), whereas, the propionate enriched cul-ture has only a slightly higher VFA uptake rate as com-pared to the pure cultures. The PHA production fluxes were observed to be much higher for the cases of the mixed cultures (78.0 and 68.6%), as compared to the pure culture (41.2%), during the feeding of a mixture of acetate and propionate. Additionally, despite the fact that the rel-ative propionate uptake rate is higher in pure cultures (63%) than in mixed cultures (51%), the fraction of pro-pionyl-CoA driven to propro-pionyl-CoA* is significantly lower (86% lower). This is due to the fact that a large por-tion of the propionate fed to Cupriavidus necator was first converted to acetyl-CoA prior to PHA production, unlike the mixed culture cases. This metabolic pathway causes a large loss of CO2 by the pure culture, thus lowering the PHA production efficiency. Furthermore, a large fraction of this propionyl-CoA converted to acetyl-CoA was then used for cell catabolism, contributing to the much higher carbon flux observed in the case of the pure culture as compared to the mixed cultures.
It should be noted that the carbon source used in pure cul-ture studies [18,37] was neither acetate nor propionate, but mixtures of yeast extract, meat extract and peptone. This could be one explanation for the inferior VFA uptake and PHA production results observed in these studies as compared to the present study, since the culture may
FBA results
Figure 9
FBA results. Figure shows FBA results obtained by
maxi-mizing the PHA flux (RPHA*) with a propionyl-CoA* content of 24% (C-mol basis). 0 0.1 0.2 0.3 0.4 0.5 0.6 R ea ct ion r a te s (m ol /( m o l.h )) R2 R3 R6 R8 R9 R10 RPHA*RPHBRPHVRPH2MV R1 RS R7
require an adaptation period to synthesize the necessary enzymes for the metabolism of acetate and propionate carbon sources. Alternatively, it may be that the microor-ganisms present in the mixed cultures are more efficient PHA producers when compared to the pure cultures of
Cupriavidus necator, due to the feast and famine regimen
imposed. An increased VFA uptake rate was observed for a pure culture of Amaricoccus kaplicensis when the length of the famine period was increased [38].
Conclusion
This paper presents a metabolic model of PHA copoly-mers production in mixed microbial cultures. The model was applied to two different cultures, obtained through two distinct enrichment protocols (selected with either acetate or propionate), under different feeding conditions (fed with either a single substrate or with mixtures of the two substrates). With this model, intracellular flux distri-butions for the different cases were calculated. Also, feed-ing scenarios were optimized by FBA targetfeed-ing maximal productivity of a copolymer with a desired monomeric composition. These results were benchmarked with pub-lished results of pure cultures of Cupriavidus necator. From these studies the following main conclusions may be highlighted:
• The substrate used for culture enrichment by feast and famine feeding has a high selective pressure on the organ-isms that compose the final culture in the sense that the organisms selected are those that most effectively metab-olize the adopted substrate.
• Sludge enrichment by acetate feeding through feast and famine regimen is much more selective towards a culture with high PHA storage fluxes and yields than when propi-onate is used.
• The P/O ratio is highly dependent on the substrate and the microbial culture selected. Acetate metabolism has a consistently higher P/O ratio (close to the theoretical maximum of 3 mol-ATP/mol-NADH2) than propionate metabolism.
• MFA studies suggest that when mixtures of acetate and propionate are fed to the cultures, the catabolic activity is primarily guaranteed through acetate uptake. Coherently, the acetate P/O ratio tends to prevail over that of propion-ate when both substrpropion-ates are fed simultaneously.
• The application of FBA targeting the optimization of the PHA synthesis flux with a 24% (C-mol/C-mol) propionyl-CoA* composition revealed that acetate should be fed in Table 6: Fluxes distribution for acetate and acetate + propionate feeding between mixed microbial cultures and Cupriavidus necator
Feeding Acetate Acetate + Propionate
Culture enrichment Acetate Propionate Acetate Propionate
Cultures Mixed microbial cultures
(This work)
Cupriavidus necator [37] Mixed microbial cultures
(This work)
Cupriavidus necator [18] Substrate uptake rate (C-mol/(C-mol.h))
VFA uptake rate 0.73 0.21 ≈ 0.441 0.67 0.45 ≈ 0.381
Acetate uptake rate 0.33 0.22 ≈ 0.161
Propionate uptake rate
- - - 0.34 0.23 ≈ 0.221
Carbon and oxygen flux distribution (%) Carbon converted to growth 0.7 3.3 15.0 2.0 3.3 8.7 Carbon converted to CO2 25.7 35.0 37.8 20.0 28.1 50.1 Oxygen consumed per carbon 16.5 27.3 19.8 14.7 24.3 -Carbon converted to PHA 73.6 61.7 47.2 78.0 68.6 41.2 Carbon converted to Ac-CoA* 73.6 61.7 47.2 45.2 39.5 36.9 Carbon converted to Propionyl-CoA* - - - 32.8 29.1 4.3
excess whereas the feeding of propionate should be lim-ited to ~0.17 C-mol/(C-mol.h). Under excess of both sub-strates the final propionyl-CoA* content is around 42% (C-mol/C-mol).
• By comparing metabolic fluxes between mixed and pure cultures of Cupriavidus necator it can be concluded that the PHA production process by mixed microbial cultures has the potential to be comparable or even more favourable than what is achieved by pure cultures.
Although the metabolic characterization of mixed cul-tures was shown in this study to be highly favourable and promising, it should be noted that these results were obtained under ammonia limitation, thus, with condi-tions where cells growth is negligible. The compatibility of high cell growth rates with high PHA synthesis fluxes in mixed cultures is still not undoubtedly demonstrated in the literature.
Abbreviations
Acronyms: ASM3: activated sludge model No. 3; DO:
dis-solved oxygen; FBA: flux balance analysis; GAO: glycogen-accumulating organisms; 3HA: 3-hydroxyalkanoate; 3HB: 3-hydroxybutyrate; 3H2MB: 3-hydroxy-2-methylbutyrate;
3H2MV: 3-hydroxy-2-methylvalerate; 3HV:
3-hydroxyva-lerate; HRT: hydraulic retention time; MFA: metabolic flux analysis; MFD: metabolic flux distribution; PAO: polyphosphate-accumulating organisms; PHA: poly-hydroxyalkanoates; PHB: poly(3-hydroxybutyrate); PHV: poly(3-hydroxyvalerate); PH2MV: poly(3-hydroxy-2-methylvalerate); P/O ratio: ATP synthesis/oxygen con-sumption ratio; rmse: root mean squared error; SBR: sequencing batch reactor; SRT: sludge retention time;
TCA: tricarboxylic acid cycle; VFA: volatile fatty acids; VSS:
volatile suspended solids. Symbols: Ac: acetate/acetate con-centration (C-mmol/l); fi: intracellular PHA, PHB, PHV and PH2MV contents (C-mol/C-mol); fPHA, max: maxi-mum intracellular PHA contents (C-mol/C-mol); K1, K2: energy requirements for biomass synthesis (mol-ATP/C-mol); KS: acetate and propionate half-saturation constants (C-mmol/l); KN: ammonia half-saturation constant (N-mmol/l); mj: maintenance on component j [C-mol/(C-mol.h)]; mATP: maintenance coefficient on ATP [mol-ATP/
(C-mol.h)]; N: ammonia/ammonia concentration (N-mmol/l); O2: oxygen/oxygen concentration (mmol/l);
Prop: propionate/propionate concentration (C-mmol/l);
Ri: specific rate of reaction on compound i [C-mol/(C-mol.h)]; Ri, max: maximum specific rate of reaction on compound i [C-mol/(C-mol.h)]; S: total VFA/total VFA concentration (C-mmol/l); t: culture runtime (h); X: active biomass/active biomass concentration (C-mmol/l);
y: fraction of propionate uptake rate in the total VFA
uptake rate; Yi/j: yield of component i on component j (C-mol/C-mol); α: PHB production saturation order
con-stant (dimensionless); δ: efficiency of oxidative phospho-rylation (mol-ATP/mol-NADH2).
Authors' contributions
All authors read and approved the final manuscript. JMLD and RO developed the software. JMLD, AO and RO partic-ipated in the model implementation. LSS and PCL per-formed experimental work. MAMR and RO designed and coordinated the study. JMLD, AO and RO drafted the manuscript.
Acknowledgements
This work was supported by Fundação para a Ciência e a Tecnologia (FCT) through the project POCI/BIO/55789/2004 and by the Integrated Project no. 026515-2: Bioproduction – Sustainable Microbial and Biocatalytic Pro-duction of Advanced Functional Materials. J. Dias, A. Oehmen and L. Ser-afim acknowledge FCT for grants SFRH/BD/13714/2003, SFRH/BPD/ 41486/2007 and SFRH/BPD/14663/2003.
References
1. Dias JML, Lemos PC, Serafim LS, Oliveira C, Eiroa M, Albuquerque MGE, Ramos AM, Oliveira R, Reis MAM: Recent advances in
pol-yhydroxyalkanoate production by mixed aerobic cultures: From the substrate to the final product. Macromolecular
Bio-science 2006, 6(11):885-906.
2. Beccari M, Majone M, Massanisso P, Ramadori R: A bulking sludge
with high storage response selected under intermittent feeding. Water Research 1998, 32(11):3403-3413.
3. Satoh H, Iwamoto Y, Mino T, Matsuo T: Activated sludge as a
pos-sible source of biodegradable plastic. Water Science and
Technol-ogy 1998, 38(2):103-109.
4. Serafim LS, Lemos PC, Oliveira R, Reis MAM: Optimization of
pol-yhydroxybutyrate production by mixed cultures submitted to aerobic dynamic feeding conditions. Biotechnol Bioeng 2004, 87(2):145-160.
5. Albuquerque MGE, Eiroa M, Torres C, Nunes BR, Reis MAM:
Strat-egies for the development of a side stream process for poly-hydroxyalkanoate (PHA) production from sugar cane molasses. Journal of Biotechnology 2007, 130(4):411-421.
6. Bengtsson S, Werker A, Christensson M, Welander T: Production
of polyhydroxyalkanoates by activated sludge treating a paper mill wastewater. Bioresour Technol 2008, 99(3):509-516.
7. Temudo MF, Kleerebezem R, van Loosdrecht M: Influence of the
pH on (open) mixed culture fermentation of glucose: A che-mostat study. Biotechnol Bioeng 2007, 98(1):69-79.
8. van Aalst-van Leeuwen MA, Pot MA, van Loosdrecht MCM, Heijnen JJ: Kinetic modeling of poly(beta-hydroxybutyrate)
produc-tion and consumpproduc-tion by Paracoccus pantotrophus under dynamic substrate supply. Biotechnol Bioeng 1997, 55(5):773-782.
9. Third KA, Newland M, Cord-Ruwisch R: The effect of dissolved
oxygen on PHB accumulation in activated sludge cultures.
Biotechnol Bioeng 2003, 82(2):238-250.
10. Dias JML, Serafim LS, Lemos PC, Reis MAM, Oliveira R:
Mathemat-ical modelling of a mixed culture cultivation process for the production of polyhydroxybutyrate. Biotechnol Bioeng 2005, 92(2):209-222.
11. Lemos PC, Serafim LS, Reis MAM: Synthesis of
polyhydroxyal-kanoates from different short-chain fatty acids by mixed cul-tures submitted to aerobic dynamic feeding. Journal of
Biotechnology 2006, 122(2):226-238.
12. Lafferty M, Korsatko B, Korsatko W: Microbial Production of
Poly-β-hydroxybutyric acid. Volume 6b. Weinheim: VCH
Publish-ers; 1988.
13. Anderson AJ, Dawes EA: Occurrence, Metabolism, Metabolic
Role, and Industrial Uses of Bacterial Polyhydroxyal-kanoates. Microbiological Reviews 1990, 54(4):450-472.
14. Lee SY: Plastic bacteria? Progress and prospects for
polyhy-droxyalkanoate production in bacteria. Trends in Biotechnology