Equity Valuation – Grupo Semapa
Firm Valuation Theory Applied
Miguel Santos Fonseca Patrão
152111004
Supervisor:
Dr. José Carlos Tudela Martins
Dissertation submitted in partial fulfillment of requirements for the degree of
MSc in Business Administration, at the Universidade Católica Portuguesa
Equity Valuation – Grupo Semapa
1
Semapa Price Target (€) 16,57 € Price (08 Feb. 13) 7,19 € Potential +130%Reuters Code SEM.LS
Bloomberg Code SEM.PL
52W Low/High (€) 4,60 - 7,41
Number of Shares (mn) 112,9
Market Cap (mn €) 811,6
Average Daily Vol. (k shares) 56,2
Source: Bloomberg, Reuters & own calculations
Holding/Pulp&Paper
BUY/BUY
March 2013
Portugal
Portucel Price Target (€)3,19 €
Price (08 Feb. 13)2,83 €
Potential+13%
Reuters Code PTI.LS
Bloomberg Code PTI.PL
52W Low/High (€) 1,68 - 2,92
Number of Shares (mn) 767,5
Market Cap (mn €) 2.172
Average Daily Vol. (k shares) 202,4
Source: Bloomberg, Reuters & own calculations
Semapa: The Group Holding
Semapa is a holding company that currently owns 78,1% of the pulp and paper producer Grupo Portucel Soporcel, 100% of the cement company Secil S.A., 96% of the small environment related company, ETSA Group and 50% of the Brazilian cement producer Supremo Cimentos S.A. .
Portucel is the largest company under Semapa’s control, representing 72,7% of the group’s total revenue in 2012 (excluding holding costs). Secil follows, with 24,8% of the group’s revenues, while ETSA and Supremo account for the remaining 2,6% of revenues.
Portucel: The Pulp & Paper Specialist
Semapa’s main asset, Portucel is a paper & pulp producer with installed capacity for 1.585 thousand tons of paper and 1.590 thousand tons of pulp. Portucel also has backup operations in the energy and wood segments, representing 11% of the company’s total revenues.
Secil: The Cement Producer
Semapa acquired the remaining 49% of Secil in May 2012. The cement company has a strong presence in Portugal, Angola and the North African markets of Tunisia and Lebanon, with a total of 6.850 thousand tons of capacity.
ETSA: Environment & Waste Management
ETSA is an environmental company that operates in the industry of collection and processing of animal waste. The company is 96% owned by Semapa and reported 33M€ in revenues last year, accounting for 1,6% of the group’s total.
Supremo: The New Acquisition
Semapa acquired 50% of the Brazilian cement company in 2012. The company has an ongoing investment plan that will increase its capacity to 1.700 thousand tons.
Semapa/Portucel
Historical Relative Share Price Performance
Equity Valuation – Grupo Semapa
2
Portucel has proven itself as a high performance
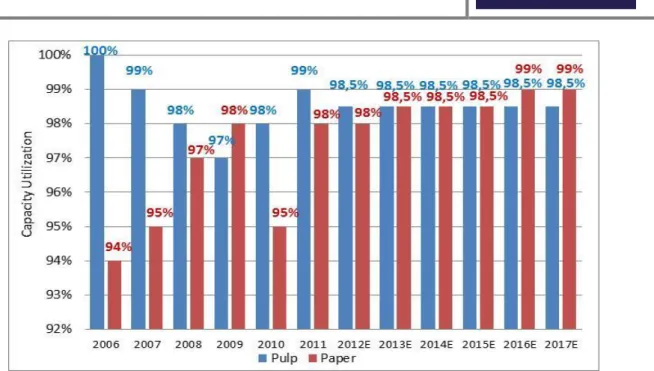
producer, owning the largest and most efficient paper plants in Europe, continuously operating at near 100% capacity throughout the crisis and with expectations to carry on this way.
The opening of the new paper mills have increased the integration of pulp in the paper production, thus reducing the company’s exposure to the pulp prices, which presented a volatility above 115% over the past 12 years.
Furthermore, the company operates in 115 countries throughout the world, with a wide variety of established brands, and a strong vertical integration model (energy, wood, pulp and paper) that allows it to mitigate to a large extent the inherent business risks. Besides pulp and paper price and demand, the main risk factors for companies in this industry are wood and energy prices.
After the large investment in the new paper plant, the company’s plans are to further invest in its vertical integration and internationalization. The first step is already underway with the prospect of an investment in woodlands in Mozambique.
Secil has managed to maintain its market share in the
face of the recent decline in the construction sector in spite of a reduction in the operating margins.
The company’s sales are directly dependent on the activity in the construction industry, which is highly sensitive to macroeconomic factors.
DCF Assumptions t = 25,60% Rf = 1,37% MRP = 6,30% Beta = 0,89 E/V = 0,50 Kd = 5,6% Ke = 13,0% g = 2% WACC = 8,6%
Source: Reuters, Bloomberg & own calculations
Portucel (million €) 2010 2011 2012E 2013E 2014E 2015E 2016E 2017E
Revenues 1.385 1.488 1.485 1.635 1.639 1.668 1.694 1.725
EBITDA 399 391 390 391 375 377 395 370
EBITDA Margin 29% 26% 26% 24% 23% 23% 23% 21%
EBIT 278 266 285 290 277 282 304 282
Net Financial Costs -20 -16 -25 -22 -26 -39 -41 -44
Income tax -47 -54 -73 -75 -64 -63 -67 -61 Net Income 211 196 187 193 187 182 196 178 CAPEX -96 -54 -40 -42 -43 -44 -45 -45 Dividends 0 165 103 106 103 100 108 98 Changes in WC -65 -17 -19 -16 0 -3 -2 -3 FCFF 167 251 258 259 261 258 271 249
Source: Portucel Annual Reports & own calculations
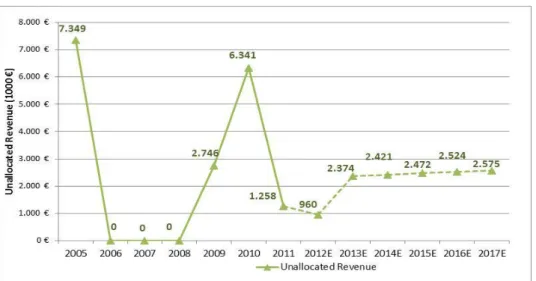
Source: FOEX & own calculations Source: Portucel 2012 Interim Report
Equity Valuation – Grupo Semapa
3
Semapa (mn€) EV Net debt Stake Equity Value
Portucel 2.842 462 78,1% 1.859 Secil 979 126 100% 853 Supremo 182 11 50% 86 ETSA 59 23 96% 35 Holding -141 820 -961 Total (mn€) 3.921 1.442 1.871 Shares (#mn) 112,9
Price Target (€/share) 16,57
Current Price (08 Feb. 2013) 7,19
Upside Potential (%) 130%
Recommendation BUY
Source: Companies' Annual Reports, Bloomberg & own calculations
For this reason, the company was seriously impacted by the recent crisis and the general decline in public investments in new buildings and infrastructures, which was particularly felt in Portugal.
Secil’s strategy is to internationalize and to reduce the weight of the declining Portguese market. The obvious conclusion is that Lebanon, Tunisia and Angola’s construction industry play a central role in Secil’s future.
While cement consumption should increase in these markets, Secil’s biggest challenge will be to maintain its market share despite the strong Chinese competition.
t =
24,50%
Rf =
1,37%
MRP =
6,30%
Beta =
1,37
E/V =
0,50
Kd =
6,8%
Ke =
15,9%
g =
2,5%
WACC =
10,5%
Source: Reuters, Bloomberg & own calculations
DCF Assumptions
Secil (million €) 2010 2011 2012E 2013E 2014E 2015E 2016E 2017E
Revenues 536 507 488 477 482 496 505 516 Portugal 305 274 244 229 222 217 212 209 Lebanon 77 81 88 94 100 108 113 116 Tunisia 65 61 64 64 69 76 83 89 Angola 28 31 34 34 35 36 37 39 Cape Verde 6 7 7 7 7 7 9 10 Others 55 54 51 47 49 51 52 53 EBITDA 160 132 129 127 135 134 137 140 EBITDA Margin 30% 26% 27% 27% 28% 27% 27% 27% EBIT 78 46 43 37 44 41 42 43
Net Financial Costs -5 -6 -7 -6 -7 -10 -12 -13
Income Tax -17 -10 -9 -8 -9 -8 -7 -7 Net income 56 30 27 24 28 24 22 22 CAPEX -44 -62 -34 -33 -34 -35 -35 -36 Dividends 29 18 21 15 14 12 11 11 Changes in WC -42 -12 35 12 3 -6 -1 -1 FCFF 55 45 119 96 94 83 90 92
Source: Secil Annual Reports & own calculations
Equity Valuation – Grupo Semapa
4
Abstract
This dissertation aims to value the intrinsic value of the holding Semapa, applying the Equity Valuation theory. In order to apply the most suitable methods and appropriate assumptions, this paper firstly outlines the existing valuation frameworks and techniques, along with the academic debates on the most relevant valuation topics. The valuation is done as the sum of the parts of the companies owned by Semapa – Portucel, Secil, ETSA and Supremo – using a Discounted Cash Flow approach and the Multiples approach. Lastly, this dissertation compares the methods used and the results obtained to those of an investment bank, analyzing the differences with the purpose of understanding the reasons behind the dispersions of values obtained from different valuation methods.
Equity Valuation – Grupo Semapa
5
Table of Contents
Abstract ... 4 Table of Contents ... 5 Literature Review ... 7 1. Introduction ... 72. Return Based approach ... 8
3. Options approach ... 9
4. Multiples approach ... 10
4.1. Price to Book Value (P/B) ... 12
4.2. Price to Earnings (P/E or PER) ... 12
4.3. Enterprise Value to EBITDA (EV/EBITDA) ... 13
5. Cash Flow approach ... 13
5.1. Equity Cash Flow (ECF) ... 14
5.2. Adjusted Present Value (APV) ... 15
5.2.1. Tax Shields ... 15
5.2.2. Bankruptcy Costs ... 16
5.3. Weighted Average Cost of Capital (WACC) ... 17
5.3.1. Growth Rate ... 17
5.3.2. Terminal Value ... 18
5.3.3. Valuation of companies operating in cyclical industries ... 19
Semapa Valuation ... 20
6. Company Introduction - Semapa ... 20
6.1. Portucel Soporcel Group ... 21
6.2. Secil Group ... 23
6.3. Supremo Cimentos, S.A. ... 23
6.4. ETSA Group ... 24
7. Macroeconomic scenario ... 24
8. Valuation of Semapa ... 26
8.1. Portucel Soporcel Group ... 27
8.1.1. Industry Overview ... 27
Equity Valuation – Grupo Semapa
6
8.1.1.2. Wood ... 28 8.1.1.3. Pulp ... 29 8.1.1.4. Paper ... 308.1.2. Discounted Cash Flow... 32
8.1.2.1. Revenues Assumptions... 33
8.1.2.2. Operational Costs Assumptions ... 39
8.1.2.3. Net Working Capital Assumptions ... 44
8.1.2.4. Depreciations and Capital Expenditures Assumptions ... 44
8.1.2.5. Debt and interest Assumptions... 48
8.1.2.6. Other Assumptions ... 51
8.1.2.7. Terminal Value Assumptions ... 51
8.1.3. Multiples Valuation ... 54
8.2. Secil Group ... 56
8.2.1. Discounted Cash Flow... 56
8.2.1.1. Industry Analysis ... 57
8.2.1.2. Operational Assumptions ... 62
8.2.1.3. Capital Structure Assumptions ... 71
8.2.1.4. Terminal Value Assumptions ... 72
8.2.2. Multiples ... 73
8.3. Supremo Cimentos S.A. ... 75
8.4. ETSA Group ... 77
8.5. Holding ... 78
8.6. Semapa final valuation ... 79
8.6.1. Sensitivity Analysis ... 81
Comparison with BESI valuation ... 83
Main Conclusions ... 87
Bibliography ... 88
Equity Valuation – Grupo Semapa
7
Literature Review
1. Introduction
The market value of a company is given by its stock price and reflects the general expectations of the investors and the impression they have of the company based on what they know about it. The problem is that no investor can know everything about the present and future of the company and industry, and therefore cannot make an absolutely precise valuation of the company’s current assets and future cash flows. This absolutely precise valuation of the company’s expected cash flows, discounted at the perfectly applicable discount rate, is called the intrinsic value of the asset (Damodaran 2006). The best valuation of a company is the one that estimates the closest value to the intrinsic value of its assets.
The first step towards making a valuation is to decide which valuation method is going to be applied. The range of possibilities to choose from is wide and growing continuously, as new valuation methods are created and the more traditional ones are revised, tweaked and complemented, generating new methods for valuating companies.
The existence of so many different methods and such a widespread academic interest on this matter can be explained by the fact that each approach offers a different perspective of the valuation problem, clarifying certain aspects while obscuring others (Young, Sullivan, Nokhasteh and Holt, 1999). The choice of “the right” valuation method is thus a matter of identifying which are the most relevant aspects of the company for valuation purposes and making a match between those company specific aspects and the existing valuation methods. Different authors consider different types of approaches, but in general terms there are four main valuation approaches (Damodoran 2006):
1. Cash Flow Approaches (e.g. Dividend Discount Model, Discounted Cash Flow) 2. Excess Returns Based Approaches (e.g. Dynamic ROE, Economic Value Added) 3. Multiples Approaches (e.g. P/E, P/BV, EV/EBITDA)
4. Options Approaches
Each of these approaches can then be branched into specific valuation methods, taking an equity valuation perspective – estimate the value of the firm to equity holders - or an Enterprise Value perspective – estimate the value of the whole enterprise, the debt and the equity (Young, Sullivan, Nokhasteh and Holt, 1999).
Each approach has its own merits and flaws and each its own utility, but no matter which method is applied, ultimately the assumptions made for the future are the main thing affecting the accuracy of the valuation. In fact, this thought is not recent and Modigliani & Miller had already come to this conclusion by 1961, arguing that any two approaches taken to valuing a company are equivalent and in no way opposing, as long as they are implemented correctly and take the same assumptions and basic accounts into consideration, adding that the choice between them is “a matter of taste and convenience” (F. Modigllani & M. Miller “Dividend Policy, Growth and the Valuation of Shares”, Journal of Business, 1961).
Equity Valuation – Grupo Semapa
8
Nowadays, this philosophy is widespread in the field’s literature, with Young, Sullivan, Nokhasteh and Holt (1999) considering that “every popular valuation approach is simply a different way of expressing the same underlying model” and proving this mathematically, under certain assumptions (Young, Sullivan, Nokhasteh and Holt, 1999). Fernandez (2003) compares ten different DCF methods and proves that all of them give the same value if under the same assumptions, concluding that the only practical difference between them is the cash flows taken as a starting point for the valuation. Penman (1998) also came to the conclusion that any methods that are apparently different, if carried out correctly, will yield the same valuation.
However, all this isn’t to say that the choice of the valuation method is irrelevant. Some methods may be inadequate considering the information available or the industry and the company at play, while others may neglect or miss value some specific valuable assets. Ultimately, any one method will offer only a partial picture of the company, from a specific point of view (Young, Sullivan, Nokhasteh and Holt, 1999). Taking an integrated approach, by selecting the most appropriate method and complementing it with another, will produce a fuller picture, improving the quality of the valuation.
Although it isn’t the purpose of this study to detail all the existing methods for valuation, it is appropriate to explain each general approach and some relevant methods within them in order to substantiate the approach and methods chosen to undertake in the valuation of Semapa. Considering that what actually explains the valuation outcomes are the assumptions made, it is also relevant to describe the possible methodologies to deal with the different key inputs of the model that are subject to forecasts and assumptions (e.g. cost of capital, tax shields, growth rates, bankruptcy costs, etc…) and the industry specificities that may significantly affect the valuation.
2. Return Based approach
Returns Based approaches are based on the intrinsic concept of residual income. This concept, meanwhile, focuses on the premise that stockholder value is created only when the earnings on total invested capital are higher than the cost of that capital (Biddle, Bowen and Wallace, 1999). The main difference between this and other methods is that it focuses on the excess returns, as opposed to all cash flows or net income. This way, the model highlights that earnings themselves don’t create value, but instead only earnings in excess of a required return (Damodaran 2006).
Using this approach, the value of a firm is the value invested in it, plus the spread between the return and the cost of capital (Young, Sullivan, Nokhasteh and Holt, 1999 and Damodaran 2006). This way, two main methods can be used to value a firm:
Dynamic ROE
Market Value is current book value (BV) plus the discounted value of future excess returns (VA). Excess return is the difference between the return on equity capital and the cost of equity capital (Young, Sullivan, Nokhasteh and Holt, 1999).
Equity Valuation – Grupo Semapa
9
Economic Value Added
Enterprise Value is current capital stock (K) plus the discounted value of future EVA. Excess return (EVA) is the difference between the return on capital and the cost of capital. Market Value is Enterprise Value minus the value of debt. K* is the equilibrium value of the capital stock in the terminal year (Young, Sullivan, Nokhasteh and Holt, 1999).
Many authors consider this method to be a rearrangement of DCF (Young, Sullivan, Nokhasteh and Holt, 1999), however, Stern Stewart, the proprietor of EVA, argues that this method better correlates with stock returns and firm value than net income. Contrariwise, tests conducted by Biddle, Bowen and Wallace (1999) showed that this wasn’t true and in fact EVA and residual income “had little incremental information content beyond that contained in Net Income”. They conclude, in the same paper, that EVA is a good tool to align managers with shareholders’ interests and to be used for internal incentive purposes.
However, in what concerns the valuation of Semapa, this method proves to be inadequate as “it conveys little news to market participants regarding the firm’s valuation” (Biddle, Bowen and Wallace 1999).
3. Options approach
This approach, also called contingent claim valuation, is very useful for valuing specific situations where a company has a future option (Damodaran, 2006). This can be the case, for example, for companies with new technologies that aren’t yet being used to create value but can be in the future or companies with product development ideas that haven’t been implemented yet (Luerhman, 1997).
More generally, any investment done today that, instead of direct cash returns, produces the opportunity to engage in some kind of value-generating activity in the future, should be valued using an options approach. This means that the company has the right, but not the obligation, to exploit this opportunity. Ultimately, the decision may be not to engage in this activity, but the option to do it or not is valuable nonetheless (Luerhman, 1997). In fact, as Luerhman (1997) put it “for some companies, opportunities are the most valuable things they own”. Typically options methods are used to value stock options. The most commonly used method is the Black-Scholes Model. In short, this model uses probability theory applied to discounted cash flows and expected value calculations to compute the underlying value of the stock option (Black and Scholes, 1973).
This approach, however, is largely considered by the field’s academics as more complex (despite being an oversimplified version of reality), less intuitive and harder to apply than other classic methods such as DCF or multiples. Even the more fierce defenders of this approach recognize that it should be used as a complement, and not a replacement, of another method (Luerhman, 1997).
Therefore, an options approach will only be used in this paper if an objective and significant future opportunity for Semapa is detected.
Equity Valuation – Grupo Semapa
10
4. Multiples approach
In the multiples approach the company’s value is estimated based on analogous information from similar companies. For this reason, and unlike the other valuation methods, it is considered a relative valuation. It values an asset by observing the pricing of other assets deemed “comparable”, relative to a common variable such as sales, enterprise value, earnings or cash flows (Damodaran 2006).
The successful application of this approach is dependent on two critical factors:
The peer group chosen to compare the company to;
The multiples chosen as most appropriate to value the company.
There are many different methodologies and views on how to choose the most appropriate peer group. As Bhojraj and Lee (2001) state in their paper “Who is my peer?” this process is often viewed by practitioners as ”an art form that should be left to professionals”. According to these authors, peers should be chosen based on the variables that drive the differences in ratios within the industry.
There are plenty of variables driving differences in ratios in every industry. However, some factors seem to overlap in most articles on the subject, indicating that they are the most crucial indicators for choosing a peer group. These factors are:
the industry;
risk exposures;
earnings, costs and profitability;
growth rates;
cost of capital;
capital structure.
Choosing companies operating in the same industry is a must, as the industry’s specificities and volatility explain a big parcel of the company’s earnings and growth perspectives. Finding these companies is a good start, however, it isn’t enough. Companies in the same industry can still differ significantly by size, stability, profit margins, growth perspectives, capital structures and even the operational activity, portfolio of products and risk exposure.
For this reason, the companies should be analyzed in detail to guarantee they have a similar modus operandi in terms of products/services offered, general operations and risk exposure. The following triaging step should be to use companies with similar market capitalization, ROIC and growth projections (Goedhart, Koller and Wessels, 2005).
The “peer group” is the group of identical companies obtained after filtering out all inconsistent ones, according to the relevant indicators. If the selection was done right, the average multiples from this peer group should give us a rough picture of the company we are analyzing.
Equity Valuation – Grupo Semapa
11
Liu, Nissim and Thomas showed in the paper “Equity Valuation Using Multiples” (2001) that forward looking multiples are the ones that best explain stock prices, followed by historical earnings measures, cash flow measures and book value of equity, while sales based multiples perform the worst.
This ranking proved to be the same for all industries analyzed, leading the authors to conclude that different industries don’t have their own “best” multiple, but instead, the right multiples should be applicable to every industry.
These ideas were followed by Goedhart, Koller and Wessels (2005), who add that P/E multiples can be manipulated by capital structure and therefore be misleading. They suggest using Enterprise Value multiples instead.
This view is shared by Liu, Nissim and Thomas (2001) who argue that enterprise based multiples are superior to equity based multiples, founded on the argument that the second can be influenced by the company’s capital structure. For this reason, enterprise based multiples make it easier to find truly comparable peer groups and thus improves the accuracy of the valuation.
On the other hand, using an equity perspective can simplify the analysts’ life in the sense that he doesn’t have to consider debt. While this simplification has its benefits and widens the range of potential comparable companies, it can be misleading since companies with significantly different leverage ratios are not comparable, even if we are only comparing the equity value.
Despite all these minor discussions regarding the peer group selection criteria and the best multiples to apply, the multiples approach is widely viewed as the simplest. Although it is subject to appropriating any mistakes done in the previous valuations of the peer companies analyzed, it is a good way to complement another method used to estimate the company’s intrinsic value (e.g. DCF method).
Unlike the options approach, that should be used to value a specific opportunity for the company, multiples can be used to do a “reality check” and to get an overall picture of the range of values for the whole company (Goedhart, Koller and Wessels, 2005). This is the way the multiples approach will be used in this paper: as a complement to a DCF method.
Given the vast number of existing multiples, I will not analyze all of them in detail in this paper. Instead, I will select a few of the most commonly used multiples, from both an equity and an enterprise perspective.
Some of the multiples that will not be analyzed in this paper include: Equity perspective:
Dividend yield
Price/Sales
Equity Valuation – Grupo Semapa
12
Enterprise perspective: EV/EBIT FCF yield EV/Invested Capital4.1. Price to Book Value (P/B)
P/B is an equity perspective multiple. This multiple is best used for capital intensive firms that depend on a high asset base (e.g. banks). It compares the company’s market value to its intrinsic book value. It is computed by dividing the share price by the last quarter’s tangible assets’ book value per share.
=
⁄Investors often look at companies with low P/B as potential growth targets. This multiple indicates the value that the market is placing on the assets of the company. Therefore, if the multiple is low, than the assets are undervalued.
The limitations of this multiple are related to the lack of reliability of the book value of the assets reported. This happens mainly for three reasons. For one, the assets are reported at historical cost. Secondly, they are referring to the value at the date of the report. And lastly, the report of the book value is subject to many different accounting policies. For all of these reasons, the analyst must be very careful when using this multiple.
4.2. Price to Earnings (P/E or PER)
P/E is the most commonly used equity multiple. One of the reasons for this is that all the needed information is widely accessible for any quoted company. All we need is the share price and the earnings per share (EPS).
=
=
A high P/E multiple may indicate that investors are expecting higher earnings growth in the future. One of the attributes of this multiple is that it relates company value to profit. However, if profits are negative the EPS will be negative. In this case the multiple can’t be used to estimate the firm’s value.
Another deliberation that should be made when using this multiple is which year’s net income should be used to estimate the current value of the firm. One can use last year’s value or the forecasted value for the end of the current year. Both options can be used if they are properly supported, guaranteeing that no extraordinary revenues or expenses, that will not be repeated in other years, happened during that period.
Equity Valuation – Grupo Semapa
13
4.3. Enterprise Value to EBITDA (EV/EBITDA)
This is the most popular enterprise multiple. The main reason is the fact that it includes debt through the EV and therefore allows comparisons between companies with different capital structures. It is also very simple to compute:
=
Low EV/EBITDA multiples is a signal of a good takeover candidate. This happens because the multiple intrinsically includes the debt that the acquirer would have to assume. Another positive aspect of this multiple is that, as opposed to EV/EBIT, it is neutral to depreciation and tax policy, making it a good measure for cross-national comparisons.
On the other side, ignoring depreciations and taxes may also lead to omissions of value created through taxes or depreciations. Also, being a very cash-dependent multiple, it is very susceptible to variability caused by growth rates, earnings estimates or cycles in the industry.
5. Cash Flow approach
“Discounted cashflow (DCF) valuation, relates the value of an asset to the present value of
expected future cash flows on that asset.”
(Damodaran 2006) Based on my research, this approach is clearly the most popular and academically acclaimed. It is based on this premise that the present value of an asset is the sum of all future cash flows on the asset, discounted back at a rate that reflects the riskiness of these cash flows (Damodaran 2006). In practice, it stands on the principle that the value of an asset is based on its ability to generate cash and value, and not on what people perceive it to be worth.
This approach rests on four main inputs:
Earnings and cash flows
Growth rate
Discount rate
Judgement on when the company will enter the “steady state”
DCF entails forecasting all free cash flows until they stabilize (“steady state”). By applying a perpetual growth to these cash flows, a Terminal Value is computed. The sum of this Terminal Value and all forecasted Free Cash Flows, discounted back to present using a discount rate (r), is the value of all the company’s assets. This output of a typical DCF valuation is the Enterprise Value (EV). The equity value is obtained by deducting all types of debt from the EV.
Equity Valuation – Grupo Semapa
14
Although this seems straightforward, there are in fact many variants of the DCF method itself. Most relevant disagreements in academia derive from the differences in perspective that Young, Sullivan, Nokhasteh and Holt (1999) considered to bifurcate all valuation analysis. Fernandez (2003) and Damodaran (2006) generalized three major techniques to apply a DCF method:
1. From an equity holder viewpoint, discounting the expected cash flows to equity at the cost of equity
2. From the viewpoint of all claimholders, using the weighted average cost of capital to discount expected cash flows
3. Valuing the business first, as if it had no debt, and then compute separately the added value of having issued debt (APV)
DCF is the simplest approach to use for firms with positive, reliable and fairly stable cash flows and where risk can be estimated with some precision. This may not be the case if the firm has any significant unutilized assets, patents or any other product options that would invite an Options Based valuation. It may also be troublesome to apply DCF if the firm is in trouble or undergoing significant restructuring that may affect the predictability of expected cash flows and the usefulness of historical data (Damodaran 2006).
As I will show later in this paper, Semapa is a cyclical company, undergoing relevant acquisitions and with some fast growing segments. However, for reasons I will explain along the paper, its cyclical characteristics will not endanger the company or significantly affect the cash flows’ predictability, and the major acquisitions that happened during the present year of 2012 will not affect the operations of the company, but only the scale of the cash flows. The only exception is the acquisition of 50% of the Brazilian cement company Supremo, but this case will be analyzed individually.
For this reason, and taking into consideration that Semapa has no relevant unutilized assets or product options, the Discounted Cash Flow approach was chosen as the most appropriate to value Semapa.
5.1. Equity Cash Flow (ECF)
One way to apply DCF is taking an equity perspective. This method is called Equity Cash Flow (ECF) or Flows to Equity. It is a straightforward measure used to estimate the cash flows to be paid to equity holders. This method considers only the cash flows to equity and discounts them at the required return on levered equity (Ke) (Luerhman, 1997 and Fernandez, 2003). The output of this approach will be the value of equity. Thus, the value of debt must be added to compute the full Enterprise Value.
E =
+
+ (…) +
The main differences to the other methods are the cash flows and the discount rate used. The cash flows to equity are computed as the free cash flows deducted from all debt charges and repayments, therefore yielding only the cash available to equity holders (mainly dividends and
Equity Valuation – Grupo Semapa
15
share repurchases). The discount rate (Ke) is the rate of return required by the equity holders, which is different and independent from the cost of debt (Kd).
This sort of method is useful when deb cash flows should be examined explicitly (Damoadaran, 2006). However, in the Semapa case the company’s capital structure and debt levels are stable and not too significant. Therefore, this method offers no added value to the valuation at hand.
5.2. Adjusted Present Value (APV)
APV consists on separating the valuation in two parts: a) The operational value of the company and;
b) The value of all financing side effects (Luehrman, 1997)
The main advantage of this method is its simplicity. APV is based on the principle of value additivity: it splits the company into pieces, values each piece individually, and adds them back together. The sum of all the pieces equals the Entreprise Value (Luerhman, 1997).
In simple terms, the firm value under an APV method can be summarized as:
Value of business = Value of business with 100% equity financing + Present Value of Expected Tax Benefits of Debt – Expected Bankruptcy Costs (Damodaran, 2006) This method supports the idea that companies don’t set debt targets as a percentage of market value, but instead as an absolute value (Damodaran, 2006) and, as opposed to the WACC approach, APV uses the required return to assets as the discount rate, which is not affected by capital structure changes (Fernandez, 2003).
On the paper entitled “WACC or APV?” Jaime Sabal pointed out that APV’s virtues are very useful when valuing small companies with unstable debt ratios, or companies operating in very volatile industries, countries with complex or inconstant tax legislations or anywhere with high economic uncertainty affecting the leverage of the company. On the other hand, for larger companies operating in advanced and stable countries, WACC is a more appropriate method. Semapa, however, stands out for the reliability of its earnings and their high stability levels, even in volatile countries, and particularly the high efficiency of its biggest division, which is the pulp and paper company, Portucel. Therefore, calculating the impact of debt separately from the value of the firm is not necessary, deeming WACC a suitable method to value the company.
5.2.1. Tax Shields
The main source of disagreement regarding the APV calculation is the way to value the tax shields.
There are many theories regarding this subject. Modigliani and Miller (1963) stated that the value of tax shields could be computed by discounting the expected future tax shields at the risk free rate (Rf). Myers (1974), Taggart (1991) and Luerhman (1997) propose using the cost of debt (Kd) as the discount rate for the tax shields. Harris and Pringle (1985) and Kaplan and
Equity Valuation – Grupo Semapa
16
Ruback (1995) defend that the required return to the unlevered equity (Ku) should be used instead. Miles and Ezzel (1980) accept both perspectives, but state that the most appropriate way to discount the tax shields is using Kd for the first year and Ku for the following years. The main difference in perspective can be summarized in two different strands:
Those who believe that the risk of the tax savings arising from the use of debt is the same as the risk of debt itself (Fernandez, 2003);
And the others, who believe that the level of debt is volatile and varies according to the operational needs of the company and, for this reason, the risk of the tax shields is the same as the operational risk of the company (Fernandez, 2003)
Fernandez (2004) went even further on his paper entitled “The value of tax shields is NOT equal to the present value of tax shields”, arguing that the value of tax shields should be computed as the difference between the value of the levered firm, with tax savings included, and the same firm as if it was unlevered, without any tax savings. However, Cooper and Nyborg (2006), supported by Damodaran (2006), have proven this theory wrong, showing that the value of tax shields should be computed as the present value of expected tax savings discounted at the cost of debt (Kd).
There is definitely no consensus regarding this subject. Copeland, Koller and Murrin (2000) state that there is no single method that is “theoretically correct”, but instead each analyst should choose the approach that best suits the situation.
5.2.2. Bankruptcy Costs
Bankruptcy costs are part of Modigliani and Miller’s theory on optimal capital structure. They already understood by then that bankruptcy costs are the reason why a company can’t be fully leveraged. Bankruptcy costs should be balanced with tax shields to obtain the optimal capital structure.
However, Modigliani and Miller didn’t leave a clear explanation of how bankruptcy costs should be computed for a running company and no academic has generated a consensual theory since. In simple terms, the expected bankruptcy costs can be computed as:
Expected Bankruptcy Costs = Probability of Bankruptcy x PV of Bankruptcy Costs
(Damodaran, 2006)
This is based on the assumption that a higher level of debt will result in a higher probability of default and thus higher bankruptcy costs (Warner, 1977). Although not computed separately, this value is included indirectly on the WACC method, reflected as higher costs of debt and equity as default risk increases (Damodaran, 2006). However, in the APV method, this value must be computed separately, which is the source of some disagreement around this method. The general figure that is most commonly used in the modern days as an estimate of bankruptcy costs is 20% of the value of the estate. This value can be traced back to Baxter’s paper in 1967 and was later supported by Stanley and Girth (1971) and Van Home (1976). However, the more recent papers of Warner (1977) and Miller (1977) seem to disagree. Their
Equity Valuation – Grupo Semapa
17
argument is that the earlier papers were based on individuals or small sized companies, sometimes even undergoing liquidation processes, instead of reorganization. Warner’s study shows that that the ratio between direct bankruptcy costs and the market value of the firm decreases as the value of the firm grows. He also shows that for big firms (in his case he used railroad companies) the average cost of bankruptcy usually ranges between only 1% and 5% of the market value of the firm before going bankrupt.
These large discrepancies, that were never completely resolved, show how difficult it is to accurately estimate these costs, which can have a significant impact on the company’s value. This difficulty can be partly explained by the impracticality of measuring the indirect bankruptcy costs, such as the energy and time dispersed by managers from other tasks or the averseness of customers and suppliers to enter into long-term commitments (Miller, 1977).
5.3. Weighted Average Cost of Capital (WACC)
The WACC is the most widely used DCF method for firm valuation. Since it is a “firm method” it uses the free cash flows to the firm as the basis for valuation while the cost of capital, as the name says, is calculated as a weighted average between the cost of equity and the cost of debt, adjusted for tax shield benefits:
WACC =
x Kd x (1-t) +
x Ke
As opposed to APV, it aggregates the effects of tax shields in the discount rate. This way, the value added by interest tax shields is automatically included in the present value of the firm (Luerhman, 1997). For this reason, the accuracy of this method is higher when the debt to capital ratio is stable.
On the other hand, using the same WACC over periods of significant capital structure changes may lead to valuation errors. For this reason, when using this method for companies with complicated capital structures or fund-raising strategies, WACC should be used very carefully and adjusted periodically (Luerhman, 1997).
5.3.1. Growth Rate
One very important and hard to determine figure in any valuation is the expected growth rate for the forecasted period and the terminal value. This is a prediction by the analyst of the growth at which the company will grow in the future. If this could be accurately predicted, any investor would know exactly where to invest. Since it isn’t so easy, we are left with a few estimation techniques. In “Growth Rates and Terminal Value” Damodaran suggests three main approaches:
Looking at the company’s past – the historical performance and growth of the
company’s earnings are a good base for predicting future behavior, assuming that conditions are met to behave in line with the past.
Looking at the competitors – the expected growth rates for companies in the same
Equity Valuation – Grupo Semapa
18
approach and comparing the industry (or a peer group) average as the estimate for the company can be a viable option.
Looking at the fundamentals – taking into consideration what the company is
investing and how much returns these investments are making, and assuming the investment rate and the return on investments will be stable in the future, the growth rate can be extrapolated.
Regardless of the technique used, the analyst should have well-defined criteria to choose the historical period. For cyclical companies, for example, this period should include an entire cycle. Additionally, any abrupt changes in past growth rates should be analyzed and explained, in order to understand if they are likely to be repeated or not. A sustainability analysis should also be conducted to verify if it is plausible that the present (or estimated) growth rates are going to be maintained into maturity.
5.3.2. Terminal Value
“The terminal value is generally by far the most important element in any valuation estimate.” These words were written by Young, Sullivan, Nokhasteh and Holt (1999). These authors argue that basing all the valuation on the terminal value estimate is not as incongruous as it may seem. In fact, their findings are that the terminal value represents on average 94% of the total firm value if three annual forecasts are made. This value is reduced to 79% of the total if ten annual forecasts are made. Nevertheless, the terminal value will represent a very sizable portion of the overall valuation.
Although computing merely the terminal value is definitely not the best way to achieve an accurate estimate for the overall value of the company, estimating it right is vital to that goal. In that sense Damodaran recognized three different ways to compute the terminal value. The first is considering the liquidation value of the company. If the assets are separable and marketable, then we can estimate how much they are worth and compute the present value. The second is a relative approach. In this case the analyst would simply use multiples from comparable companies and apply them to the company under analysis.
The other option is in Damodaran’s opinion the “technically soundest”. It is based on the assumption that the company will grow at a stable rate. The problem with this approach is that it requires judgment about when a company will grow at a stable rate, what is this rate and if it is sustainable.
Terminal Value =
Techniques to estimate the growth rate are described above, but in the terminal value’s specific case some other considerations mustn’t be overlooked. Since we are speaking of a perpetual growth rate the sustainability analysis should impose a cap on the growth rate that should be, at most, the economy’s growth rate. Damodaran suggests the risk-free rate as a proxy for the nominal growth rate.
Equity Valuation – Grupo Semapa
19
The definition of the beginning of the perpetual stable growth period can also be problematic. Typically, companies don’t grow above the industry average for long periods of time, but defining the exact duration of this period has to be done case-by-case (see Appendix 1).
5.3.3. Valuation of companies operating in cyclical industries
Calculating the terminal value for a company operating in a cyclical industry becomes even more complicated. De Heer, Koler, Schauten and Steenbeek (2000) gathered empirical evidence showing that analysts commonly make valuation mistakes when valuing cyclical companies.
The main reason for this occurrence is precisely the terminal value, since it is computed based on the cash flows from the last forecasted year (FCFF𝑛). If this year is in the peak or close to the peak of the cycle, we will overvalue the company. If, on the other hand this year is in the bottom of the cycle, the terminal value will be understated.
The best way to face this problem is to normalize earnings, cash flows and growth rates throughout the entire cycle (De Heer, Koler, Schauten and Steenbeek, 2000 and Damodaran, 2009). This way the value used as the base for the terminal value calculation will reflect a normalized value of the whole cycle instead of a specific point in the cycle.
Some general additional reflections, summarized by Damodaran (2009), must be made for commodity companies. For one they are price takers. For this reason the earnings’ variance closely reflects the price cycles of the commodities that the company deals with.
Another fact that shouldn’t be neglected is that the factories may be forced to keep operating all through the price cycle to avoid the costs of shutting down and reopening. This supports the idea that these types of companies are more subject to macro moves and therefore may have higher expected bankruptcy costs are more volatile debt ratios.
Finally, we must consider that commodities are finite. The impact of this feature must be taken into account for future commodity prices and perpetual growth estimation.
Equity Valuation – Grupo Semapa
20
Semapa Valuation
6. Company Introduction - Semapa
Semapa is a holding company that was founded in 1991 and has controlling stakes in industrial companies, mainly in the cement and pulp & paper industries. Semapa’s first relevant venture started in 1994 with the acquisition of 51% of Secil, a Portuguese cement company.
Following the acquisition of an additional 7,94% stake of Secil in 1995, Semapa acquired a 4,7% stake in Cimpor, a large Portuguese cement company. In the year 2000 the company acquired another stake of 4,3% of Cimpor and attempted the full takeover of the company, which would fail.
In 2000 Semapa started its internationalization with the acquisition of a Tunisian cement company, “Societé des Ciments de Gabés” and the launch of a cement subsidiary in Angola (“Tecnosecil”). The internationalization process progressed in the following years, with the acquisition of stakes in Algeria, Lebanon and Cape Verde by Secil.
2004 was to some extent a turning point for Semapa. This was the year it entered the pulp & paper industry, by acquiring 67% of Portucel. At the same time, Semapa reduced its presence in the cement industry, selling its 9% stake of Cimpor as well as a 49% stake of Secil in a transaction that valued 100% of Secil’s EV at nearly 900 M€.
In 2005 Semapa sold its 90% stake in Enersis, an electric power company it created in 1994. This deal was worth over 420 M€, which meant a capital gain of 390 M€ for Semapa.
Until 2009 Semapa reinforced its position in Portucel, finishing the year with a 77% stake, reinforced its international status by acquiring new stakes in cement companies in several countries and entered a new industry with the acquisition of the environmental company ETSA.
Equity Valuation – Grupo Semapa
21
During the 2nd trimester of the current year of 2012 Semapa continued its internationalization process through the acquisition of 50% of the Brasilian “Supremo Cimentos S.A.”, which is a cement company undergoing an expansion plan that will increase its production capacity to 1.700 million tons. Also, Semapa further strengthened its presence in the cement industry by acquiring the remaining 49% of Secil.
As of the end of 2011, when the last year-end Semapa report was published, Portucel had a 83,6% weight on the total sales of the group. If we exclude the other Holdings and consider only Portucel, Secil and ETSA, Portucel’s weight on Semapa’s total Net Income for 2011 is nearly 90%.
Even if we consider the sales for 100% of Secil (instead of the 51% owned by Semapa then) and 50% of Supremo (that was acquired this year), Portucel still represents over 73% of the group’s total sales. This goes to show that the Pulp & Paper segment is by far the core value driver for Semapa.
6.1. Portucel Soporcel Group
Portucel Soporcel Group is the core business of Semapa. It operates in the pulp & paper industry and is currently the European market leader in the market for premium office paper with the brand Navigator. 95% of Portucel’s sales are exportations. It sells pulp and paper to 115 countries all around the world and its exportations represent 3% of Portugal’s total exportations.
The company results from three different Portuguese companies: Portucel, Soporcel and Papéis Inapa.
Portucel was founded in 1953 producing raw pine pulp in a single plant in Cacía, Aveiro. In 1957 it introduced the production of sulphate bleached eucalyptus pulp, which was a worldwide innovation.
In 1964 Papéis Inapa opened its operations. It used the pulp produced by Portucel to produce paper that was sold throughout Europe. Inapa used three paper mills in Setúbal, integrated with Portucel’s eucalyptus pulp mill.
Soporcel started producing in 1984, after being created in 1979. Its operations are based on the production and sale of uncoated wood-free paper (UWF). It currently has two industrial units at Figueira da Foz (founded in 1991 and 2000), which are some of the most technologically advanced factories in the industry.
Figure 2: 2011 Semapa Group Turnover (Source: Semapa Annual Report 2011)
Equity Valuation – Grupo Semapa
22
The Portucel Soporcel Group resulted from the combination of these three companies, increasing the efficiency levels due to vertical integration processes. Since the acquisition of Papéis Inapa in 2000 and Soporcel in 2001, the company became the number one producer of bleached eucalyptus kraft pulp (BEKP) in Europe and one of the leading producers of UWF paper. This market leadership was consolidated in 2009 with the inauguration of the new Setúbal paper mill, which has proven to be one of the most efficient paper mills worldwide. These high levels of efficiency are one of the group’s trademarks and a key source of stability. The company also has its own forest and energy generation departments.
The forest segment is responsible for managing all the company’s woodland assets, which are over 120 thousand hectares, 74% of which are eucalyptus. Although it represents only 0,2% of the company’s external revenues, this division’s intersegment sales and services are 13% of the total revenues. This shows the importance of this segment, which has the role to produce the raw materials for pulp production.
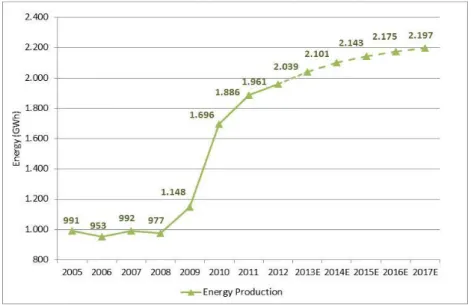
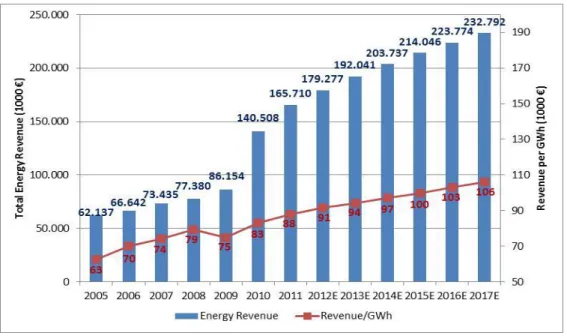
The energy segment represents 12,1% of the group’s total revenues and 3% of Portugal’s total energy generation. This
is very notable since it is not the company’s core business. The division is able to feed the energy required for all the company’s operations and still export significant amounts of energy.
These two segments can be viewed as support segments for the company’s core business of pulp and paper production, representing 87,7% of the company’s total revenues (79,9% paper and 7,8% pulp).
The existence of these two segments is very important when explaining the company’s stability:
Being a commodity company, Portucel is subject to a significant volatility associated with economic cycles. However, since it produces its own raw materials and energy, it is less subject to market volatilities and cycles regarding raw material and energy prices. This, in turn, minimizes the impact of the pulp and paper sales price volatility, which can be affected by economic cycles.
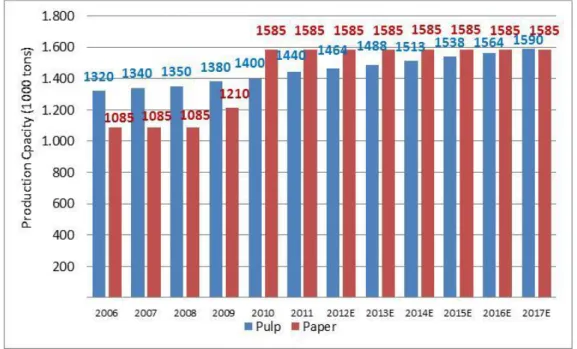
Currently, the Portucel Soporcel Group has an installed capacity for 1,6 million tons/year of paper, 1,4 million tons/year of pulp and 2,5 TWh/year of electric energy.
Figure 3: 2012 Portucel Revenues by Segment (Source: Semapa Interim Report 2012 & own calculations)
Equity Valuation – Grupo Semapa
23
6.2. Secil Group
The second largest company in the Semapa group, which was fully acquired by Semapa during the year of 2012, was founded in 1925.
Its operations started with the Outão cement plant in Setúbal, which was created by Companhia de Cimentos de Portugal in 1906. This factory was later sold to Companhia Geral de Cal e Cimento, who in turn rented it to Secil
(the name stands for Sociedade de Empreendimentos Comerciais e Industriais, Lda.). In 1930 Secil and Companhia Geral de Cal e Cimento merged with a group of Danish companies.
The capacity of the plant gradually increased from 10.000 tons/year in 1906, to 1 million tons/year in 1972. At this time Secil was the largest cement manufacturer in Portugal. After the revolution in Portugal in 1974, the whole cement industry was nationalized in 1975. During this period the old plant is shut
down and a new one is opens using dry process kiln, instead of the old wet process. This plant had centralized and computerized controls and reduced production costs.
In 1994 the State sells off its holdings in the Cement industry to Semapa and later that year Secil acquires CMP, a cement company that owned two cement plants in Portugal.
In the year 2000 Secil started its international expansion with the acquisition of Société des Ciments de Gabès, a Tunisian cement company with a plant with capacity for 1,1 million ton/year. Until 2004 Secil expanded into Lebanon and Angola.
Currently Secil has a total capacity of 6,85 million tons/year. Portugal still dominates its operations with 55% of the production capacity. However, Tunisia (20%) and Lebanon (18%) still have a very significant weight on the company’s productions.
6.3. Supremo Cimentos, S.A.
Supremo Cimentos, S.A. is the most recent acquisition of Semapa, who purchased 50% of the company during the first trimester of 2012.
Figure 5: 2012 Secil Revenues by Geography (Source: Semapa Interim Report 2012 & own calculations)
Figure 4: 2012 Secil Revenues by Segment (Source: Semapa Interim Report 2012 & own calculations
Equity Valuation – Grupo Semapa
24
Supremo Cimentos, S.A. is a Brasillian cement company with a 350 thousand ton/year capacity plant in Santa Catarina. It also produces concrete and aggregates, similarly to Secil. Supremo is undergoing a capacity expansion plant with the construction of a new plant in Adrianópolis, Paraná. The new plant is expected to have nearly 1,5 million tons/year capacity and should start operating in 2014.
During the first trimester of 2012 the company reported nearly 10 million € in sales with a 0,5 million € EBITDA. This would represent yearly revenues below 2% of Semapa’s total group revenues. However, the company’s high growth potential and predicted capacity expansion should be taken into account when valuing Semapa.
6.4. ETSA Group
ETSA is an environmental company that resulted from the merger of SEBOL and ITS, two market leaders in the market of collection and processing of animal waste, in 1997. Since then, ETSA has focused on the recovery, storage, transportation, disposal and revaluation of animal by-products and other food by-products.
The ETSA group was incorporated in Semapa by the end of 2008 and is 96% owned by that holding. It reported 33 million € in revenues in 2011, representing roughly 1,6% of Semapa’s total. Taking into account the company’s level of impact in the group’s total value, its historic cash flows, its growth perspectives and plans and its considerable, but fairly stable, growth rates, the ETSA group will be valued only with a multiples approach.
7. Macroeconomic scenario
Since the outburst of the subprime crisis in the USA at the end of 2007, the worldwide growth has been erratic. Data from The Economist (see Figure 6) reveals that the worldwide real GDP growth started plumitting in 2007, reaching negative values in 2009.
Equity Valuation – Grupo Semapa
25
Since 2009 there was a fast comeback until 2011. However, after that year a second crisis seemed to affect Europe, reaching negative values again in 2012. This European crisis was most notable in the EU15, compared to the new members (see Appendix 2 & Appendix 3). The southern European countries were particulary affected by this crisis, namely Portugal.
At this date, prospects for the coming years are positive. The same source forecasts world GDP growth averages at market exchange rates of 2,5% in 2013 and 2,9% in 2014, as opposed to the 2,2% witnessed in 2012 (see Appendix 4).
Europe’s forecasts are also positive when compared to the -0,1% GDP decline in 2012. The Economist forecasts a modest 0,5% growth in 2013, 1,3% in 2014 and then a stable 1,4% for the following three years, 2015-2017 (see Appendix 4).
In the Portuguese case, the expected average real GDP growth rate is 0,5% until 2020 and 2,1% from there on after until 2030. Portugal’s recent lack of labour productivity and external competitiveness in traditional export sectors has lead to a small growth potential. In the long run, Portugal should regain some competitiveness thanks to the current process of internal devaluation. In any case, the forecasted long run GDP growth rate of 2,1% reflects that Portugal will still have to face many competitors for foreign direct investment.
Figure 8: Western Europe growth and inflation forecast 2008-2017 (Source: The Economist Intelligence Unit [October 17th 2012])
Inflation in Europe is expected to continue falling in 2013 and then return to the 2% level in 2014 and remain fairly stable until 2017. In the same way, the worlwide inflation of 3,4% in 2012 is expected to remain fairly stable until 2017, with the OECD countries registering a stable inflation rate of 2,2% (see Appendix 4).
Figure 7: Portugal growth and productivity forecast 2012-2030 (Source: The Economist Intelligence Unit [August 4th 2012])
Equity Valuation – Grupo Semapa
26
After recovering in 2010 from an historical decline of 11,7% in 2009, world trade growth has been falling until 2012. However, expectations are that in 2013 it will pick up the pace and grow 4,5%, stabilizing in 2015 at around 5,6% growth per year.
The financial crisis also made an impact on the economy through the access to external debt. Short-term interest rates plunged in 2007 from values around 4% to under 1% in 2009. The measure was intended to encourage consumption and investment, in order to stimulate the slow economy. However, the increased risk defaults and unstable economic situation lead to an increase of bank spreads that offset the previous interest rate declines.
This outcome is visible for both the European Central Bank and the Federal Reserve – in this case reaching 0,1%. The effect was global, with the Bank of England and the Bank of Japan both reaching values below 0,5% (seeAppendix 5 & Appendix 6)
This effect has remained from 2009 to 2012, even decreasing further in Europe, but the expectation is that it will reverse after 2013, growing steadily until 2017 all around the world.
8. Valuation of Semapa
Semapa will be valued using the sum of the parts method. This means that each of the companies in the holding will be valued separately.
For Portucel and Secil, because they represent over
Figure 9: World Trade growth forecast 2008-2017 (Source: The Economist Intelligence Unit [October 17th 2012])
Figure 10: Main Policy Interest Rates 1997-2017 (Source: The Economist Intelligence Unit [October 17th 2012])
Figure 11: Semapa Revenues by Company 2012 (Source: Semapa Interim Report 2012 & own calculations)
Equity Valuation – Grupo Semapa
27
97,5% of the total revenues, the valuation will be more thorough. An industry overview will be conducted for both companies, followed by a multiple based valuation and a discounted cash flow valuation, using the WACC method.
For ETSA and Supremo, which together represent only 2,5% of the total revenues, the valuation will be based on market values, adjusted by simple assumptions if appropriate. The significant changes that happened in the company during the year of 2012 will have a relevant impact on its future and therefore on the present valuation. However, the effect of these changes was only incorporated in the half-year report of 2012, and only affecting the 2nd trimester (51% of Secil in the 1st trimester and 100% of Secil in the 2nd trimester in 2012 vs 51% of Secil in 2011).
This means that there is no full-year, or even half-year, information of the companies’ accounts considering the presence of Supremo and 100% of Secil on the consolidated report. Considering that the valuation will be based on a sum of the parts approach, any impact of the acquisitions of Supremo and Secil will be accounted for in their own valuation.
For these reasons, the earnings forecasts will be based on information from previous full-year reports. Nevertheless, all new information obtained after the 2011 annual report until this date (including the 2012 half-year reports) will be considered and the valuations will be adjusted accordingly.
8.1. Portucel Soporcel Group
This company represents 73% of the total Semapa group revenues and for this reason it is the main driver of the company’s value. Comparable historical data from the company’s annual reports date back to 2004, when a transition from the Portuguese accounting rules to the IFRS took place. A key to estimating Portucel’s value correctly is the analysis of the pulp & paper industry and consequent growth forecasts.
8.1.1. Industry Overview
Paper is the final output of Portucel’s mills. Until the final uncoated wood free (UWF) paper is produced, wood is consumed, along with fuel and electricity, to produce pulp, which in turn is consumed, along with more fuel and electricity, to produce the UWF paper.
Thus, the main profitability drivers in the pulp & paper industry are energy costs (electricity and fuel), wood price, pulp demand/price and paper demand/price.
8.1.1.1. Energy
Portucel produces more electricity than it consumes and, as such, still manages to make some money from it. Yet, the price at which it sells electricity is fixed but the price at which it buys can change. For this reason electricity price fluctuations affect Portucel’s profitability in the
Equity Valuation – Grupo Semapa
28
energy segment, however, this impact is very slight because it represents only a variation on a small margin on the electricity segment.
Fuel costs, however, impact Portucel’s margins directly. Fuel prices in Portugal have been raising very quickly (140% increase from 2000 to 2011) despite the crisis scenario. We can see that the growth slowed down when the crisis hit in 2007, but it skyrocketed again in 2011 when the economy recovered some. Portugal, despite having a low GDP per capita compared to the European average, has very high gasoline prices compared to its European peers (see Appendix 7).
Figure 12: Fuel Prices in Portugal 1991-2010 in € (Source: GIZ - German Federal Ministry for Economic Cooperation and Development)
The tendency for the crude oil on the world market (red benchmark line), was very similar to Portugal’s. It grew steadily from 2002 to 2006, dropping with the crisis in 2007 and recovering quickly in recent years. For the short-term, expectations for fuel prices are that they will keep the upward trend. However, the growth rates verified in the last decade and especially in the last 2-3 years aren’t sustainable.
8.1.1.2. Wood
Regarding wood, Portucel has a similar risk protection as it does for electricity. Portucel has its own forest division, which produces wood internally and uses it mostly for its own activities. In this case, however, Portucel’s wood production isn’t enough to fully finance its pulp & paper activities. Therefore it must acquire some wood externally.
So, if the demand for wood increases for reasons other than increased demand for UWF paper, this could lead to wood costs increasing without a corresponding increase in paper costs. This could, thus reduce paper margins and decrease free cash flow estimates.
![Figure 14: BHKP Pulp Prices 2007-2012 in €/ton (Source: FOEX [23rd October 2012])](https://thumb-eu.123doks.com/thumbv2/123dok_br/15218616.1020181/30.892.236.687.783.1017/figure-bhkp-pulp-prices-ton-source-foex-october.webp)
![Figure 17: A4 B-copy Paper Prices 2007-2012 in €/ton (Source: FOEX [23rd October 2012])](https://thumb-eu.123doks.com/thumbv2/123dok_br/15218616.1020181/32.892.210.676.552.800/figure-copy-paper-prices-ton-source-foex-october.webp)