i CONTENTS List of Figures………...III List of Tables...IV List of Abbreviations...V 1 Introduction ... 1 1.1 Framework ... 1 1.2 Objective ... 3 1.3 Methodology ... 3 1.4 Organization of Thesis ... 4
2 Framework of the problem ... 5
2.1 Aspects of climate change ... 5
2.2 Intergovernmental Panel for Climate Changes (IPCC) ... 7
2.2.1 “Climate Change 2007: The Physical Science Basis” ... 8
2.2.2 “Climate Change 2007: Impacts, Adaptation and Vulnerability” ... 14
2.3 European Environment Agency (EEA) ... 20
3 Management of coastal zones ... 23
3.1 Integrated Coastal Zone Management in European Union ... 23
3.2 Wales ... 25
3.2.1 ICZM strategy ... 27
3.2.2 Planning Policy Wales (PPW) ... 28
3.3 Portugal ... 30
3.3.1 National Strategy for ICZM (NSICZM) ... 30
3.3.2 National Spatial Planning Policy Programme (NSPPP) ... 34
3.3.3 National Strategy for Sustainable Development (NSSD) ... 38
3.3.4 National Program on Climate Change (NPCC) ... 42
4 Comparative study (between south Wales and centre Portugal) ... 44
4.1 Characterization of Wales ... 44
4.1.1 Biophysical ... 44
4.2.2 Social economic ... 56
4.2.3 Management tools ... 56
4.3 Characterization of centre Portugal ... 59
4.3.1 Biophysical ... 59
4.3.2 Erosion/ Management ... 68
4.3.3 Social economic ... 71
4.3.4 Management tools ... 72
4.4 Comparison of South of Wales and Centre of Portugal ... 75
5 Discussion and conclusions ... 78
iii
List of Figures
Figure 1 – Earth‟s energy balance.
Figure 2- Observed changes in (a) global average surface temperature; (b) global average sea level from tide gauge (blue) and satellite (red) data; and (c) Northern Hemisphere snow cover.
Figure 3 – Evolution of global sea level. Figure 4 – Fluctuations of SLR.
Figure 5 - Climate change and the coastal system showing the major climate change factors, including external marine and terrestrial influence.
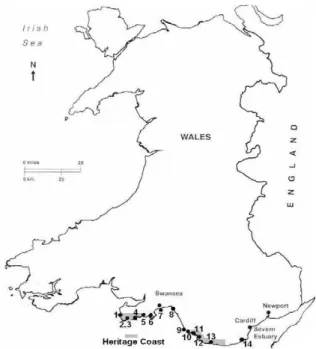
Figure 6 - Location of beaches: 1 Rhossili, 2 Port Eynon, 3 Horton, 4 Oxwich, 5 Caswell, 6 Langland, 7 Swansea Bay, 8 Aberafan, 9 Rest Bay, 10 Coney Beach, 11 Ogmore-by-Sea, 12 Southerndown, 13 Llantwit Major, 14 Barry Island.
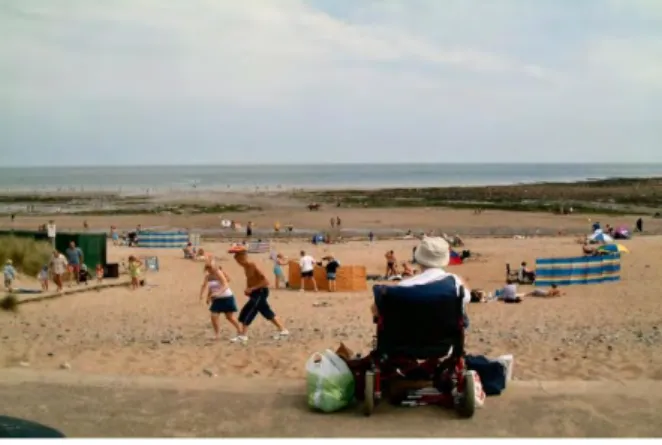
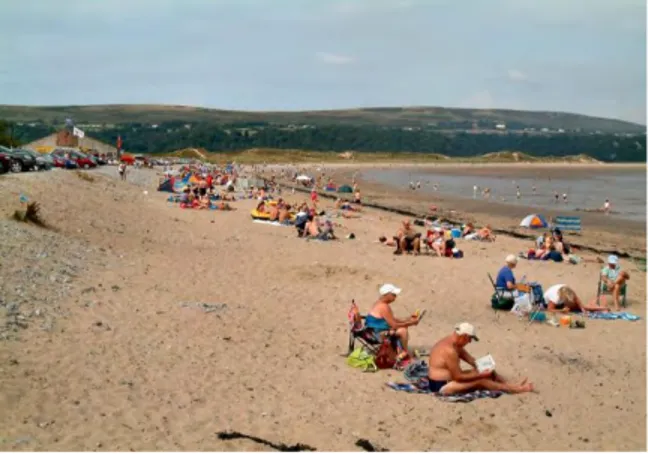
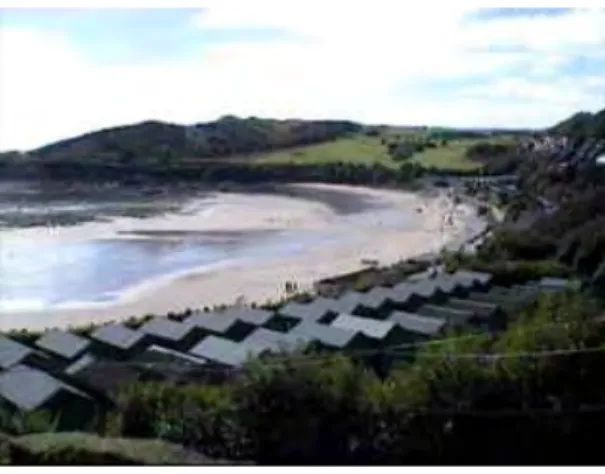
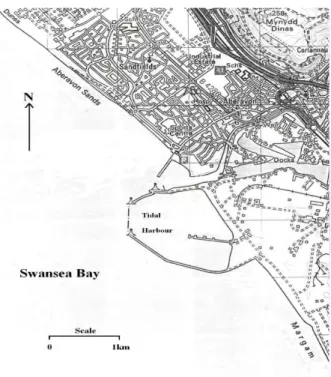
Figure 7 – Rhossili beach. Figure 8 - Port Eynon beach. Figure 9 – Horton beach. Figure 10 – Oxwich beach. Figure 11 – Caswell. Figure 12 – Langland beach. Figure 13 – Swansea beach. Figure 14 – Averavon beach. Figure 15 - Aberavon Beach. Figure 16 - Tidal Harbour.
Figure 17- Sand redistribution on foreshore. Figure 18- Bitumen revertment.
Figure 19 - Merthyr Mawr beach. Figure 20 - Southerndown. Figure 21 – Nash Point.
Figure 22 - Storm damage to Life Saver Club Figure.
Figure 23 - Reconstructed Life Saver Club fronted by new revetment. Figure 24 - Barry Island.
Figure 26 - Esmoriz and Cortegaça urban waterfronts - high risk of erosion. Figure 27 - Furadouro.
Figure 28 - Torreira. Figure 29 – S. Jacinto. Figure 31 – Vagueira
Figure 30- Aveiro harbour breakwaters. Figure 32 - Vagueira.
Figure 33 - Between Vagueira and Mira. Figure 34 – Figueira fa Foz.
Figure 35 - Pedrogão. Figure 36 – Vieira Beach. Figure 37 - São Pedro de Moel.
Figure 38 – Sea defence in Furadouro waterfront.
Figure 39 – Effectiveness of sea defence in Furadouro waterfront urban. Figure 40 - distribution of population in the major economic activities. Figure 41 – CZMP of Ovar- Marinha Grande stretch.
Index of tables
Table 1 - Estimates of the various contributions to the budget of global mean sea level change for 1961 to 2003 and 1993 to 2003.
Table 2 – Climate Drivers.
Table 3 – Principal agencies and their main responsibilities. Table 4 – Lenghts of shoreline with respective CPU.
v
List of abbreviations AONB – Area of Outstanding Natural Beauty
CC – Climate Change
CPA – Coastal Protection Authority CPU – Coastal process Units
CZMP – Coastal Zone Management Plan
DEFRA – Department of Environment, Food and Rural Affairs EEA – European Environmental Agency
EEZ – Exclusive Economic Zones EU – European Union
GHC – Glamorgan Heritage Coast GHG – Greenhouse Gases
GIA – Glacial Isostatic adjustment
ICZM – Integrated Coastal zone Management IPCC – Intergovernmental Panel on Climate Change LNRs – Local nature Reserves
LEAPs – Local Environmental Action Plans MOC – Meridional Overturning Circulation NIS – National Institute of Statistic
NNRs – National Nature Reserves
NPCC – National Programme on Climate Change
NSICZM – National Strategy for Integrated Coastal Zone Management NSPPP – National Spatial Planning Policy Programme
NSSD – National Strategy for Sustainable Development
PINSSD – Plan of Implementation of National Strategy of Sustainable Development PPW – Planning Policy Wales
RNLI – Royal National Lifeboat Institute SAC – Special Area of Conservation SLR – Sea Level Rise
SMP – Shoreline Management Plan
SRES – Special Report on Emission Scenarios SSSI - Special Scientific Interest
SST – Sea Surface Temperature TAR - Third Assessment Report
TEETS – Trade European Emissions Trading Scheme UKCIP – UK Climate Change Impact Programme UNEP – United Nations Environment Programme UDP – Unitary Development Plan
1
1 Introduction 1.1 Framework
The world's coastal zones experience climate change (CC) in several ways. The most evident impact on the coastal zone is Sea-Level Rise (SLR) which is an important indicator of CC in Europe with greater emphasis for loss of flat coastal regions, the flooding and coastal erosion. The increase in sea level enlarge the storm surges, flooding, enforce landward intrusion of salt water in estuaries and aquifers and put in danger coastal ecosystems and wetlands. The coastal zones in Europe often provide important natural ecosystems, provide habitats for many species, play a key role in nutrient uptake, serves as the basis for many communities economic livelihoods, provide recreational opportunities, protect local areas from flooding and contain major urban centres.
A higher risk of flooding increases the threat of loss of property and coastal habitats, and potential loss of life, as well as damage to coastal protection works and other infrastructure, and may cause the loss of tourism, recreation and transportation. Low-lying coastlines with high density of population and small tidal ranges will be the most vulnerable to SLR.
According to Leatherman (2001), changing in sea level has been the driver of shorelines over geologic time and is one of the principal determinants of shoreline position. This has a relationship with other factors such as sea level, sediment supply, wave energy and shoreline position. For develop management strategies for mitigating and protecting people it is important to assess sea level trends.
According by Povh (2000), three quarters of the world‟s population will be living within 60 km of the shoreline by 2020, there will be an increase in demand for coastal leisure and tourism. Whilst coastlines are often viewed as stable permanent assets, in reality they tend to be dynamic, responding to natural processes and human activities (Phillips and Jones, 2006). Ketchum (1972) identified six most important spheres of human activity in the coastal zone: residency and recreation; industrial and commercial; agricultural, aquaculture and fishing; waste disposal; conservation; military and strategic.
One of the major physical impacts of SLR is erosion of beaches, particularly along the open coast and this would leave coastal infrastructure more vulnerable to storm waves (Titus et al., 1985). Which this will have consequences for tourism. This relationship of SLR to erosion has become known as the Bruun Rule (Leatherman, 2001). Which Bruun (1962) proposed long ago that SLR cause long-termed erosion of sandy beaches. According to Douglas (2001) says that his model predicts that the beaches will erode 50 to 200 times the rate of increase of sea-level. It does not suggest that SLR actually causes erosion; rather, increased sea level enables high-energy, short-period storm waves to attack further up the beach and transport sand offshore (Phillips and Jones, 2006).
About the management in coastal zone have several problems for beach managers, coastal engineers and tourism business, due the uncertainty of SLR, storm surges, erosion. For example erosion, have many other factors contribute to erosion not just sea-level, which complicate the development of appropriate management strategies. Also when coastal managers decide the best defence structures to response to erosion, some methods they use cause erosion. Obviously, policy and implementation will be influenced by the available techniques for defending the coastline with due consideration being given to their cost and sustainability (Phillips and Jones, 2006).
Some of the hard engineering structures used for manage storms and tides for the protection of developments within the coastal zone are the seawalls, groynes, piers, etc.. These structures they have a tendency to promote erosion and they are expensive.
According to Phillips and Jones (2006) the hard engineering it can be argued on socio-economic grounds but this structures they still be necessary because if human activity and global change mean losses in the coastal zone, then risk assessments will have to be undertaken to consider overall consequences.
However as the hard engineer cause problems, in present-day alternative soft engineering techniques that work together with natural coastal processes are increasingly used. As soft engineering we have:
3 - Submerged breakwaters – reduce effective depth offshore and consequently reduce
wave power and erosion of the beach (Aminti et al., 2002)
- Beach nourishment – aim protect the shoreline and benefit the tourism industry.
1.2 Objective
The present dissertation has as main objective to make a comparison between the south of Wales and central region of Portugal in relation to CC.
However other specifics objectives can be identifies as:
Identify the aspects of CC;
Research in the main reports about CC;
Identify what the consequences of CC on coastal zones of Wales and the Central region of Portugal using various scientific studies developed;
Identify what steps strategic for both countries which should take to adapt to CC in coastal zones;
To evaluate the viability of measures to adapt the strategies in the respective countries;
Observe what the differences between the countries under study are;
Present contributions to the effectiveness of national planning and coastal zone management.
1.3 Methodology
The methodology of drafting this work involved: Research and literature review about CC;
Analysis of European and international policies and strategies of other relevant countries, in terms of adjustments to CC in coastal zones: identification of measures, goals and targets;
Analysis of studies to identify the impacts of CC on coastal zones, particularly in Portugal and Wales;
Preparation of guidelines for coastal zone adaptation to CC might be included in national strategies looking ahead a sustainable future of these areas;
1.4 Organization of Thesis
The dissertation is organized in five chapters.
The present chapter is the introduction where the thesis theme is general presented. Are presented also the objectives and the methodology used in the research work.
Chapter two is the framework of the problems in coastal zones due to CC and refers to the biggest agencies for the climate change in the international and European context.
Chapter three refers to the management of coastal zones in different countries with the most significant policies and tools which each country uses, to deal with this particular problem in CC aspects.
Chapter four is the comparative study between the two countries - south of Wales and central region of Portugal. With particular emphasis to the followed aspects: biophysical, erosion, socio economic and management tools.
Finally, chapter five present the main discussion of the research and conclusions. Some recommendations and developments which can be done in the future are also suggested.
5
2 Framework of the problem 2.1 Aspects of climate change
According to Intergovernmental Panel on Climate Change (IPCC) the CC refers to any change in climate over time, whether due to natural variability or as a result of human activity (IPCC, 2007a).
The reason the Earth‟s surface is this warm is the presence of greenhouse blanket for the long wave radiation coming from the surface. These blanketing gases, which act as a partial, are known as the natural greenhouse effect. Without the greenhouse effect life on this planet would probably not exist as the average temperature of the Earth would be a chilly -18° Celsius, rather than the present 15° Celsius.
The two most abundant gases in the atmosphere are the nitrogen comprising 78% of the dry atmosphere and oxygen comprising 21%; they don‟t affect almost greenhouse effect. Instead, the greenhouse effect comes from molecules that are more complex and much less common. Water vapour is the most important greenhouse gas, and carbon dioxide (CO2) is the second most important. Methane, nitrous oxide, ozone and several other gases present in the atmosphere in small amounts also contribute to the greenhouse effect (IPCC, 2007).
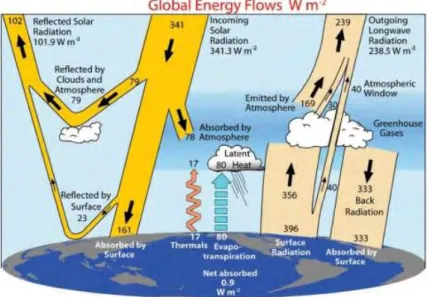
As energy from the Sun passes through the atmosphere a number of things take place (Figure 1). A portion of the energy (30% globally) is reflected or scattered back to space by clouds and other atmospheric particles. About 19% of the energy available is absorbed by clouds, gases (like ozone), and particles in the atmosphere. Of the remaining 55% of the solar energy passing through the Earth's atmosphere, 4% is reflected from the surface back to space. On average, about 51% of the Sun's radiation reaches the surface.
Human activities result in emissions of four long-lived GHGs: CO2, methane (CH4), nitrous oxide (N2O) and halocarbons (a group of gases containing fluorine, chlorine or bromine) which intensify the blanketing effect through the release of greenhouse gases. For instance, the amount of carbon dioxide in the atmosphere has increased by about 35% in the industrial era, and this increase is known to be due to human activities, primarily the combustion of fossil fuels and removal of forests. Thus, humankind has dramatically altered the chemical composition of the global atmosphere with substantial implications for climate. Changes in various aspects of the climate system, such as the size of ice sheets, the type and distribution of vegetation or the temperature of the atmosphere or ocean will influence the large-scale circulation features of the atmosphere and oceans (IPCC, 2007).
There are many feedback mechanisms in the climate system that can either amplify („positive feedback‟) or diminish („negative feedback‟) the effects of a change in climate forcing. For example, as rising concentrations of greenhouse gases warm Earth‟s climate, snow and ice begin to melt. This melting reveals darker land and water surfaces that were beneath the snow and ice, and these darker surfaces absorb more of the Sun‟s heat, causing more warming, which causes more melting, and so on, in a selfreinforcing cycle. This feedback loop, known as the „ice-albedo feedback‟, amplifies the initial warming caused by rising levels of greenhouse gases (GHG). Detecting, understanding and accurately quantifying climate feedbacks have been the focus of a great deal of research by scientists unravelling the complexities of Earth‟s (IPCC, 2007).
7 Coasts are dynamic systems, undergoing adjustments of form and process (termed morphodynamics) at different time and space scales in response to geomorphological and oceanographical factors (Cowell et al., 2003a, b).
Climate change interacts with the coastal zone in several ways including inundation, erosion and salt water intrusion into the water table. Over the next century and beyond inundation and intrusion will clearly be affected by the relatively slow increases in mean sea level. For an assessment of the effects of CC on erosion there is insufficient information on changes in waves or near-coastal currents. The risk of extreme sea levels in many locations is poorly defined under current climate conditions because of sparse tide gauge networks and relatively short temporal records. This gives a poor baseline for assessing future changes and detecting changes in observed records. Using results from 141 sites worldwide for the last four decades, Woodworth and Blackman (2004) find that at some locations extreme sea levels have increased and that the relative contribution from changes in mean sea level and atmospheric storminess depends on location (IPCC,2007).
Coastal erosion results in three different types of impacts (or risks): Loss of land with economical, societal or ecological value;
Destruction of natural sea defences (usually a dune system) as a result of a single storm event, which in turn results in flooding of the hinterland;
Undermining of artificial sea defences, potentially also leading to flood risk.
2.2 Intergovernmental Panel for Climate Changes (IPCC)
The IPCC is the principal agency for the assessment of CC to offer the world a clear scientific about the current state of CC and its potential environmental and socio-economic consequences. It was established by the United Nations Environmental Programme (UNEP) and the World Meteorological Organization (WMO) back in 1989.
The IPCC is organized into three working groups: Working Group I deals with "The Physical Science Basis of Climate Change", Working Group II with "Climate Change Impacts, Adaptation and Vulnerability" and Working Group III with "Mitigation of Climate Change".
They are assisted by a Technical Support Unit, which is hosted and financially supported by the government of the country who offered to do so and also a Task Force on National Greenhouse Gas Inventories which develop and refine a methodology for the calculation and reporting of national GHG emissions and removals.
Below discusses the framework of the problem, the aspects, consequences and management in the coastal zone, , according to the IPCC : “The Physical Science Basis of Climate Change”, “Climate Change Impacts, Adaptation and Vulnerability”, “Mitigation of Climate Change” of 2007 .
2.2.1 “Climate Change 2007: The Physical Science Basis”
Chapter 5 “Observations: Oceanic Climate Change and Sea Level”, explores the importance of the ocean in climate variability and sea level from the report of “climate change 2007:The Physical Science Basis”.
The ocean‟s heat capacity is about 1,000 times larger than that of the atmosphere, and the oceans net heat uptake since 1960 is around 20 times greater than that of the atmosphere (Levitus et al., 2005a). This heat capacity which is been mostly stored in the upper layers of the ocean plays a critical role in CC, in particular variations on seasonal to decadal time scales. The transport of heat and freshwater by ocean currents can have an important effect on regional climates, and the large-scale Meridional Overturning Circulation (MOC; also referred to as thermohaline circulation) influences the climate on a global scale (e.g., Vellinga and Wood, 2002). The ocean circulation influences also the changes in sea level.
IPCC refers that present-day the change of sea level is one of the main interests because of its potential impact on human populations living in coastal regions and islands. On decadal and longer time scales, global mean sea level change, principally related to recent CC results from two major processes that alters the volume of water in the global ocean (Figure 2):
- Thermal expansion of the oceans, that due to the rising ocean water temperature the volume increase;
- Exchange of water between oceans and other reservoirs (glaciers and ice caps, ice sheets, other land water reservoirs - including through anthropogenic change in land hydrology and the atmosphere), or other words, melting of ice sheets, glaciers and ice caps.
9 Figure 2- Observed changes in (a) global average surface temperature; (b) global average sea level from tide
gauge (blue) and satellite (red) data; and (c) Northern Hemisphere snow cover (Source:IPCC, 2007).
“All these processes cause geographically no uniform sea level change as well as changes in the global mean, some oceanographic factors (e.g., changes in ocean circulation or atmospheric pressure) also affect sea level at the regional scale, while contributing negligibly to changes in the global mean. Vertical land movements such as resulting from Glacial isostatic adjustment (GIA), tectonics, subsidence and sedimentation influence local sea level measurements but do not alter ocean water volume; nonetheless, they affect global mean sea level through their alteration of the shape and hence the volume of the ocean basins containing the water.” (IPCC, 2007).
In this report IPCC highlights for measure the sea level change two different techniques: tide gauges and satellite. The definition of IPCC of these two techniques is the “Tide gauges provide sea level variations with respect to the land on which they lie. To extract the signal of sea level change due to ocean water volume and other oceanographic change, land motions need to be removed from the tide gauge measurement. Land motions related to GIA can be simulated in global geodynamic models. The estimation of other land motions is not generally
possible unless there are adequate nearby geodetic or geological data, which is usually not the case.
However, careful selections of tide gauge sites such that records reflecting major tectonic activity are rejected and averaging over all selected gauges, results in a small uncertainty for global sea level estimates. Sea level change based on satellite altimetry is measured with respect to the Earth‟s centre of mass, and thus is not distorted by land motions, except for a small component due to large-scale deformation of ocean basins from GIA.”
IPCC says that the global sea level during the several millennia that followed the end of the last ice age (approximately 21,000 years ago) rose by about 120 m, and stabilised between 3,000 and 2,000 years ago. The indicators of sea level suggest that global sea level did not change considerably from then until the late 19th century. Estimates for the 20th century show that global average sea level rose at a rate of about 1.7 mm yr–1. As well the climate models, hydrographic observations and satellite data demonstrate that sea level is not rising equally around the world. In some regions, rates are up to several times the global mean rise, while in other regions sea level is declining.
Relative at 21st century global sea level is projected to rise at a superior rate than during 1961 to 2003. Under the IPCC Special Report on Emissions Scenarios(SRES) A1B scenario by the mid- 2090s, global sea level will reach 0.22 to 0.44 m above 1990 levels, and is rising at about 4 mm yr–1. As in the past, sea level change in the future will not be geographically uniform, with regional sea level change varying within about ±0.15 m of the mean in a typical model projection (IPCC, 2007).
Figure 3 shows the evolution of global mean sea level in the past and as projected for the 21st century for the SRES A1B scenario with grey shading shows the uncertainty in the estimated long-term rate of sea level change. The red line is a reconstruction of global mean sea level from tide gauges, and the red shading denotes the range of variations from a smooth curve. The green line shows global mean sea level observed from satellite altimetry. The blue shading represents the range of model projections for the SRES A1B scenario for the 21st century, relative to the 1980 to 1999 mean, and has been calculated independently from the observations. .
11 Figure 3 – Evolution of global sea level (Source: IPCC, 2007).
The same report informs about the uncertainty value for the SLR. The Third Assessment Report (TAR) chapter on sea level change provided estimates of climate and other anthropogenic contributions to 20th-century SLR, based mostly on models (Church et al., 2001). The sum of these contributions ranged from 0.8 to 2.2 mm yr–1, with a mean value of 1.7 mm yr–1, and a large part of this uncertainty was due to the lack of information on anthropogenic land water change (IPCC, 2007). Adopted as a best estimate Church et al. (2001) based on tide gauge records observed for the 20th-century SLR, a value in the range of 1 to 2 mm yr–1, which was more than twice as large as the TAR‟s estimate of climate-related contributions. The IPCC explained that thus appeared that either the processes causing SLR had been underestimated or the rate of SLR observed with tide gauges was inclined towards higher values.
Since the TAR, a number of new results have been published. Since the early 1990s the global coverage of satellite altimetry (Topography Experiment (TOPEX)/Poseidon and Jason) has improved the estimate of global SLR and has revealed the complex geographical patterns of sea level change in open oceans. Near-global ocean temperature data for the last 50 years have been recently made available, allowing the first observationally based estimate of the thermal expansion contribution to SLR in past decades. For recent years, better estimates of the land ice contribution to sea level are available from various observations of glaciers, ice caps and ice sheets (IPCC, 2007).
The global sea level change depends on the three-dimensional distribution of ocean temperature change discussed already above. The average rate of thermosteric SLR caused by heating of the
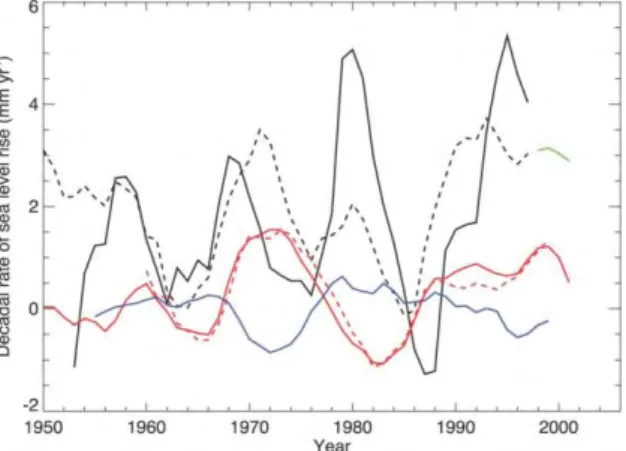
global ocean is estimated to be 0.40 ± 0.09 mm yr–1 over 1955 to 1995 (Antonov et al., 2005), based on five-year mean temperature data down to 3,000 m. For the 0 to 700 m layer and the 1955 to 2003 period, the averaged thermosteric trend, based on annual mean temperature data from Levitus et al. (2005a), is 0.33 ± 0.07 mm yr–1 (Antonov et al., 2005). For the same period and depth range, the mean thermosteric rate based on monthly ocean temperature data from Ishii et al. (2006) is 0.36 ± 0.12 mm yr–1. The rate of thermosteric SLR is clearly not constant in time and shows considerable fluctuations. In the Figure 4 shows the overlapping 10-year rates of global sea level change from tide gauge data sets (Holgate and Woodworth, 2004, in solid black; Church and White, 2006, in dashed black) and satellite altimetry (updated from Cazenave and Nerem, 2004, in green), and contributions to global sea level change from thermal expansion (Ishii et al., 2006, in solid red; Antonov et al., 2005, in dashed red) and climate-driven land water storage (Ngo-Duc et al., 2005, in blue). Each rate is plotted against the middle of its 10-year period
Figure 4 – Fluctuations of SLR (Source: IPCC, 2007).
The IPCC says that glaciers and ice caps during the 20th century have experienced considerable mass losses, with strong retreats in response to global warming after 1970. For 1961 to 2003, their contribution to sea level is assessed as 0.50 ± 0.18 mm yr–1 and for 1993 to 2003 as 0.77 ± 0.22 mm yr–1, the Greenland Ice Sheet has also been losing mass in recent years, contributing 0.05 ± 0.12 mm yr–1 to SLR during 1961 to 2003 and 0.21 ± 0.07 mm yr–1 during 1993 to 2003. Assessments of contributions to SLR from the Antarctic Ice Sheet are less certain, especially before the advent of satellite measurements, and are 0.14 ± 0.41 mm yr–1 for 1961 to 2003 and 0.21 ± 0.35 mm yr–1 for 1993 to 2003 (IPCC, 2007). Geodetic data on Earth rotation and polar wander allow a late 20th century sea level contribution of up to about 1 mm yr–1 from land ice (Mitrovica et al., 2006). However, recent estimates of ice sheet mass change exclude the large
13 contribution inferred for Greenland by Mitrovica et al. (2001) from the geographical pattern of sea level change, confirming the lower rates reported above.
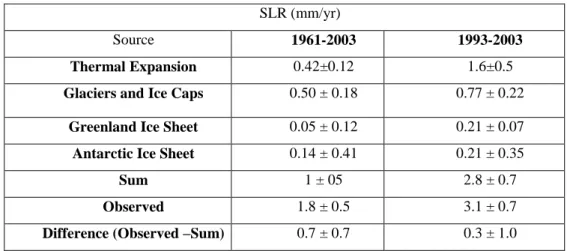
In the point 5.5.6 “Total Budget of the Global Mean Sea Level Change” of IPCC 2007 has the various contributions to the budget of sea level change and they are summarised in Table 1 for 1961 to 2003 and 1993 to 2003. The IPCC omit‟s some terms known to be small, including changes in atmospheric water vapour and climate-driven change in land water storage, permafrost and sedimentation, which very likely total less than 0.2 mm yr–1 and also the poorly known anthropogenic contribution from terrestrial water storage.
Table 1 - Estimates of the various contributions to the budget of global mean sea level change for 1961 to 2003 and 1993 to 2003 (Source: IPCC, 2007).
SLR (mm/yr)
Source 1961-2003 1993-2003
Thermal Expansion 0.42±0.12 1.6±0.5
Glaciers and Ice Caps 0.50 ± 0.18 0.77 ± 0.22 Greenland Ice Sheet 0.05 ± 0.12 0.21 ± 0.07 Antarctic Ice Sheet 0.14 ± 0.41 0.21 ± 0.35
Sum 1 ± 05 2.8 ± 0.7
Observed 1.8 ± 0.5 3.1 ± 0.7
Difference (Observed –Sum) 0.7 ± 0.7 0.3 ± 1.0
The IPCC says that “For 1961 to 2003, thermal expansion accounts for only 23 ± 9% of the observed rate of SLR. Miller and Douglas (2004) reached a similar conclusion by computing steric sea level change over the past 50 years in three oceanic regions (northeast Pacific, northeast Atlantic and western Atlantic); they found it to be too small by about a factor of three to account for the observed SLR based on nine tide gauges in these regions. They concluded that SLR in the second half of the 20th century was mostly due to water mass added to the oceans. However, Table 1 show that the sum of thermal expansion and contributions from land ice is smaller by 0.7 ± 0.7 mm yr–1 than the observed global average SLR. This is likely to be a significant difference. The assessment of Church et al. (2001) could allow this difference to be explained by positive anthropogenic terms (especially groundwater mining) but these are expected to have been outweighed by negative terms (especially impoundment). We conclude that the budget has not yet been closed satisfactorily.
Given the large temporal variability in the rate of SLR evaluated from tide gauges (Figure 4), the budget is rather problematic on decadal time scales. The thermosteric contribution has smaller variability (though still substantial) and there is only moderate temporal correlation between the thermosteric rate and the tide gauge rate. The difference between them has to be explained by ocean mass change. Because the thermosteric and climate-driven land water contributions are negatively correlated, the apparent difference implies contributions during some 10-year periods from land ice, the only remaining term, exceeding 2 mm yr–1 (Figure 4). Since it is unlikely that the land ice contributions of 1993 to 2003 were exceeded in earlier decades, we conclude that the maximum 10-year rates of global SLR are likely overestimated from tide gauges, indicating that the estimated variability is excessive. For 1993 to 2003, thermal expansion is much larger and land ice contributes 1.2 ± 0.4 mm yr–1. These increases may partly reflect decadal variability rather than acceleration. The sum is still less than the observed trend but the discrepancy of 0.3 ± 1.0 mm yr–1 is consistent with zero. It is interesting to note that the difference between the observed total and thermal expansion (assumed to be due to ocean mass change) is about the same in the two periods. The more satisfactory assessment for recent years, during which individual terms are better known and satellite altimetry is available, indicates progress since the TAR.”
2.2.2 “Climate Change 2007: Impacts, Adaptation and Vulnerability”
This report “Climate change 2007: impacts and vulnerability” has the chapter 6 “Coastal systems and low-lying areas” which present a global perspective of CC and SLR on coastal and adjoining low-lying areas, with an importance on post-2000 insights. The coastal systems are considered the interacting with low-lying areas and shallow coastal waters, including their human components. This chapter take in account the strong interactions between the natural and human sub-systems in the coastal system (Figure 5), and also this chapter talks about an integrated perspective of the coastal zone and its management.
15 Figure 5 - Climate change and the coastal system showing the major climate change factors, including
external marine and terrestrial influences (IPCC, 2007).
Adapting to global CC, however, requires insight into processes at decadal to century scales, at which understanding is least developed (de Groot, 1999; Donnelly et al., 2004).
The IPCC explains that the coastal landforms, affected by short-term perturbations such as storms, usually return to their pre-disturbance morphology, implying a simple, morphodynamic equilibrium. Many coasts undergo continual adjustment towards a dynamic equilibrium, often adopting different „states‟ in response to varying wave energy and sediment supply (Woodroffe, 2003). This natural variability of coasts can make it difficult to identify the impacts of CC (IPCC, 2007). For example, most beaches worldwide show evidence of recent erosion but SLR is not necessarily the primary driver. Erosion can result from other factors, such as altered wind patterns (Pirazzoli et al., 2004; Regnauld et al., 2004), offshore bathymetric changes (Cooper and Navas, 2004), or reduced fluvial sediment input (IPCC, 2007).
The direct impacts of human activities on the coastal zone have been more significant over the past century than impacts that can be directly attributed to observe CC (Scavia et al., 2002; Lotze et al., 2006). The main direct impacts of human activities according to IPCC (2007) on the coastal zone include drainage of coastal wetlands, deforestation and reclamation, discharge of sewage, fertilisers and contaminants into coastal waters.
Extractive activities include sand mining and hydrocarbon production, harvests of fisheries and other living resources, introductions of invasive species and construction of seawalls and other structures. Engineering structures, such as damming, channelization and diversions of coastal waterways, harden the coast, change circulation patterns and alter freshwater, sediment and
nutrient delivery, engineering solutions, such as beach nourishment and foredune construction (Nordstrom, 2000; Hamm and Stive, 2002).
Coastal erosion is observed on many shorelines around the world, but it usually remains unclear to what extent these losses are associated with relative SLR due to subsidence, and other human drivers of land loss, and to what extent they result from global warming (Hansom, 2001; Jackson et al., 2002; Burkett et al., 2005; Wolters et al., 2005). Reduced sea-ice cover means a greater potential for wave generation where the coast is exposed (Johannessen et al., 2002; Forbes, 2005; Kont et al., 2007). Moreover, relative SLR on low-relief, easily eroded, shores leads to rapid retreat, accentuated by melting of permafrost that binds coastal sediments, warmer ground temperatures, enhanced thaw, and subsidence associated with the melting of massive ground ice, as recorded at sites in Arctic Canada (Forbes et al., 2004b;Manson et al., 2006), northern USA (Smith, 2002b; Lestak et al., 2004) and northern Russia (Koreysha et al., 2002; Nikiforov et al., 2003; Ogorodov, 2003).
Global warming poses a threat to coral reefs, particularly any increase in sea surface temperature (IPCC, 2007). The synergistic effects of various other pressures, particularly human impacts such as over-fishing, appear to be exacerbating the thermal stresses on reef systems and, at least on a local scale, exceeding the thresholds beyond which coral is replaced by other organisms (Buddemeier et al., 2004).
Table 2 summarises the range of potential drivers of climate change impacts in coastal zones, including the results from Meehl et al. (2007) and Christensen et al. (2007). In most cases there will be significant regional variations in the changes, and any impacts will be the result of the interaction between these climate change drivers and other drivers of change, leading to diverse effects and vulnerabilities (IPCC, 2007).
Table 2 – Climate Drivers (Source: IPCC, 2007)
Climate driver (trend) Main physical and ecosystem effects on coastal systems
CO2 concentration (↑) Increased CO2 fertilisation; decreased seawater pH (or „ocean acidification‟) negatively impacting coral reefs and other pH sensitive organisms.
Sea surface temperature (↑, R)
Increased stratification/changed circulation; reduced incidence of sea ice at higher latitudes; increased coral bleaching and mortality (see Box 6.1); poleward species migration; increased algal blooms
Sea level (↑, R) Inundation, flood and storm damage (see Box 6.2); erosion; saltwater intrusion; rising water tables/impeded drainage; wetland loss (and change). Storm intensity (↑, R) Increased extreme water levels and wave heights; increased episodic erosion,
storm damage, risk of flooding and defence failure (see Box 6.2). Storm frequency (?, R) Altered surges and storm waves and hence risk of storm damage and
17 Storm track (?, R) flooding (see Box 6.2).
Wave climate (?, R) Altered wave conditions, including swell; altered patterns of erosion and accretion; re-orientation of beach plan form.
Run-off (R) Altered flood risk in coastal lowlands; altered water quality/salinity; altered fluvial sediment supply; altered circulation and nutrient supply.
In these report “Beaches, rocky shorelines and cliffed coasts” take an account the problem of erosion.
Most of the world‟s sandy shorelines retreated during the past century (Bird, 1985; NRC, 1990; Leatherman, 2001; Eurosion, 2004) and SLR is one underlying cause. Studies for the IPCC estimate that the annual number of victims of actual coastal erosion or flooding will reach 158,000 in 2020, while half of Europe‟s coastal wetlands are expected to disappear as a result of sea level rise. Coastal squeeze and steepening are also widespread as illustrated along the eastern coast of the United Kingdom where 67% of the coastline experienced a landward retreat of the low-water mark over the past century (Taylor et al., 2004). An acceleration in SLR will widely exacerbate beach erosion around the globe (Brown and McLachlan, 2002), although the local response will depend on the total sediment budget (Stive et al., 2002; Cowell et al., 2003a,b). The widely cited Bruun (1962) model , Komar (1998), Cooper and Pilkey (2004) and Davidson-Arnott (2005) says that the application of the Bruun model remains controversial.
As sea-level rises, estuaries and lagoons attempt to maintain equilibrium by raising their bed elevation in tandem, and hence potentially act as a major sink of sand which is often derived from the open coast (van Goor et al., 2001; van Goor et al., 2003; Stive, 2004). This process can potentially cause erosion an order of magnitude or greater than that predicted by the Bruun model (Woodworth et al., 2004), implying the potential for major coastal instability due to SLR in the vicinity of tidal inlets (IPCC, 2007). Several recent studies indicate that beach protection strategies and changes in the behaviour or frequency of storms can be more important than the projected acceleration of SLR in determining future beach erosion rates (Ahrendt, 2001; Leont‟yev, 2003). Thus there is not a simple relationship between SLR and horizontal movement of the shoreline, and sediment budget approaches are most useful to assess beach response to CC (Cowell et al., 2006).
The IPCC mentions the different sensitivity types of beaches. The impacts of accelerated SLR on gravel beaches have received less attention than sandy beaches. These systems are threatened by SLR (Orford et al., 2001, 2003; Chadwick et al., 2005), even under high
accretion rates (Codignotto et al., 2001). The persistence of gravel and cobbleboulder beaches will also be influenced by storms, tectonic events and other factors that build and reshape these highly dynamic shorelines (Orford et al., 2001).
Since the TAR, monitoring, modelling and process-oriented research have revealed some important differences in cliff vulnerability and the mechanics by which groundwater, wave climate and other climate factors influence cliff erosion patterns and rates (IPCC, 2007). Hard rock cliffs have a relatively high resistance to erosion, while cliffs formed in softer lithologies are likely to retreat more rapidly in the future due to increased toe erosion resulting from SLR (Cooper and Jay, 2002). Cliff failure and retreat may be amplified in many areas by increased precipitation and higher groundwater levels: examples include UK, Argentina and France (Hosking and McInnes, 2002; Codignotto, 2004b; Pierre and Lahousse, 2006).
Hence, four physical features of CC – temperature, precipitation, sea level and wave climate – can affect the stability of soft rock cliffs. Soft rock cliff retreat is usually episodic with many metres of cliff top retreat occurring locally in a single event, followed by relative quiescence for significant periods (Brunsden, 2001; Eurosion, 2004). Considerable progress has been made in the long-term prediction of cliff-top, shore profile and plan-shape evolution of soft rock coastlines by simulating the relevant physical processes and their interactions (Hall et al., 2002; Trenhaile, 2002, 2004).An application of the SCAPE (Soft Cliff and Platform Erosion) model (Dickson et al., 2005;Walkden and Hall, 2005) to part of Norfolk, UK has indicated that rates of cliff retreat are sensitive to SLR, changes in wave conditions and sediment supply via longshore transport. For soft cliff areas with limited beach development, there appears to be a simple relationship between long-term cliff retreat and the rate of SLR (Walkden and Dickson, 2006), allowing useful predictions for planning purposes.
In this report as well takes an account the impacts and consequences of climate change on human society at coasts have emerged, since the TAR and have four significant of these impacts, consequences of climate change which says:
- “First, significant regional differences in climate change and local variability of the coast, including human development patterns, result in variable impacts and adjustments along the coast, with implications for adaptation responses;
19 - Second, human vulnerability to sea-level rise and climate change is strongly influenced
by the characteristics of socio-economic development. There are large differences in coastal impacts when comparing the different SRES worlds which cannot be attributed solely to the magnitude of climate change (Nicholls and Lowe, 2006; Nicholls and Tol, 2006);
- Third, although the future magnitude of sea-level rise will be reduced by mitigation, the long timescales of ocean response mean that it is unclear what coastal impacts are avoided and what impacts are simply delayed by the stabilisation of greenhouse gas concentration in the atmosphere (Nicholls and Lowe, 2006);
- Fourth, vulnerability to the impacts of climate change, including the higher socio-economic burden imposed by present climate-related hazards and disasters, is very likely to be greater on coastal communities of developing countries than in developed countries due to inequalities in adaptive capacity (Defra, 2004).”
About the freshwater resources IPCC says that the direct influences of sea-level on freshwater resources come principally from intrusion into surface waters and coastal aquifers further encroachment of saltwater into estuaries and coastal river systems, more extensive coastal inundation and higher levels of sea flooding, increases in the landward reach of sea waves and storm surges, and new or accelerated coastal erosion (Hay and Mimura, 2005). Identifying future coastal zones with stressed freshwater resources is difficult, particularly where there are strong seasonal demands, poor or no metering, and theft of water (Hall, 2003). Based on the SRES emissions scenarios, it is estimated that the increase in water stress would have a significant impact by the 2050s, when the different SRES population scenarios have a clear effect (Arnell, 2004).
The chapter 6.6 “Adaptation: practices, options and constraints” mentions the problems of interventions of natural and human coastal systems with aim to reduce risks as consequence of CC, describe the tools important to adaptation in coastal zones, options for adaptation of coastal systems, current and planned adaptation initiatives and the links between coastal adaptation and efforts to mitigate climate change are discussed.
IPCC informs about the challenges in adapting to changes in climate and sea level due the recent extreme events. One constraint on successful management of climate-related risks to
coastal systems is the limited ability to characterise in appropriate detail how these systems, and their constituent parts, will respond to climate change drivers and to adaptation initiatives (Finkl, 2002). The question of who pays and who benefits from adaptation is another issue of concern (IPCC, 2007). Public acceptance of the need for adaptation, and of specific measures, also needs to be increased (Neumann et al., 2000). According to IPCC below are the major impediments to the success of adaptation in the coastal zone:
- Lack of dynamic predictions of landform migration; - Insufficient or inappropriate shoreline protection measures;
- Data exchange and integration hampered by divergent information management systems;
- Lack of definition of key indicators and thresholds relevant to coastal managers; - Inadequate knowledge of coastal conditions and appropriate management measures; - Lack of long-term data for key coastal descriptors;
- Fragmented and ineffective institutional arrangements and weak governance; - Societal resistance to change;
IPCC says that Integrated Coastal Zone Management (ICZM) provides the main opportunity to deal with many challenges and issues indentified above. Since it offers advantages over purely sectoral approaches, ICZM is widely recognised and promoted as the most appropriate process to deal with CC, SLR and other current and long-term coastal challenges (Isobe, 2001; Nicholls and Klein, 2005; Harvey, 2006b). ICZM focuses on integrating and balancing multiple objectives in the planning process (Christie et al., 2005). Attention is also paid to legal and institutional frameworks that support integrative planning on local and national scales (IPCC, 2007). Different social groups have contrasting, and often conflicting views on the relative priorities to be given to development, the environment and social considerations, as well as short and long-term perspectives (Visser, 2004).
2.3 European Environment Agency (EEA)
The EEA is an agency of the European Union, with major information about adopting, developing, implementing and evaluating environmental policy, and also the general public. In 1993 was adopted the regulation establishing the EEA by the European Union (EU). The
21 regulation also established the European environment information and observation network (Eionet). Currently, the EEA has 32 member countries.
The EEA have two main documents about CC in coastal zone: “Impacts of Europe's changing climate - 2008 indicator-based assessment” and “Vulnerability and adaptation to climate change in Europe”.
“Impacts of Europe's changing climate - 2008 indicator-based assessment”, relatively at this research‟s theme speaks about: the marine biodiversity and ecosystems; water quantity, river floods and droughts; Freshwater quality and biodiversity. Also speaks about the aspects, consequences of climate change and the projections of sea level according to IPCC.
“Vulnerability and adaptation to climate change in Europe” aims to provide an overview of key vulnerabilities to, and ongoing activities for adapting to the impacts of climate change, including climate variability and SLR, in EEA member countries. The aim is also to identify challenges for CC adaptation strategies and measures in Europe.
According to EEA (Vulnerability and adaptation to climate change in Europe, 2005) one third of the EU population is estimated to live within 50 km of the coast. In Denmark, the proportion is as high as 100 % and 75 % in the United Kingdom and the Netherlands (Nicholls and Klein, 2003b). Significantly inhabited coastal areas in countries such as the Netherlands, England, Denmark, Germany and Italy are already below normal high-tide levels, and more extensive areas are prone to flooding from storm surges (EEA, 2005). Hard defences to prevent such flooding and the loss of the seaward edge of coastal habitats, which are due to existing rates of sea-level rise, are already causing significant pressures on coasts in many locations (e.g. Rigg et al., 1997). Deltaic areas often are particularly threatened because they naturally subside and may have been sediment starved by dam construction (e.g. Sanchez-Arcilla et al., 1998). It is estimated that 9 % of all European coastal zones (12 % for EU Member States), which can be defined as a 10 km strip, lie below a 5 m elevation and are potentially vulnerable to SLR and related inundations (EEA, 2005). The most threatened coastal environments within Europe are deltas, low-lying coastal plains, islands and barrier islands, beaches, coastal wetlands, and estuaries (Beniston et al., 1998; Nicholls and Klein, 2004).
According to EEA 2005, policies, guidance documents, regulations, and even concrete technical adaptation actions have been developed at the EU, national, and sub-national levels but some of these measures are not deliberately designed for adaptation to long-term climate change impacts; instead, they are developed for addressing short-term extremes.
At EU level, management action plan and flood prevention is being developed. EU
Environment Ministers asked the European Commission to table a formal proposal for the plan, which will be based on solidarity and will make provision for an early warning system, integrated flood basin and flooding management plans and the development of flood risk maps. The plan includes a possible future Floods Directive. At national level, many northern and western European countries have national flood management policies and guidelines. Integrating new information on climate change and its potential impacts, such policies and guidelines are being reviewed and adjusted periodically (EEA, 2005). According to EEA 2005 adaptation to CC in Europe has been hampered by a combination of factors. They include:
- “significant uncertainties associated with climate and non-climate scenarios required for impact, vulnerability and adaptation assessments;
- gaps in knowledge about the underlying causes of vulnerability and the theory of adaptation;
- lack of policy guidance and institutional support
23
3 Management of coastal zones
3.1 Integrated Coastal Zone Management in European Union
The coastal zone is a dynamic area where land and sea meet and interact. In addition to this there is the complexity of many different demands from, economic, environmental and community sectors and, more often than not, these demands on the coast exist in conflict with each other. The Integrated Coastal Zone Management (ICZM) is the process that brings together all these sectors, namely those involved in the development, management and use of the coast in order to integrate their interests in working towards a common goal.
Bellow is the definition of ICZM according to the European Commission: "A dynamic, continuous process designed to promote sustainable management of coastal zones. ICZM seeks, over the long-term, to balance the benefits from protecting, preserving, and restoring coastal zones, the benefits from minimizing loss of human life and property, and the benefits from public access to and enjoyment of the coastal zone, all within the limits set by natural dynamics and carrying capacity."
From 1996 to 1999, the European Commission have developed a Demonstration Programme on ICZM designed around a series of 35 demonstration projects and 6 thematic studies. The programme was intended to lead to a consensus regarding the measures necessary in order to stimulate ICZM in Europe. As a result of this work two documents where published in 2000:
- A Communication "Integrated Coastal Zone Management: A Strategy for Europe" - detailing how ICZM will be promoted.
- A proposed Recommendation concerning the Implementation of Integrated Coastal Zone Management in Europe - outlining steps for Members States to take in the development of national ICZM strategies.
In 2002, the EU adopted the Recommendation on implementing ICZM in Europe. This asked Member States to undertake a stock take of coastal legislation, institutions and stakeholders in order to develop national ICZM strategy.
The EU ICZM Recommendation calls for a strategic approach to coastal zone planning and management in order to achieve sustainable development. The evaluation of the EU ICZM Recommendation has shown that the EU ICZM Recommendation has had a positive impact in stimulating progress towards a more integrated planning and management of coastal zones in Europe. The future EU Maritime Policy and its environmental pillar, the EU Marine Strategy, will give new impetus to our ICZM policy and further improve its implementation in the years to come (COM nº308, 2007). To support the implementation of ICZM, opportunities are offered especially through the Cohesion Policy, the European Fisheries Fund and as part of the Research Framework Programme.
In this context, the current EU ICZM Recommendation remains valid to support the implementation of the national strategies and to further ICZM along Europe's coast (COM nº308, 2007).
The Recommendation also established eight principles to be followed in the national strategies that had been established on the basis of experiences developed by the Demonstration Programme:
1. “A broad overall perspective (thematic and geographic) which will take into account the interdependence and disparity of natural systems and human activities with an impact on coastal areas;
2. A long-term perspective which will take into account the precautionary principle and the needs of present and future generations;
3. Adaptive management during a gradual process which will facilitate adjustment as problems and knowledge develop. This implies the need for a sound scientific basis concerning the evolution of the coastal zone;
4. Local specificity and the great diversity of European coastal zones, which will make it possible to respond to their practical needs with specific solutions and flexible measures;
25 5. Working with natural processes and respecting the carrying capacity of ecosystems,
which will make human activities more environmentally friendly, socially responsible and economically sound in the long run;
6. Involving all the parties concerned (economic and social partners, the organisations representing coastal zone residents, nongovernmental organisations and the
business sector) in the management process, for example by means of agreements and based on shared responsibility;
7. Support and involvement of relevant administrative bodies at, regional and local level between which appropriate links should be established or maintained with the aim of improved coordination of the various existing policies. Partnership with and between regional and local authorities should apply when appropriate;
8. Use of a combination of instruments designed to facilitate coherence between sectoral policy objectives and coherence between planning and management.”
Below informs the different coastal management documents for each country (Wales and Portugal).
3.2 Wales
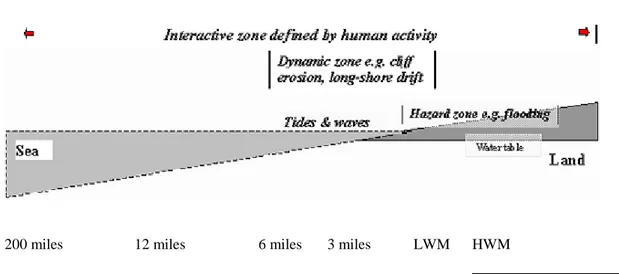
Jurisdiction for coastal and marine issues is the responsibility of a wide range of organisations. The principal agencies and their main responsibilities are given in Table 3 in relation to relevant activities in the 'coastal zone'. Note well these are not exhaustive but are provided to give an indication of the range of responsibilities.
Table 3 – Principal agencies and their main responsibilities
200 miles 12 miles 6 miles 3 miles LWM HWM
Local Authority (Planning control, coast protection, oil pollution to MLW, recreation, site management)
Environment Agency (Water quality, flood defence)
Department of Transport and the Regions (Coastal policy co-ordination, aggregate extraction)
Department of Trade and Industry (off shore oil and gas licensing )
English Nature (Nature conservation objectives including SAC's)
The Ministry of Agriculture, Fisheries and Food (Grant aid for coast protection and flood defence)
The Ministry of Agriculture, Fisheries and Food (Fisheries management)
European Commission (Common fisheries policy, water quality, habitats directive)
For the management of coastal zone there are several of organisations with responsibility or interest. To improve the integration of management processes in different coastal zones the Government published a Strategy for promoting an integrated approach, in January 2009. According to Department of Environment, Food and Rural affairs (DEFRA, 2009) the strategy has the Government‟s objectives, visions for the process of coastal
management, also explains how the Marine and Coastal Access Bill and other work across Government Departments will contribute to coastal integration, while setting out a series of further actions we are committed to taking forward . In Wales, overall policy responsibility for coastal flood and erosion risk management remains with the welsh Assembly
Government, with the Environment Agency Wales and local authorities carrying out works on the ground and developing Shoreline Management Plans (DEFRA, 2009). Shoreline management plans (SMPs) are developed through consultation with local communities and are based on the best available science on climate change and understanding of coastal processes (DEFRA, 2009). In the 1990s the first generation of SMPs was completed, then
27 with a review of weakness and strengths and full consultation, was updated and published the guidance on SMPs in 2001.This guidance concluded that the first generation SMPs were excellent high-level strategic documents but that further research was needed into how the coast would evolve (DEFRA, 2009). Work is now underway on the second generation of SMPs, which should be completed by December 2010.
3.2.1 ICZM strategy
The Welsh Assembly Government in March 2007 produced “Making the Most of Wales‟ Coast - the Integrated Coastal Zone Management Strategy for Wales”. The report provides an overview for the development of actions that will bring together the coastal policies and activities in Wales. Also outlines the values of ICZM including the 8 principles described in the EU Recommendation on ICZM and put in practice in Wales and outlines the issues that Wales coast faces from tourism and fisheries to conservation and climate change and sets out how the ICZM should do to address these.
The definition of an ICZM in this report “is a process which brings together all those involved in the development, management and use of the coast to help ensure future management takes place in an integrated and informed way. In essence, ICZM is about the sustainable management of the coastal zone.” (Making the Most of Wales‟ Coast - the Integrated Coastal Zone Management Strategy for Wales, 2007)
This report refers to the Wales National Strategy, which “aims to provide a management framework to facilitate integrated working on the coast by the different interests involved in managing our coastal assets – with the aim of helping them ensure that these assets are maintained and enhanced for the benefit of present and future generations. It also sets out the links that must be made between diverse national and local policies and strategies so that the people involved in managing and using the coast can do so in a way that takes into account the needs of others. It is not, however, a „master plan‟ for development on the coast.”
Making the Most of Wales‟ Coast - the Integrated Coastal Zone Management Strategy for Wales refers to climate change.
In the UK there is a programme “UK Climate Change Impact Programme (UKCIP)” which has modelled several of scenarios on different emission projections. In general terms the model suggests that Wales can expect: an increase in the number of hot and dry summers and an
increase in the number of extremely hot days; an increase in winter rainfall; hotter average temperatures; milder winters and a reduction in snowfall; and a longer growing season.
2004 Foresight Report forecast informs that by 2080 the general risk of coastal flooding could increase between 2 and 20 times and estimates indicate some 39,000 properties may be at risk from coastal flooding. Making the Most of Wales‟ Coast says that the low lying, urbanised coasts and estuaries of South and North East Wales are most at risk from coastal flooding and the rate of coastal erosion could also increase in future if Wales does see an increase in stormy weather due to climate change. To resolve this is necessary to depart from the traditional approach of building defences and turning over more of a risk management. Streamlining of the existing flood defence arrangements in Wales reflects this, with the establishment of Flood Risk Management Wales to provide the focus for risk management in the future (Making the Most of Wales‟ Coast - the Integrated Coastal Zone Management Strategy for Wales, 2007).
The recent publication by the National Trust of „Shifting Shores – living with a changing coastline‟ vividly illustrates the potential impacts of CC on the natural, cultural and historic heritage of Wales (Making the Most of Wales‟ Coast - the Integrated Coastal Zone Management Strategy for Wales, 2007).
A range of organisations is involved in the management of Wales‟ coastal resources. As National Assembly for Wales has a range of powers which include the licensing of the Welsh fishing fleet and quota management; licensing of disposal of material at sea; water quality; flood and coast protection policy; nature conservation designations; licensing aggregates dredging; and for setting the national planning policy framework including Planning Policy Wales and Technical Advice Notes on issues like coastal planning.
Other agencies in Wales also have legislative powers and/or programmes of work specific to the Welsh coast are the Environment Agency Wales, the Countryside Council for Wales and the National Trust.
3.2.2 Planning Policy Wales (PPW)
PPW sets out the land use planning policies of the Welsh Assembly Government.
29 - “recognise the importance of the coast for conservation of the natural and historic
environment;
- recognise the importance of the coast for urban and rural development, including housing, local industry and agriculture; and
- recognise the importance of the coast for tourism, leisure and recreation.”.
It is possible to verify that any of these objectives focuses on CC in coastal zone directly.
In Wales, every local planning authority must prepare a Unitary Development Plan (UDP) for its area. The plan will be the UDP for each county council or county borough council and each National Park authority (PPW, 2002). These local planning authorities must apply specific policies that reflect the characteristics of their coastlines as physical, biological, land use and also the likely effects of climate change.
In preparing their UDPs is expected that the local planning authorities take into account other plans and policies, with implications for the coastal zone. According to PPW (2002) they will need to consider landward pressures (include major developments on the coast, port and harbour works, leisure and recreational facilities, wind power generation or coastal defences) and seaward pressures (include waste disposal, sea fishing, increased leisure sailing, dredging of navigable channels, water sports and bathing, marine aggregates extraction or tidal and wave power generation) - and the impacts of these pressures - on coastal systems.
In considering applications for planning permission for new coastal defence works, local planning authorities should take into account all potential environmental effects, both on and off-shore, and information contained in shoreline management plans (PPW, 2002).
PPW speaks also about flood risk and CC. The objectives of the Assembly Government to sustainable development requires action through a planning system to depart from the flood defence and mitigation of consequences of new development in areas of flood risk for a more positive avoidance development in areas defined as being at risk of flooding. Planning authorities should therefore adopt a precautionary approach when considering planning applications, and when formulating UDP policies on development and flood risk. In this context, the precautionary principle should be applied on the basis that climate change is likely
to increase the risk of coastal and river flooding as a result of sea-level rise and more intense rainfall (PPW, 2002).
Local planning authorities when they are preparing their UDPs, they should consult with the Environment Agency and adjacent authorities and to ensure that, as well as not being at risk itself, development does not increase the risk of flooding elsewhere. When drawing up policies and proposals for their area local planning authorities must acknowledge that government resources for flood and coastal defence projects are directed at protecting „existing‟ developments and are not available to provide defences in anticipation of future development (PPW, 2002). Therefore a sustainable approach to flooding will involve the avoidance of development in flood hazard areas and where possible or practical the encouragement of managed retreat, the creation of washlands and flood plain restoration.
PPW (2002) says that local planning authorities should recognise that it will be inappropriate to locate certain types of development such as hospitals, schools, residential development and emergency services within some areas defined as being of high flood hazard. In such areas, local planning authorities should ensure that only appropriate land allocations are made during the preparation of UDPs (PPW, 2002).
The Environment Agency has a key role in advising and helping planning authorities and developers to understand the effects of flooding within a river catchment and useful advice is contained in relevant catchment management plans and Local Environmental Action Plans (LEAPs). The Environment Agency has developed a policy entitled Policy and Practice for the Protection of Floodplains which aims to assist local planning authorities in their control of development (PPW, 2002).
Concludes that Wales takes into account the CC in coastal zone, but should have a document in Wales just for CC in coastal zones.
3.3 Portugal
3.3.1 National Strategy for ICZM (NSICZM)
The Portuguese National Strategy for Integrated Coastal Zone Management (NSICZM) was published by the Resolution of the Council of Ministers n. º. 82/2009 of 8th September establishes the strategic reference framework for the global management, integrated and participatory of coastal zone, to ensure sustainability conditions for its development.