1. 3-D reconstruction by extended depth-of-field in tribological analysis: Fractal approach of sliding surface in Polyamide66 with glass fiber reinforcement.
1. Ana Horovistiz*,Susana Laranjeira, J. Paulo Davim
2. TEMA, Department of Mechanical Engineering, University of Aveiro, 3810-193 Aveiro, Portugal 3.
4. *Correspondent author contact information: Ana Horovistiz,
5. TEMA, Department of Mechanical Engineering, University of Aveiro, 3810-193 Aveiro, Portugal, 6. Tel: (+351) 234 370 830;Fax: (+351) 234 370 95
7. [email protected] , [email protected] Abstract
Kewords: 1. Introduction
Polymeric materials have been replacing metallic materials in several tribological applications in industry, such as bearings, seals, gear wheels, due combined requirements of light weight, ease of processing, mechanical strength and stiffness, lower friction coefficient and wear [1-3].
The properties of polymer composites are determined by design of the reinforcement phase within the matrix phase. The most common reinforcements used for the so-called Engineering Plastics, in general, and the polyamides, in particular, are carbon and glass fibers due to their high modulus of elasticity. Glass fibers have the advantages of combining good thermal conductivity, tensile strength, wear resistance, in addition to costing less than one- third of the price of carbon fiber [4]. The tribological behavior of these composites varies according to the amount of reinforcement [5], fiber orientations to the sliding interface [6], as well as the set of conditions of the tribological tests, such as, contact temperature, sliding velocity, contact pressure [7,8].
In general, the literature on sliding surface analysis of polymer composites suggests the use of scanning electron microscopy (SEM) [5,6,9,10] due to its peculiar advantages, such as, large depth of field and fine lateral resolution. In fact, the images produced by the SEM have great sharpness and are quite representative of the sliding surfaces of the polymer composites. In addition, this microscopy have the advantage to combine the images obtained through secondary electron signal (topography and morphology) with images obtained by backscattered electrons signal (contrasts in compositions).
Nevertheless the SEM has several limitations [11,12,13]: costly operation, electron beam-induced damage, vacuum degradation, charging effects, sputter-coating artifacts. Similarly, the use of atomic force microscopy, in spite of the large resolution and directly providing 3D images, usually covers very small and shallow areas.
The optical microscope (OM) is normally undervalued and considered an equipment of minor importance in the topographic analysis of polymeric composites. The issue of contrast, which is often pointed out as a limitation of OM, can be partially solved with a selection of contrast techniques like the use of green filter and Differential interference contrast (DIC) technique improving the perception of topography variation in the bright field [14].
Alternatively, the morphology and topography of sliding surfaces of polymeric composites could be inspected by the extended depth of focus (EDF) from OM images. This technique consists on acquisition of sequence pictures with a digital camera in an optical microscope with progressive focusing with a regular displacement intervals, and taking the best-focused pixels for each x-y position throughout the entire stack to construct a focused picture to provide a reliable elevation map (15]. This technique has been applied to quantitative fractography and is very well supported by the set of articles developed by Hein et al. [14-18]. Nowadays there are several freeware solutions for EDF reconstruction. Some of them are available as plugins or commands for NIH ImageJ [16], a public domain Java image processing and analysis program, winch are are widely used by the academic community, as well as provide analysts with free reliable software options.
The surface topography plays an important role on understanding on friction and wear behavior, on the other hand the wear process itself can modify the surface of sample. Thus, several papers have been dedicated to find out qualitative and quantitative relationships between topography changes and tribological behavior. Some authors have opted for the fractal approach to describe the topography of the sliding surfaces, since the fractal geometry can be effectively applied to tribological processes which are stochastic in nature.
The term "fractal" was created by Benoit Mandelbrot in 1977 to a plot developed to represent a series of chaotic processes in nature. The main characteristic of a perfect fractal object is its "self-similarity" and scale-independent., it means, the maintenance of a relief pattern regardless of its scale [19]. In nature, though, most surfaces are rough and multi-scale. The real-world data show self-similarity happens only locally on a certain variety of scales, which defines the concept of multi-fractal. In this way, the sliding surfaces are, in general, self-similar instead of self-similar, with different
properties that vary with the magnification of the image [20]. These sliding surfaces cannot be described by a single dimension, but by an infinite number of fractal dimensions.
Zhu et.al [21] assumed a monofractal approach to characterize the sliding surface of metallic alloys in tribological tests and concluded neither fractal dimension nor the scale coefficient used alone were optimal in characterizing rough surfaces. The same way, other authors assigned unique values for the fractal dimension on the tribological behavior studies: Izquierdo et al. [22] developed a method of characterization and modeling for sliding surfaces based on the fractal concept; Liang et al. [23] found qualitative relations between the fractal dimension and some mechanical properties of engineering ceramics; Stachowiak et al. [24].developed a hybrid fractal-wavelet method to classification of tribological surfaces; Ji et. al [25] developed a method combining three parameters, among them the fractal dimension, to analyze the topography of sliding surfaces of different tribological pairs. In fact, the real issue relies on the fact that sliding surfaces do not present the same behavior at all scales due to the intrinsic anisotropy of wear processes [26]
According Kaye [27] several phenomena of formation of rough surfaces, such as fracture surface, distribution of corrosion sites, among others, could be described as mixed fractals, the author summarized this multi-fractal behavior in two scales for fractal analysis, nominating then as ‘‘structural’’ dimension (Ds) and ‘‘textural’’ dimension (Dt) according to their scale range. The structural dimension represents small scales, or fine roughness, where compositional aspects of the object emerge, whereas the textural dimension represents large scales and describes a physical process that controls the surface roughness [19]. This approach raises another issue in terms of the field of image processing: fractal dimension is not a good texture descriptor since the images does not exhibit the same structure at all scales [14]. The general idea is: limiting the scale range may improve the fractal characterization of fracture surfaces and the definition of scale ranges may delimit the influence of the acting factors in crack growth processes. This scale boundary also must improve the accuracy of fractal dimension as a texture parameter by diminishing the anisotropy influences on fractal measurement.
The main objective of this study is to evaluate the fractal behavior of sliding surfaces of Polyamide66 with glass fiber reinforcement after tribological tests, measuring the sliding surface topography perpendicularly to the sliding direction after tribological tests, comparing mixed or multi-fractal values to corresponding morphological and tribological data. Thus, this work also intends to contribute to expand the set of useful tools for quantitative inspection of wear in composite materials.
In this context, the 3-D reconstruction by extended depth-of-field is presented here as a tool for quantitative evaluation of sliding surfaces. Finally, it is proposed a new method to split between the textural and structural fractal scales.
2. Experimental procedure 2.1 Tribological tests
The tribological tests were conducted using the commercial material polyamide 66 reinforced with 30wt% glass fibers (PA66GF30). The fiber orientations were fabricated normal with respect to the sliding interface. Table 1 presents the physical-chemical properties of the materials. The properties of PA66 are also shown for comparison.
Friction and wear behavior of the polymers were carried out on a Pin-on-Disk Tribometer, in dry sliding conditions. Cilindric pin shaped samples of PA66GF30 (diameter of 15mm and height of 10 mm) were allowed to slide against a rotating disk (diameter of 76mm and height of 8 mm). The pin stays on the disk with two degrees of freedom: one vertical, which allows its direct contact with the surface of the disk, and another horizontal which is shown the friction on the contact, activating the load cell with a strain which is a function of the friction torque. The temperature on contact was measured in steel disk boundary with an optical pyrometer. The counterface material was Ck45K-DIN steal with 0.45%C, 0.25%Si, 0.65%Mn and average surface hardness is 220HB. The tribological tests used the same sliding velocity (0.48 m/s) and sliding distance (7500m), with three values of contact pressures. All tests were run in duplicate.
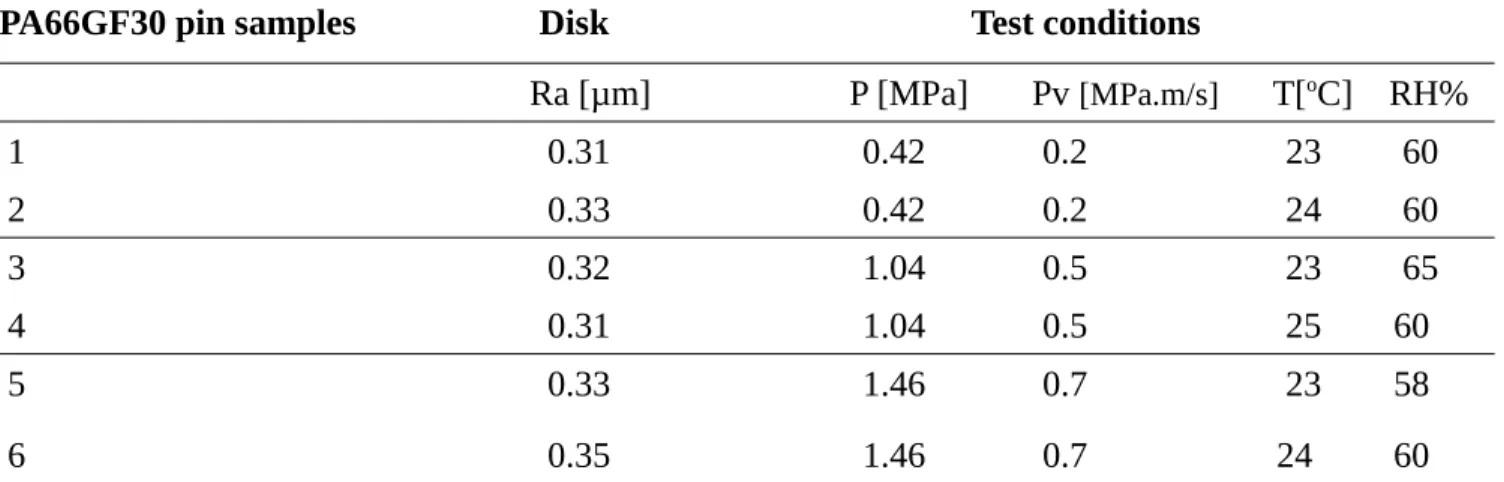
The other detailed conditions are listed in Table 2, where: m is the initial mass of pins; Ra is the surface roughness of the disk; P is the contact pressure; PV is the momentum (product of pressure and velocity); T is the room temperature; and RH% is the relative humidity. Two tests were performed for each pair and tribological condition.
Table1 Physical-chemical properties of materials.1
Properties Standards PA66 PA66GF30
Phisical proprerties Density g/cm³ ISO1183 1.14 1.29 Melting temperature ºC 260 260 Thermal conductivity at 23°C W/(K.m) 0.2 0.3 Mechanical properties at 23°C
Modulus of elasticity (Mpa) ISO 527 3250 590
Tensile Strength MPa ISO 527 80 85
Hardness (Rockwell Test) ISO 2039-2 M88 M88
Table 2 Tribological tests conditions used in the studies.
PA66GF30 pin samples Disk Test conditions
Ra [µm] P [MPa] Pv [MPa.m/s] T[oC] RH% 1 0.31 0.42 0.2 23 60 2 0.33 0.42 0.2 24 60 3 0.32 1.04 0.5 23 65 4 0.31 1.04 0.5 25 60 5 0.33 1.46 0.7 23 58 6 0.35 1.46 0.7 24 60
2.3 Optical microscopy analisys and 3-D reconstruction description
After tribological tests, sixteen regions on each sliding surface sample were pictured with a digital camera in an optical microscope at regular displacement intervals following the centerline relative to the diameter of samples, sampled perpendicularly the sliding direction. Since two samples were tested by tribological condition, thirty two regions were studied per condition. The selection of the parameters of microscopy and image acquisition had the criterion of optimizing the parameters for extended depth-of-field method. These issues are explained in detail in a previous article [28]. It was used a Nikon-Eclipse LV150 microscope, a reflected Light microscope, with objective lenses for extended working distances Thus, all pictures throughout the sliding surfaces were acquired with spatial resolution of 1260 960 pixels, with a 50X objective (numerical aperture of 0.9) was used to obtain 500 total magnification under brightfield illumination, using green filter. At each position, stacks of images were pictured. Objective lenses were displaced successively in vertical position at 1mm steps for 3D mapping by an extended depth-of-field reconstruction. The algorithm used in this case was ‘‘Stack Focuser” plugin, a solution proposed by Michael Umorin and distributed from NIH ImageJ website (http://rsb.info.nih.gov/ij/plugins/stack-focuser.htm l ). It was used sample 3 of Table 2 (P=1.46MPa) as an example of extended depth-from-focus reconstruction process is presented on sequence of Fig.1.
Fig.1 Example of of extended depth-from-focus reconstruction process: (a) ordered image stack (b) reconstructed image showing scratch marks on sliding surfaces and the glass fibers; (c) corresponding 3D elevation map.
(a)
(c)
(b)
2.3 Morphological analysis
In order to analyses the morphological variation of the sliding surfaces along the diameters of the samples tested under the tribological conditions (Table2), the quantitative inspection was done from reconstruct images. Fig. 2 is a montage that shows the sampling scheme and illustrates the morphological evolution perpendicularly to sliding direction
Fig.2 Photomontage describing morphological evolution along the diameter.
The routine of image processing and analysis used for the detection of morphological aspects of surface (constituent glass fibers) along of diameters was similar to that proposed in a previous work [29]. The following parameters to evaluate fiber morphology were chosen:
2.Mean diameter
3. Aspect ratio, or the ratio between maximum and minimum chord lengths inside an object to evaluate the fiber morphology.
4. Area fraction of fibers
Populations of about 1000 features per condition were analyzed, as suggested elsewhere [30].
2.4 Fractal dimension analysis
The fractal dimension information were computed from elevation maps of all sliding surfaces samples, by using Map Fractal Count, a plug-in for NIH Image J [31], based on Minkowski–Bouligand method, also called as Box-Counting algorithm. This method is one of the most widely used algorithms to estimate the fractal dimension due to its ease of implementation and simplicity. The method consists of overlaying an image to square grids varying size and counting the number of grids needed to cover the entire image [19]. The fractal dimension can be calculated by the following equation:
(1) where N(r) is the box count (number of boxes that cover the image), and r is the box size (length of grid edge). The mono-fractal dimension is an approximation of the logarithmic regression line slope coefficient for the box count and box size.
Since the work proposal is to analyze the sliding surface using the mixed or multi-fractal approach, several procedures can be used to separate a set of points in regions of different slopes. In the case of multi-fractals the box counting method has been chosen to identify the two slopes corresponding to the structural and textural mixed fractal components. Here it was propose a new method, more robust and requiring no user's parameters like box size or limit standard deviation:
Having the (x,y) data points of length n (Fig3a), corresponding to log (box size), log (box count), the method starts by calculating the slope from point i to n, slope 1 (Fig3b). The initial slope includes all the data so that with increasing i the slopes will gradually converge to the slope calculated
with less, more sparse data. At some point there is a regime change and that is the point of interest as it separates the two regimes. But this change is not simply given by the noisy relative extreme of the slopes calculated but by the point from were the steady state is abandoned. New slopes are therefore calculated from i to n but using the data set (x, slope1) instead of (x,y). The result is slope 2 (Fig3c) which is much less noisy and can be interpreted as a second derivative so that the extreme of interest can be interpreted as an inflection point. To find it, the data set is adjusted to a polygon of degree 3 and its root within the x data range is calculated (indicated as a vertical line if Fig 3c). Finally the two slopes are calculated using the (x,y) points at the right and left of root obtained (Fig 3d).
3. Results and Discussion
Table 3 shows the experimental results obtained for the samples PA66GF30 for tribological tests at different contact pressure: friction coefficient, μ, wear coefficient, W, final temperature, Tf and maximum temperature, Tm, recorded during each test. The tribological behavior of PA66GF30 is influenced by the contact pressure. In general, it can be seen that the temperature increased with increasing contact pressure. The friction coefficient decreases with increasing contact pressure. This decrease is more sensitive in the test performed 1.46 MPa. However, the wear coefficients of PA66GF30 increases with increasing contact pressure in the tribological tests. In fact, the addition of glass fiber reinforcement to the polyamide can improve the wear resistance and decrease the coefficient of friction, since it improves the load capacity and the thermal conductivity of the polymer matrix. On the other hand, the glass fibers may work as a third body during sliding, since they have much higher hardness than the polymer matrix, causing abrasive wear on the material [9].
Table 3: Experimental results of wear coefficient, W, friction coefficient μ, final temperature Tf and the maximum temperature Tm, recorded during the tribological tests for PA66GF30 under different contact pressure. Contact pressure [MPa] W [mm3/N.m] µ [ºC]Tf [ºC]Tm 0.42 3.2E-06 0.425 51 52 1.04 8.95x10⁻⁶ 0.62 92 92 1.46 10.07x10⁻⁶ 0.39 101 119
The Table 4 shows the statistical values of morphological parameters for PA66GF30 samples under different contact pressure along the positions. One can note an evolution of the average fiber size as the contact pressure increases. These effects are most obvious for samples under condition P=1.46. The fiber growth, for this condition, is clearly associated with the increase in fiber aspect ratio values. These observations seems consistent with the parameters of tribological tests. As the contact pressure increases the sliding surface temperature also increases (Table3), thus the fibers can be pulled out more easily and, since the sliding velocity is not uniform throughout the sample, these particles can be radially dragged. Moreover, these surfaces exhibited an increasing in area fraction of fibers (Table 4),
±0.05 ±0.07 ±0.09 ±1.8E-0 8 ±5E-08 ±5.5E-08
corroborating this hypothesis. The Fig.4 illustrates some examples of micrographies of sliding surfaces of PA66GF30 samples their corresponding 3D elevation map after the tribological tests under different contact pressure,where it is possible to visualize the resulting grooving wear.
Table 4 Statistical values of morphological parameters for PA66GF30 samples under different tribological conditions
Physical Statistical Contact pressure samples (MPa) parameters parameters P=0.42 P=1.04 P=1.46
1st 2nd 3rd 4th 1st 2nd 3rd 4th 1st 2nd 3rd 4th Area Mean (mm2) 35 23 23 27 30 31 30 25 43 43 39 35
std(mm2) 17 14 17 22 11 16 14 17 36 40 27 36 CV 0.7 0.6 0.7 0.6 0.4 0.5 0.5 0.7 0.8 0.9 0.9 1 Mean diameter Mean (mm) 5.5 5 5 6 6 6 6 5.5 7 7 7 6 SD(mm) 2 1.4 2 2.9 1.3 1.4 1.4 1.9 3 3.5 3.4 3.4 CV 0.4 0.3 0.4 0.5 0.2 0.2 0.2 0.3 0.4 0.5 0.5 0.6 Aspect ratio Mean (mm) 1.4 1.4 1.7 1.5 1.4 1.4 1.4 1.3 2.3 2.3 2.5 2.5 SD(mm) 0.3 0.3 0.6 0.5 0.3 0.4 0.4 0.2 2 2 2.2 1.9 CV 0.2 0.2 0.3 0.4 0.2 0.3 0.3 0.1 0.8 0.8 0.9 0.8 Area fraction% 10 8 10 7 15 14 16 20 16 20 23 27
(b)
(a)
(a)
(b)
Fig.4 Examples of micrographies of sliding surfaces of PA66GF30 samples their corresponding 3D elevation map after the tribological tests under different contact pressure: P=0.42 (Figs a,b); P=1.04 (Figs. c,d); P=1.46 (Figs.e,f).
The overall results presented in Table 4 correspond to the combination of morphological fiber information obtained from several sliding surfaces, collected in different fields per position of each sample in order to compensate for possible heterogeneities. It should be noted that the heterogeneity indicators can have consequences for the development of surface roughness and its effects on the tribological behavior.
In fact, there seems to be a qualitative relation between the coefficient of variation of samples (Table 4) and strutural fractal dimension, Ds, or microscale, shown in sequence of Fig.5. In general, the
(c)
(d)
greater the indicator of heterogeneity, or, the coefficient of variation, the larger dispersion can be observed for strutural fractal dimension. These results are more obvious for samples tested under conditions P =1.46 (Fig.5i,j) where larger values and larger dispersion can be observed in fourth range of sliding surfaces. Fig. 5j exhibits the highest variance value at fourth plot range. These results agree on the observation about the morphology since the more heterogeneous the morphological arrangement is, the higher is the surface roughness, or fractal dimension [32].
A visual inspection of Fig.4 suggest that for the conditions, P =0.42 and P=1.04, the roughness seems more uniform and regular. For the condition P=1.42 the topography of the surface seems more heterogenous. The abrasive wear of the polymeric composites, as polyamide with glass fiber reinforcement, takes place in contacts where the harder glass particles are pressed into the softer polyamide surface which results in plastic flow of matrix around the hard one. In general, the micromechanisms acting in association in abrasive wear of ductile materials are the micro-cutting and the ploughing. The abrasive wear regime depends on the conditions of the abrasive particles (size, shape and movement restriction) and the applied stress levels. Different combinations of these variables define different levels of system severity [33]. Depending on the shape and size of the glass particle surfaces and the degree of penetration, the removal of matrix material may take different topography, such as plowing [34]. Therefore the contact pressure and the morphology of the particles exert a marked influence on the abrasive wear of the material.
In fact, the action of the contact pressure in associationn with the aspect ratio of the particles seems to be related to the textural fractal dimension, Dt, or macroscale, as shown in Table 4 and the set of Fig.5 (c, d, gh, L and m). The sliding surfaces under P = 0.42 and P = 1.04, exhibit Dt values with lower dispersion, it means, there is more uniformity in rough roughness. It should be noted that in these samples, particles exhibit average aspect ratio close to 1.5 (values in which one feature is considered equiaxial). With increasing contact pressure, sliding surfaces under P = 1.46, which have a markedly higher and more heterogeneous particle aspect ratio (Table 4), present also larger scattering in Dt values. These observations suggest that measurements of textural fractal dimension are sensitive to changes in tribological parameters
(e)
(f)
(a)
(b)
(d)
(c)
Fig.5. Fractal behavior of samples under different tribological conditions: P=0.42: (a) Ds along positions; (b) Variance distribution of Ds values; (c) Dt along positions; (d) Variance distribution of Dt values: P=1.04: (e) Ds along positions; (f) Variance distribution of Ds values; (g) Dt along positions; (h) Variance distribution of Dt values: P=1.46: (i) Ds along positions; (j) Variance distribution of Ds values; (l) Df along positions; (m) Variance distribution of Dt values
5.Conclusions
In summary, the following comments can be done at this time:
-The fractal analysis of sliding surface in Polyamide66 with glass fiber reinforcement could be successfully conducted from elevation maps resulting for the combining of a conventional optical microscope and the 3-D reconstruction by extended depth-of-field.
-A robust method was proposed to separate the influences of micro and macro scales on multi-fractal behavior. It's a fully automatic approach requiring no user's parameters like box size or limit standard deviation.
-The mixed or multi-fractals concept seems to explain the relationship among morphological structure (size, aspect ratio...), tribological parameters (contact pressure...) and surface roughness, splitting the phenomena in two components: macro scale and micro scale.
-It is certainly necessary to carry out more experiments, to analyses a larger number of sliding surfaces samples, different tribological conditions, many other material systems s in order to improve reliability of results. However, since verifying the systematic bias, we confide that such results will provide more compelling evidence in order that approaches based on fractal analysis of sliding surfaces of polymeric composites find widespread utilization.
Acknowledgments
The authors acknowledge “Project No. 031556-FCT/02/SAICT/ 2017; FAMASI— Sustainable and intelligent manufacturing by machining, financed by the Foundation for Science and Technology (FCT), POCI, Portugal, in the scope of TEMA, Centre for Mechanical Technology and Automation – UID/EMS/00481/2013
References
[1] J.P. Davim, N. Marques, Evaluation of tribological of polymeric materials for hip prostheses application, Tribol. Lett.11 (2001) 91–94. doi: 10.1023/A:1016607400392.
[2] J.P. Davim, R. Cardoso, Tribological behaviour of the composite PEEK-CF30 at dry sliding against steel using statistical techniques, Mater. Des. 27 (2006) 338–342. doi:10.1016/j.matdes.2004.11.006.
PEEK-CF30 using artificial neural networks, J Mater. Process. Tech., 189 (2007) 374–378. doi:10.1016/j.jmatprotec.2007.02.019.
[4] J. Kim, H. Jang, J. Kim, Friction and wear of monolithic and glass-fiber reinforced PA66 in humid conditions, Wear. 309 (2014) 82–88. doi:10.1016/j.wear.2013.11.007.
[5] D. Li, X. Deng, J. Wang, J. Yang, X. Li, Mechanical and tribological properties of polyamide 6– polyurethane block copolymer reinforced with short glass fibers, Wear 269 (2010) 262–268. doi:10.1016/j.wear.2010.04.004.
[6] S. Kim, M. Wook S. Jang, Tribological properties of short glass fiber reinforced polyamide 12 sliding on medium carbon steel, Wear 274– 275 (2012) 34– 42. doi:10.1016/j.wear.2011.08.009. [7] A. Abdelbary, 1 Polymer tribology. In Wear of Polymers and Composites, Woodhead Publishing,
Oxford (2014) 1-36. doi: 10.1533/9781782421788.1
[8] N.V. Klaas, K. Marcus, C. Kellock, The tribological behaviour of glass filled polytetrafluoroethylene, Tribol. Int. 38 (2005) 824–833. doi.org/10.1016/j.triboint.2005.02.010. [9] S.N. Kukureka, C.J. Hooke, M. Rao, P. Liao, Y.K. Chen, Effect of fibre reinforcement on the
friction and wear of polyamide 66 under dry rolling-sliding contact, Tribol. Int. 32 (1999) 107– 116. doi:10.1016/S0301-679X(99)00017-1.
[10] J. Wang, M. Gu, B. Songhao, S. Ge, Investigation of the influence of MoS2 filler on the tribological properties of carbon fiber reinforced nylon 1010 composites, Wear 255 (2003) 774– 779. doi:10.1016/S0043-1648(03)00268-0.20
[11] Hein, L.R.O., Campos, K.A., Caltabiano, P.C.R.O, Kostov, K.G., A brief discussion about image quality and SEM methods for quantitative fractography of polymer composites, Scanning 35 (2013) 196–204. doi: 10.1002/sca.21048
[12] Hein, L.R.O., Campos, K.A., Caltabiano, P.C.R.O., Low voltage and variable-pressure scanning electron microscopy of fractured composites, Micron 43 (2012) 1039–1049. doi: 10.1016/j.micron.2012.04.012
[13] Hein, L.R.O., Quantitative fractography by digital image processing: NIH Image macro tools for stereo pair analysis and 3-D reconstruction, J. Microsc. 204, (2001) 17–28, doi:10.1046/j.1365-2818.2001.00920.x.
[14] Campos, K.A., Augusto, J., Pereira, T.A., Hein, L.R.O., 3-D reconstruction by extended depth-of-field in failure analysis – Case study II: Fractal analysis of interlaminar fracture in carbon/epoxy composites, Eng Fail Anal 25 (2012) 271–279. doi.org/10.1016/j.engfailanal.2012.05.015
[15] Horovistiz, A., Campos, K.A., Shibata, Prado C.S., Hein, L.R.O., Fractal characterization of brittle fracture in ceramics under mode I stress loading, Mater. Sci. Eng. A 527 (2010) 4847– 4850, doi:10.1016/j.msea.2010.04.014
[16] Hein, L.R.O., Oliveira, J.A., Campos, K.A., Caltabiano, P.C.R.O., Extended depth from focus reconstruction using NIH Image J Plugins: quality and resolution of elevation maps, Microsc. Res. Tech. 75 (2012) 1593–1607, doi:10.1002/jemt.22105
[17] Hein, L.R.O., Campos, K.A., Correlative Light-Electron Fractography of Interlaminar Fracture in a Carbon–Epoxy Composite, Microsc. Microanal. 21 (2015) 1475–1481, doi:10.1017/S143192761501538X
[18] Hein, L.R.O., Oliveira, J.A., Campos, K.A. Correlative light electron fractography for fatigue striations characterization in metallic alloys, Microsc Res Tech 76, (2013) 909–913, doi: 10.1002/jemt.22247
[19] J.C. Russ, Fractal Surfaces, Plenum Press, New York, 1994.
[20] Ling, F.F, The Possible Role of Fractal Geometry in Tribology, Tribol T 32, (1989), 497-505, doi: 10.1080/10402008908981918
[21] Zhu, H., Ge S., Huang, X., Zhang, D., Liu, J., Experimental study on the characterization of worn surface topography with characteristic roughness parameter, Wear 255, (2003) 309–314, doi:10.1016/S0043-1648(03)00215-1
[22] IzquierdoS, López, C.I., Valdés, J.R., Miana M., Martinez F.J., Jimenez, M.A., Multiscale characterization of computational rough surfaces and their wear using self-affine principal profiles. Wear 274, (2012) 1–7, doi:10.1016/j.wear.2011.07.010
[23] Liang, X.H.,Lin B.,Han, X.S., Chen, S. G., Fractal analysis of engineering ceramics ground surface. Appl Surf Sci 258 (2012) 6406–6415, doi:10.1016/j.apsusc.2012.03.050.
[24] Stachowiak, G.W., Podsiadlo, P., Classification of tribological surfaces. Tribol Int 37 (2004) 211–7, doi:10.1016/S0301-679X(03)00037-9.
topography characterization. Chin J Mech Eng-EN 23 (2010) 600–605, doi:10.3901/CJME.2010.05.600.
[26] Zuo, X., Zhu, H., Zhou, Y., Ding C., Monofractal and multifractal behavior of worn surface in brass–steel tribosystem under mixed lubricated condition, Tribol. Int. 93 (2016) 306–317, doi:10.1016/j.triboint.2015.09.035.
[27] Kaye B. The fractal approach to heterogeneous chemistry. New York: John Wiley & Sons; \ 1989.
[28] Hein, LRO, Campos, K.A., Caltabiano, P.C.R.O., Horovistiz, A., 3-D reconstruction by extended depth-of-field in failure analysis – Case study I: Qualitative fractographic investigation of fractured bolts in a partial valve, Eng Fail Anal. 17 (2010) 515–520, doi:10.1016/j.engfailanal.2009.09.012
[29] Horovistiz,A., Muccillo,E., Quantification of microstructural features in gadolinia-doped ceria containing co-additives by digital image analysis, J. Eur. Ceram. Soc. 31 (2011) 1431–1438.
doi.org/10.1016/j.jeurceramsoc.2011.02.022.
[30] American Society for Testing Materials. Standard test method for determining average grains size using semiautomatic and automatic image analysis. ASTM E1382-97(2015).
[31] Rasband WS. J Image. Bethesda, Maryland, USA: U.S. National Institutes of Health; 1997– 2008. <http://rsb.info.nih.gov/ij/>.
[32] Ribeiro, L. M.F., Horovistiz, A., Jesuıino, G.A., Hein, L.R.O., Abbade, N.P., Crnkovic, S.J.,Fractal analysis of eroded surfaces by digital image processing, Materials Letters 56 (2002) 512–517, 10.1016/S0167-577X(02)00542-6
[33] Gates, R. S., Hsu, S. M., Chemo-Mechanical Machining of Ceramics, Ceram. Trans. 102, (1999), 67-76.
[34] Hokkirigawa, K. and Kato, K. An experimental and theoretical investigation of ploughing, cutting and wedge formation during abrasive wear, Tribology Int.,21 (1988), 51-57, doi:10.1016/0301-679X(88)90128-4.