ISSN 1 5 1 7 - 7 0 7 6
Revista Matéria, v. 15, n. 2, pp. 124-130, 2010. http://www.materia.coppe.ufrj.br/sarra/artigos/artigo11213
Diameter dependence of tensile strength by Weibull analysis: Part III
sisal fiber
W.P. Inacio; F.P.D. Lopes; S.N. Monteiro
State University of the Northern Rio de Janeiro, UENF, Advanced Materials Laboratory, LAMAV; Av. Alberto Lamego, 2000, 28013-602, Campos dos Goytacazes, Brazil.
e-mail: [email protected] ; [email protected] ; [email protected]
ABSTRACT
Environmental aspects and economical advantages are motivating the use of natural fiber as reinforcement of polymer composites in substitution for synthetic fiber composites such as fiber glass. In particular, the sisal fiber is one of the most investigated and being used in engineering systems. By contrast to synthetic fibers, natural fibers have the disadvantage of being heterogeneous in their dimensions specially the diameter. In several natural fibers it has been found that the smaller the diameter, the stronger is the fiber. In this work a Weibull analysis of sisal fibers tensile strength was performed to find a correlation with the diameter. The results revealed an inverse dependence of the tensile strength with the diameter. The observation of ruptured fibers by scanning electron microscopy suggested possible mechanisms that justify a hyperbolic correlation.
Keywords: Sisal fiber, Weibull analysis, tensile test, fracture observation.
1 INTRODUCTION
In the past two decades, climate changes associates with the use of non renewable fossil fuels, mainly coal and petroleum derivatives, are motivating the substitution of natural materials for the energy-intensive synthetic ones. The so-called “green” materials are currently permeating in many industrial sectors and replacing traditional synthetic materials not only due to environmental but also to economical, societal and technical reasons. Among these successful “green” materials stands the natural fiber obtained from cellulose–based plants, also known as lignocellulosic fibers. From house construction to automobiles, the lignocellulosic fibers are replacing glass fiber especially as reinforcement of polymer composites [1-4]. Several automobile makers in Europe are increasingly using lignocellulosic fibers in many components, as illustrated in Figure 1 for a BMW sedan.
The growing interest for lignocellulosic fibers has been limited by the marked difference that exists regarding the mechanical strength. In fact, in average, the strongest lignocellulosic fibers have tensile mechanical strength below 1000 MPa [3], while the glass fiber reaches more than 3000 MPa [6]. This, together with the poor adhesion between any lignocellulosic fiber and most polymeric matrix [7], result in a much lower composite strength as compared to glass fiber composites, known as “fiberglass”. Indeed, the best lignocellulosic fiber composites display strengths around 100 MPa [4] while fiberglass exceeds 1000 MPa [6]. The future competition against the glass fiber, as possible reinforcement of structural composites, depends on the improvement of both the polymer matrix adhesion and the mechanical strength of the lignocellulosic fibers.
The fiber extracted from leaf of the sisal plant (Agave Sisalana) has a tensile strength above 600 MPa and, as such, could be a potential reinforcement to polymer matrix composites [8-11]. In a recent paper [12], a preliminary investigation on the tensile strength variation with the diameter has shown that the thinnest sisal fiber correspond to the strongest ones. It was found tensile strengths above 1000 MPa for sisal fibers thinner than 0.05 mm in diameter [12]. These results motivate a step further in the evaluation of a dependence of the sisal fiber tensile strength with its diameter. Therefore, the present work performs a statistical correlation, using the Weibull analysis, between the ultimate tensile stress and corresponding diameter of sisal fibers.
2 EXPERIMENTAL PROCEDURE
The basic material investigated in this work was the sisal fiber with characteristics presented elsewhere [11]. Here it is worth mentioning that this sisal fiber was supplied by the firm SISALSUL that commercializes Brazilian lignocellulosic fibers. From the as-received 5 kg lot, one hundred fibers were randomly separated for a statistical evaluation of their dimensions [11]. Figure 2 shows the histogram corresponding to the diameter distribution of the sisal fibers used in this investigation. In this figure it is important to notice that 9 intervals of diameters, with mean value obtained by profile projector at five positions along each fiber, being two measurements with 90° rotation in the same location, were considered from 0.04 to 0.22 mm, with an average of 0.17 mm for the distribution.
0.00 0.04 0.08 0.12 0.16 0.20 0.24 0.28 0.32 0.36 0.40
0 5 10 15 20 25
Fre
quency (%)
Diameter (mm)
Figure 2: Statistical distribution of diameter of the sisal fibers for this work.
For each interval in Figure 2, a total of 20 fibers were selected and individually tensile tested at a temperature of 25 ± 2°C in a model 5582 universal Instron machine. The tests were conducted at a constant deformation velocity of 1 mm/s corresponding to a strain rate of 3 x 10⁻³ s-1. The values obtained for the ultimate tensile stress, i.e., the tensile strength, were statistically interpreted using the program Weibull Analysis.
3 RESULTS AND DISCUSSION
Figure 3 shows representative load vs. elongation curves directly obtained from the Instron machine digital recorded data. In this figure one should observe that the typical tensile curves drop abruptly after a maximum load is reached. In general the curves are linear, characterizing an elastic behavior up to fracture, with only minor plastic strain. This indicates a brittle rupture in spite of the flexible behavior of the sisal fiber.
Load (N)
0 1 2
0 2 4 6 8 10 12
d<0,08
0 1 2 3 4 5 6
0 1 2 3 4 5 6 7
0,08<d<0,12
0,0 0,5 1,0 1,5 2,0
0 1 2 3 4 5 6 7
0,12<d<0,16
0,0 0,5 1,0 1,5
0 1 2 3 4 5 6 7
0,16<d<0,2
0 1 2 3 4 5 6 7
0 1 2 3 4 5 6 7
0,2<d<0,24
0,0 0,5 1,0 1,5 2,0 2,5 3,0
0 2 4 6 8
0,24<d<0,28
0,0 0,5 1,0 1,5 2,0 2,5 3,0
0 2 4 6 8 10 12 14 16
0,28<d<0,32
0,0 0,5 1,0 1,5 2,0 2,5
-2 0 2 4 6 8 10 12 14
0 1 2 3 4 5
0 2 4 6 8
0,36<d<0,4
Elongation (mm)
0.32<d<0.36 mm
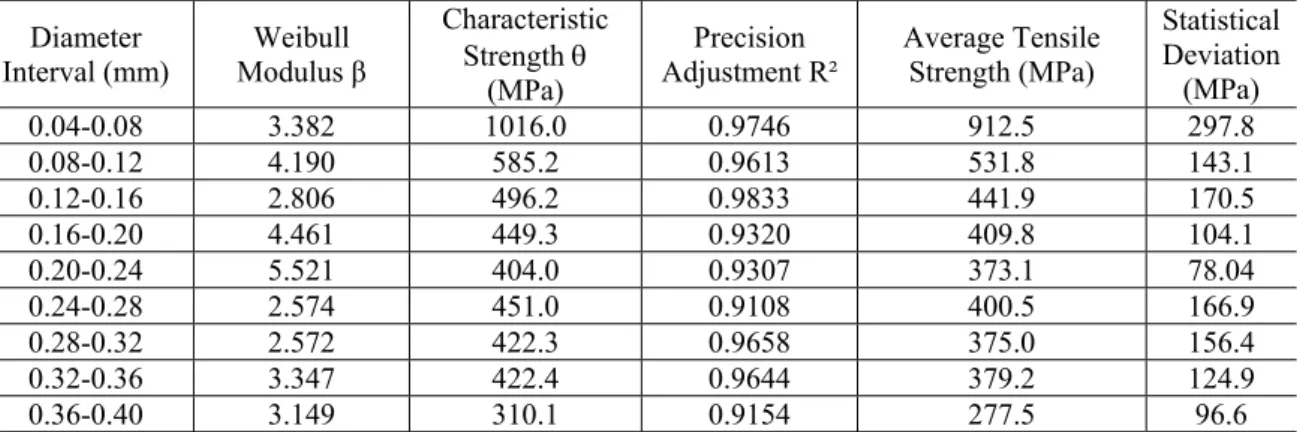
Table 1: Weibull parameter for the tensile strength of sisal fibers associated with different diameter intervals.
Diameter Interval (mm)
Weibull Modulus β
Characteristic Strength θ
(MPa)
Precision Adjustment R²
Average Tensile Strength (MPa)
Statistical Deviation (MPa)
0.04-0.08 3.382 1016.0 0.9746 912.5 297.8
0.08-0.12 4.190 585.2 0.9613 531.8 143.1
0.12-0.16 2.806 496.2 0.9833 441.9 170.5
0.16-0.20 4.461 449.3 0.9320 409.8 104.1
0.20-0.24 5.521 404.0 0.9307 373.1 78.04
0.24-0.28 2.574 451.0 0.9108 400.5 166.9
0.28-0.32 2.572 422.3 0.9658 375.0 156.4
0.32-0.36 3.347 422.4 0.9644 379.2 124.9
0.36-0.40 3.149 310.1 0.9154 277.5 96.6
Based on all tensile results such as those exemplified in Figure 3, the tensile strength, i.e. the ultimate stress associated with the point of maximum load, was evaluated. These values of tensile strength were analyzed by the Weibull statistic method for each one of the 9 diameter intervals shown in the histogram of Figure 2. Actually, the Weibull Analysis computer program provides the following parameters:
θ (characteristic strength), β (Weibull modulus), R² (precision adjustment) as well as a mean strength based on the Weibull distribution with related deviations. The values of theses parameters are listed in Table 1.
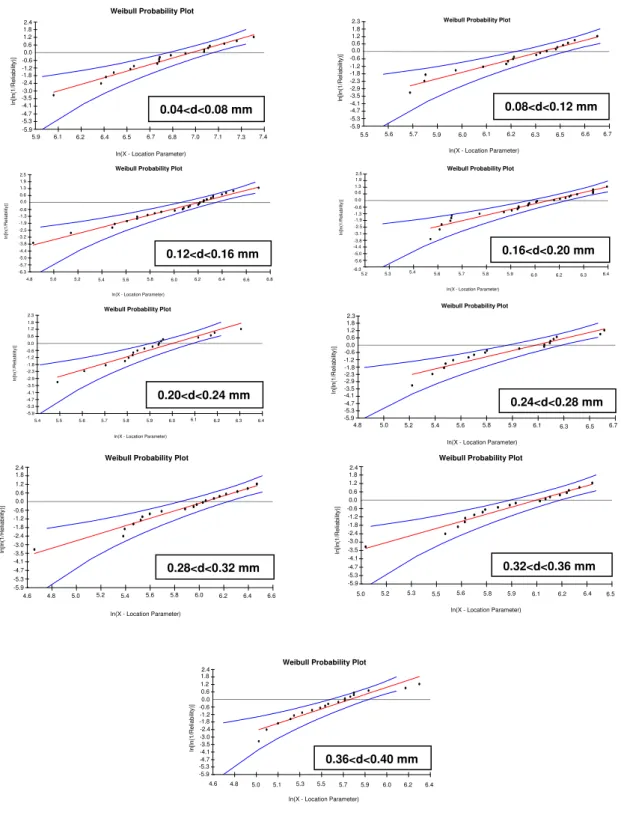
Furthermore, the Weibull Analysis program provides the graphs shown in Figure 4. In this figure it is important to observe that all graphs are unimodal, which indicates that fibers present the same behavior in each diameter interval. It should also be noticed in Fig. 4 that a single straight line fits each logarithmic plot of the reliability versus location parameter.
Figure 5 shows the variation of θ, the Weibull characteristic strength, with the mean sisal fiber diameter for each interval in the Fig. 2 histogram. In this figure there is a tendency of θ to increase the thinnest the fibers. Aparently, this tendency is associated with an inverse correlation of the fiber strength with its diameter. In a recent work with piassava fibers [13], it was found that a possible hyperbolic equation could be a proper mathematical correlation to fit θ vs. d.
In the present work, a hyperbolic equation can be used as an adjustment of θ to the values of d shown in Table 1. The best hyperbolic fit is asociated with the following equation
177
d
51
−
=
θ
(1)Figure 6 depicts the variation of
σ
m with the mean sisal fiber diameter for each interval in the Figure 2 histogram. Within the error bars two interpretations for the diameter dependence of the mean tensile strength may be considered. First, by plotting a horizontal line through the error bars. In this case the strength would not vary for diameters greater than 0.1 mm. The second alternative, following preliminary results [12], is to consider an inverse relationship to apply betweenσ
m and d. This interpretation appears to be more consistent with the characteristic strength variation with the diameter, shown in Figure 5, as in other lignocelluosic fibers [12, 13].It is then suggested that a hyperbolic equation could adjust thedata in Figure 6. In this case the following equation gives the best fit.
σ
m 177d 45+
= (2)
This equation is very similar to Equation (1) indicating a coherence in the Weibull statistical analysis for the tensile strength dependence with the diameter of sisal fibers. It is also similar to the one recently obtained for sisal fibers in a preliminary investigation [12]. In that work, the Weibull method, was not used, just arithmetic average and standard deviation.
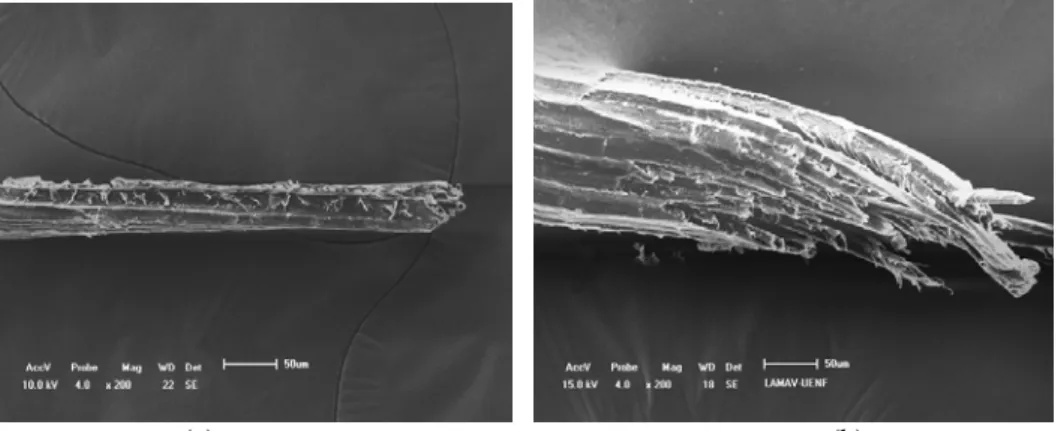
relatively more fibrils. This fractographic results indicates that, statistically, there is a higher probability that a thicker fiber would break at a stress lower than that required for a thinner fiber.
Figure 4: Weibull graphs for the tensile strenght of sisal fibers for different diameter intervals.
Owing to the large dispersion in properties of lignocellulosic fibers [4], the thicker sisal fiber, with more fibrils, has a comparative larger distribution of both weaker and stronger fibrils. Consequently, during the tensile test there is a higher probability that a weaker fibril in the thicker fiber breaks at lower stress than the weaker fibril in the thinner fiber. Once the first fibril is broken, it causes a flaw in the fiber structure, which propagates until total rupture. In other words, statistically the many fibrils of a thicker fiber tend to
Weibull Probability Plot
ln [ln (1 /R e lia b ili ty )]
ln(X - Location Parameter) -0.6 -1.2 -1.8 -2.4 -3.0 -3.5 -4.1 -4.7 -5.3 -5.9 0.0 0.6 1.2 1.8 2.4
5.9 6.1 6.2 6.4 6.5 6.7 6.8 7.0 7.1 7.3 7.4
0.04<d<0.08 mm
Weibull Probability Plot
ln [ln (1 /R e lia b ili ty )]
ln(X - Location Parameter) -0.6 -1.2 -1.8 -2.3 -2.9 -3.5 -4.1 -4.7 -5.3 -5.9 0.0 0.6 1.2 1.8 2.3
5.5 5.6 5.7 5.9 6.0 6.1 6.2 6.3 6.5 6.6 6.7
0.08<d<0.12 mm
Weibull Probability Plot
ln [ln (1 /Re lia b ility) ]
ln(X - Location Parameter) -0.6 -1.3 -1.9 -2.5 -3.2 -3.8 -4.4 -5.0 -5.7 -6.3 0.0 0.6 1.3 1.9 2.5
4.8 5.0 5.2 5.4 5.6 5.8 6.0 6.2 6.4 6.6 6.8
0.12<d<0.16 mm
Weibull Probability Plot
ln [ln (1 /Re lia b ility) ]
ln(X - Location Parameter) -0.6 -1.3 -1.9 -2.5 -3.1 -3.8 -4.4 -5.0 -5.6 -6.3 0.0 0.6 1.3 1.9 2.5
5.2 5.3 5.4 5.6 5.7 5.8 5.9 6.0 6.2 6.3 6.4
0.16<d<0.20 mm
Weibull Probability Plot
ln [ln (1 /R e lia b ili ty )]
ln(X - Location Parameter) -0.6 -1.2 -1.8 -2.3 -2.9 -3.5 -4.1 -4.7 -5.3 -5.9 0.0 0.6 1.2 1.8 2.3
4.8 5.0 5.2 5.4 5.6 5.8 5.9 6.1 6.3 6.5 6.7
0.24<d<0.28 mm
Weibull Probability Plot
ln [ln (1 /Re lia b ility) ]
ln(X - Location Parameter) -0.6 -1.2 -1.8 -2.3 -2.9 -3.5 -4.1 -4.7 -5.3 -5.9 0.0 0.6 1.2 1.8 2.3
5.4 5.5 5.6 5.7 5.8 5.9 6.0 6.1 6.2 6.3 6.4
0.20<d<0.24 mm
Weibull Probability Plot
ln [ln (1 /R e lia b ili ty )]
ln(X - Location Parameter) -0.6 -1.2 -1.8 -2.4 -3.0 -3.5 -4.1 -4.7 -5.3 -5.9 0.0 0.6 1.2 1.8 2.4
4.6 4.8 5.0 5.2 5.4 5.6 5.8 6.0 6.2 6.4 6.6
0.28<d<0.32 mm
Weibull Probability Plot
ln [ln (1 /R e lia b ili ty )]
ln(X - Location Parameter) -0.6 -1.2 -1.8 -2.4 -3.0 -3.5 -4.1 -4.7 -5.3 -5.9 0.0 0.6 1.2 1.8 2.4
5.0 5.2 5.3 5.5 5.6 5.8 5.9 6.1 6.2 6.4 6.5
0.32<d<0.36 mm
Weibull Probability Plot
ln [ln (1 /R e lia b ili ty )]
ln(X - Location Parameter) -0.6 -1.2 -1.8 -2.4 -3.0 -3.5 -4.1 -4.7 -5.3 -5.9 0.0 0.6 1.2 1.82.4
4.6 4.8 5.0 5.1 5.3 5.5 5.7 5.9 6.0 6.2 6.4
have one of them breaking shortly during the tensile load as compared to any of the fewer fibrils of a thinner fiber. Thus, the fiber with smaller diameter will be stronger than the one with greater diameter.
0.0 0.1 0.2 0.3 0.4 0.5
200 400 600 800 1000
W
e
ibul
l Cha
racte
ristic S
tress (MP
a
)
Mean Diameter (mm)
Figure 5: Variation of the characteristic strength with the mean diameter of sisal fibers.
0.0 0.1 0.2 0.3 0.4
0 200 400 600 800 1000 1200
Ave
ra
ge T
e
ns
ile
St
re
ngt
h (
M
Pa)
Mean Diameter (mm)
Figure 6: Variation of the average tensile strength with the mean diameter for sisal fibers.
(a) (b)
Figure 7: SEM fractograph of tensile-ruptured tips of sisal fibers (a) thinner, d = 0.05 mm and (b) thicker, d = 0.15 mm.
As a final remark regarding the inverse strength/diameter correlation given by Equation (2), one could in practice obtain stronger fibers by selecting the thinner ones. This would allow polymer composites to be fabricated with improved mechanical of properties by reinforcement with these thinner fibers.
4 CONCLUSIONS
It is suggested, based on the present results and other lignocellulosic fibers, that a hyperbolic equation could adjust this inverse correlation between strength and diameter in sisal fibers.
Fractographic analysis statistically supports a mechanism of premature rupture in thicker fiber due to the relatively larger distribution of fibril as compared to thinner fibers.
5 ACKNOWLEDGEMENTS
The authors thank the support to this investigation by the Brazilian agencies: CNPq, CAPES, FAPERJ and TECNORTE/FENORTE.
6 REFERENCES
[1] WANBUA, P., IVENS, I., VERPOEST, I., “Natural fibers: can they replace glass and fibre reinforced plastics?”, Composites Science and Technology, v. 63 , pp. 1259-1264, 2003.
[2] ZAH, R., HISCHIER, R., LEÃO, A.L., BROWN, I., “Curaua fibers in automobile industry – A sustainability assessment”, Journal Cleaner Production, v. 15, pp. 1032-1040, 2007.
[3] SATYANARAYANA, K.G., GUIMARÃES, J.L., WYPYCH, F., “Studies on lignocellulosic fibers of Brazil Part I: Source, production, morphology, properties and applications”, Composites: Part A, v. 38, pp.1694-1709, 2007.
[4] MONTEIRO, S.N., LOPES, F.P.D., FERREIRA, A.S., NASCIMENTO, D.C.O., “Natural fiber polymer matrix composites: cheaper, tougher and environmentally friendly”, JOM – The Member Journal of TMS, v. 61, n. 1, pp. 17– 22, 2009.
[5] BMW, in: http://www.bmw.com, Accessed on 2010.
[6] CALLISTER JR., W.D., Materials Science and Engineering – An Introduction, 5 ed., New York, NY, John Wiley & Sons, 2000.
[7] VASQUEZ, A., RICCIERI, J., CARVALHO, L., “Interfacial properties and initial step of water sorption in uniderectional unsaturated polyester/vegetable fibre composites”, Polymer Composites, v. 20, pp. 29-27, 1999.
[8] NAIR, K.C.M., DIWAN, S.M., THOMAS, S., “Tensile properties of short sisal fiber reinforced polystyrene composites”, Journal Applied Polymer Science, v. 60, n. 9, pp. 1483-1497, 1996. [9] JOSEPH, P.V., JOSEPH, K., THOMAS, S., “Short sisal fiber reinforced polypropylene composites: the
role of interface modification on ultimate properties”, Composite Interface, v. 92, n. 2, pp. 171-205, 2002.
[10] PAIVA, J.M.F., FROLLINI, E., “Unmodified and modified surface sisal fibers as reinforcement of phenolic and lignophenolic matrices composites: thermal analyses of fibers and composites”,
Macromolecular Materials Engineering, v. 291, pp. 405–417, 2006.
[11] MONTEIRO, S.N., INACIO, W.P., LOPES, F.P.D., COSTA, L.L., SANTOS JR., L.F.L., “Characterization of the critical length of sisal fibers for polyester composite reinforcement”, In:
Proceedings of Characterization of Minerals, Metals & Materials - TMS 2009 Conference, pp. 1-8,
San Francisco, USA, March 2009.
[12] MONTEIRO, S.N., SATYANARAYANA, K.G., LOPES, F.P.D., “High strength natural fibers for improved polymer matrix composites”, Materials Science Forum, v. 638-642, pp. 961-966, 2010. [13] NASCIMENTO, D.C.O., MOTTA, L.C., MONTEIRO, S.N., “Weibull analysis of tensile tested
piassava fibers with different diameters”, In: Proceedings of Characterization of Minerals, Metals
![Figure 1 : Components of a BMW sedan fabricated with lignocellulosic fiber reinforced polymer composites [5]](https://thumb-eu.123doks.com/thumbv2/123dok_br/18872605.420518/1.892.269.640.812.1059/figure-components-sedan-fabricated-lignocellulosic-reinforced-polymer-composites.webp)