Analysis of reinforced concrete structures through
the ultrasonic pulse velocity: technological parameters
involved
Análise de estruturas de concreto armado através
da velocidade de propagação do pulso ultrassônico:
estudo de parâmetros tecnológicos intervenientes
Abstract
Resumo
Application of Nondestructive Testing ( NDT) is an interesting strategy to monitor reinforced concrete structures conditions, especially when occur problems like admixture errors, mixing problems, conveying or placing of concrete . Among the NDT methods applicable to concrete, the Ultra-sonic Pulse Velocity has been used in various ields of civil engineering due to the ease of operation, low cost, test velocity and that using this test normally do not need repair the surface analyzed. This work aims to study the inluence that certain technological variables have on the results obtained through the UPV. Two concrete elements were cast at the laboratory. One element with reinforcement and another without reinforcement. Inside these elements were introduced objects to reproduce possible concrete damages. To facilitate the analysis the results are represent through several images generated by an image software and an statistical analysis software. This study conirm that the correct choice of test parameters is crucial to have a right interpretation.
Keywords: nondestructive testing, ultrasonic pulse velocity, reinforced concrete structures.
A aplicação de Ensaios Não Destrutivos (END) é uma estratégia interessante para monitorar o estado de conservação das estruturas de concreto armado, principalmente quando ocorrem erros de dosagem, problemas na mistura, transporte ou lançamento do concreto. Dentre os métodos de END, aplicáveis ao concreto, o método de ensaio da Velocidade de Propagação do Pulso Ultrassônico (VPU) vem sendo utilizado comumente em diversas áreas da Engenharia Civil, devido à facilidade da operação, ao seu baixo custo, à rapidez na execução dos testes e à ausência de danos ao material analisado. Este trabalho visa estudar a inluência que determinadas variáveis tecnológicas exercem sobre os resultados obtidos através dos ensaios de VPU. Foram moldados em laboratório dois elementos de concreto, com dimensões próximas a estruturas reais. Um elemento com armadura nas duas faces e outro sem armadura, nos quais foram introduzidos objetos para reproduzir possíveis falhas de concretagem. De modo a facilitar a análise dos dados, os resultados são apresentados por meio de imagens geradas através de programas computacionais e análises estatísticas. Através deste estudo veriicou-se que a escolha dos parâmetros de ensaios é fator crucial para que se tenha uma interpretação correta dos resultados.
Palavras-chave: ensaios não destrutivos, velocidade de propagaçao do pulso ultrassônico, estruturas de concreto armado.
a Universidade Federal do Rio Grande do Sul (UFRGS), Programa de Pós Graduação em Ciência e Tecnologias de Materiais (PPGEM), Laboratório de Ensaios e Modelos Estruturais
(LEME), Porto Alegre, RS, Brasil.
Received: 09 May 2015 • Accepted: 04 Aug 2016 •Available Online: 17 Apr 2017
D.S. ADAMATI a
A. LORENZI a
J. A. CHIES a
L.C.P. SILVA FILHO a
1. Introduction
The use of construction materials is intertwined with the proper his-tory of the civilization, because it was necessary to men to serve themselves to survive and to satisfy their necessities of shelter and comfort [1]. Many of the buildings in reinforced concrete which form the civil infrastructure are approaching the end of its useful life. Consequently, there is a growing concern about its state of decay and security [2]. In the current scenario, in which the efective prod-uct quality requirements are reinforcing, is of vital importance to the development of alternatives that allow, efectively, evaluate the quality “in loco” of concrete structures. The application of NDT, in this panorama, ends up being in an attractive and vital strategy to assess and monitor the condition and characteristics of important structures, especially when they fail, or sufer from errors of dosing, mixing, transport and release of concrete.
Amongst NDT methods used worldwide, which involves the mea-surement of the UPV is one of the most promising, for simplicity, low cost and good performance. In the literature there are many references to it, being common to description of curves of corre-lation that seek to correlate the UPV with compressive strength, since both these results are afected by the amount and size of existing voids in the material.
Exactly for this potentiality, the UPV has been the most investi-gated NDT in research in Structural Tests and Materials Laboratory of the Federal University of Rio Grande do Sul (LEME/UFRGS). In various research work conducted, on the ield and in the laboratory, a technique of UPV was developed, mapping with indirect read-ings, and conirmed that the method, when properly employed, can ofer ease of implementation, fast and suitable fault detection ca-pability [3, 4, 5, 6, 7, 8, 9]. Several researches related to UPV and concrete. To evaluate the degradation of mechanical properties of concrete and mortar [10], examined the inluence of the presence of reinforcement in estimating the depth of surface cracks [11], tested the ability of monitoring reinforced concrete structures [12], evaluated the relationship with compressive strength [13] and to generate sophisticated models for the same, with use of Artiicial Neural Network techniques [2].
Despite the contribution of information brought by these studies, doubts about the accuracy of the results, especially when they are necessary interpretations of data from ield tests, without stan-dardized conditions. This work has been designed aiming to help reduce existing doubts regarding the use and operation of the ul-trasound equipment in ield situations, despite many researches developed in laboratory, with test specimens, demonstrate a good ability to fault detection of concreting and estimation of compres-sive strength of concrete. This is because some variables will inter-fere with results, diinter-ferently, especially when used in elements with dimensions close to the real.
The objective proposed for the research is to study the inluence that some relevant technological variables exert on the results ob-tained through tests of UPV. The present work focuses on inding out what limitations of the UPV readings and what degree of inter-ference of the same on the results, when in real conditions. For the development of research, two concrete elements called wall 1 and wall 2 were shaped in laboratory, with dimensions close to real structures. One element is without reinforcement (wall 1) and the
other is with reinforcement on both sides (wall 2), in which objects were introduced to play possible failures of concrete.
The current standardization and articles do not express clearly and objectively the ability of fault detection and interpretation of the results obtained in the readings with the UPV tests, both ‘in situ’ as in lab environment. Therefore, it is necessary to carry out experiments that might generate correlation factors to enable and enhance the conidence of the UPV test results. Thus, this study seeks to mitigate issues concerning diferent technological vari-ables, providing a better understanding of the results obtained through the trials of UPV in concrete structures.
2. Nondestructive testing
NDT methods are those that do not cause damage to the element being tested or leave only small lesions that can be repaired easily after the test, not provoking, thus, signiicant loss of strength or per-formance of the element. In the case of new structures, these tests can be used for monitoring the strength evolution and to clarify doubts about the quality of the concrete. In existing structures, they aim to evaluate the integrity of the structure. According to Evangelista [14], there are some properties of concrete that can be evaluated with the use of NDT, among them we can mention: density, modulus of elas-ticity and compressive strength. The surface hardness, absorption, permeability, moisture conditions, the location of the reinforcement, the existence of gaps and cracking can also be investigated.
The TCS-17 document, from the International Atomic Energy Agency [15], points out several speciic situations associated with the civil construction, in which the use of NDT methods can be considered attractive:
n quality control in precast or construction in situ;
n removing uncertainties about the acceptability of the material
supplied owing to apparent non-compliance with speciication;
n conirming or negating doubt concerning the workmanship
in-volved in batching, mixing, placing, compacting or curing of concrete;
n monitoring of strength development in relation to formwork
removal, cessation of curing, prestressing, load application or similar purpose;
n location and determination of the extent of cracks, voids,
honey-combing and similar defects within a concrete structure;
n determining the concrete uniformity, possibly preliminary to core
cutting, load testing or other more expensive or disruptive tests;
n determining the position, quantity or condition of reinforcement
increasing the conidence level of a smaller number of destruc-tive tests;
n determining the extent of concrete variability in order to help in
the selection of sample locations representative of the quality to be assessed;
n conirming or locating suspected deterioration of concrete
re-sulting from such factors as overloading, fatigue, external or in-ternal chemical attack or change, ire, explosion, environmental efects;
n assessing the potential durability of the concrete; n monitoring long term changes in concrete properties;
n providing information for any proposed change of use of a
Kumar and Santhanam [16] claim that, today, the main objective of the use of NDT in construction is associated, in most cases, to the location and the importance of failures and defects in structures of hardened concrete. Valluzzi et al. [17], consider the application of these methods very useful for more complex diagnostic programs, as this allows identiication of regions where the presence of dei-ciencies is more likely. Breysse et al. [18] also point out that some performance loss or deterioration of the safety level of the material induces signiicant maintenance costs. According to Lorenzi [12], several of these test methods are eicient and accurate, among which the UPV test combines lexibility, low cost, great capacity for detection and good capability of providing concrete information, being a pretty method used for the analysis of concrete structures.
2.1 Factors involved in the propagation
of ultrasonic pulse velocity
The Brazilian standard NBR 8802 [19], prescribes that several fac-tors inluence on the results of determination of ultrasonic wave propagation velocity, highlighting the main ones:
The size and shape of the element does not afect the velocity of propagation. However, the equation used to calculate the velocity of ultrasound in solid material is valid only for ininite dimensions. This condition, in practice, is satisied if the side dimension of the element under consideration is, at least, equal to the wavelength of the trans-mitted pulse. Below this length, the accuracy of the results reduces. The pulse velocity are usually not afected by the wave path length, as long as it’s not too small. In this case, the heterogeneous nature of the concrete becomes important. Physical limitations on the time me-ter equipment can also introduce errors, in which small path lengths are involved. In previous studies, it was concluded that the measured velocity decreases with the increase in the wave path length. Several technical standards indicate special care with the sur-face of the concrete, in order to keep it smooth and clean, and to achieve the perfect coupling of the transducers in the concrete. Following the NBR 8802 [19] presents procedures in case of ne-cessity of settlement of the surface by mechanical process or with the use of cement paste, plaster or resin epoxy, in minimum thick-ness as possible.
According to Lorenzi et al. [12], very rough surfaces or the ones that have received any inish should be avoided, because the prop-erties of concrete in the main layer are not necessarily the same of its interior. For curved surfaces, Chung and Law [20], indicate the use of dry-point-of-contact transducers.
Studies by Hamassaki [21], Carcaño and Pereyra [22], indicate that the aggregate type variation afects the velocity of the pulse to concretes with compressive strength similar. In studies with the use of limestone gravel. Carcaño and Pereyra [22] found that measures of UPV values for a same level of compressive strength of concrete were higher for households who have better physical properties in terms of density, absorption and resistance to wear. In studies conducted about the inluence of the maximum size of coarse aggregate on UPV. Evangelista [14] found that, in a series of maximum diameter (Dmax) of 19 mm, the UPV 2.5% were 11% higher than the series with Dmax. = 9.5 mm, in which was kept the proportion of aggregates in the concrete series, in order to avoid any interference from the variation of the amount of aggregate.
Rodrigues e Figueiredo [23] also noted this efect in studies with concrete cylindrical speciments (15 cm x 30 cm), in which were produced two similar concrete using coarse aggregate with difer-ent densities. They concluded that the molded concrete with ag-gregate of higher density showed higher values of UPV than those framed with coarse aggregate of lower density. Elvery and Ibrahim [24] claim that the correlation between compressive strength and expressive inluence by UPV undergoes variations in quantity of aggregates in concrete due to the elastic modulus of the aggregate exceeds the value of the cement paste. With increased volume of aggregate in concrete, keeping the other parameters constant, the velocity of the pulse tends to be greater.
Some studies indicate that, in the irst 24 hours, the UPV in con-crete is inluenced by the cement type. However, in his study with concretes with ordinary portland cement (CP III) and high initial resistance (CP V), there are no diference was observed between the values of the UPV in tests aged three or more days [14]. According to Costa [25], there are some factors that can interfere with the result of the test, including the nature of couplant material. It should be understood as couplant the materials that apply to areas of transducers before putting them in contact with the con-crete. Its function is to promote the homogenization of the concrete surface, which will receive the transducers and prevent the pen-etration of air during the test.
Because the ultrasound machine does not have automated use, and depends on the human sensitivity, the NM 58:1996 [26] points out that the test must be carried out by experienced personnel in the application of this technique. The work plan, the analysis and interpretation of results shall be carried out by responsible and qualiied professional.
In case of the concrete do not present any reinforcement, cracks or voids, sound waves travel the shortest path. If there are rein-forcement located parallel to the path of the waves, depending on the proximity of the transducers, the waves can use part through concrete and part through the steel [14].
According to Naik et al. [27], in reinforced concrete the pulse ve-locity is higher than that of simple concrete of same composition, reaching a value around 40% to 70% higher, approaching the or-der of 5900 m/s in steel, to a solid medium and ininity. Medeiros [28], asserts that steel bars parallel to the direction of the readings with the ultrasound by indirect transmission mode can inluence the results of UPV tests. The presence of faults, cracks or voids within concrete cause the obstruction of incident wave propaga-tion path, moving it through the outskirts of the defect, resulting in longer propagation. This efect can be used to locate defects larger than 100 mm in diameter or depth, since minor defects do not usu-ally cause signiicant efects on the propagation time [29].
3. Materials e methods
In order to identify and quantify the inluence of certain variables on the results of UPV, the experimental program searched to inquire how these tests on two elements made of concrete behave (called walls 1 and 2), inside of which were introduced voids (concrete fail-ures) artiicially (Figure 1). The development of the research took place at the Structural Tests and Materials Laboratory of the Fed-eral University of Rio Grande do Sul (LEME/UFRGS), involving the use of a sample set shaped and evaluated by the technical team of the lab. For the production of these elements, materials were used with speciic features, described below.
3.1 Molds
To make the molds, plywood laminated was used, in order to rep-resent a real structure. It was decided to produce the molds hori-zontally, facilitating the concreting of the elements. On the surface in contact with the compensated, a suiciently smooth face was gotten, simulating surfaces like curtains, slabs, pillars and beams. On the other side, which was unwarped, a rough surface, which simulates foundation blocks, loors and any surface that does not present an ideal inish for readings with ultrasound. Figures 2 (a) and (b) illustrate, respectively, the molds without reinforcement and with reinforcement, used for making up the walls.
The dimensions were deined in 1.70 m x 1.70 m x 0.60 m, thus en-abling diferent distances between transducers, since small read-ings until the maximum distance possible for an operator to get work ergonomically correct.
The molds have a depth of 60 cm, in order to simulate robust ele-ments, making it possible to evaluate the ability of ultrasound ma-chine to intercept failure of concrete at diferent depths.
3.2 Concrete
Concrete was dosed in central batching plant, transported via
mixer truck to make walls. The characteristic resistance to com-pression (fck) was set at 30 MPa, for being a fairly usual resistance in many construction sites.
3.3 Reinforcement
Most concrete structures have reinforcement. So, in order to evalu-ate the inluence of these on UPV readings, two steel meshes were
Figure 1
Position of styrofoam balls
Figure 2
(a) wall without reinforcement (b) wall with reinforcement
used, with density of relatively high reinforcement, composed of structural steel bars of type CA-50 12.5 mm diameter, and spacing of 15 cm.
3.4 Voids
The presence of voids causes the delay of waves, because of the low velocity of sound in air. The interpretation is based on the fact that the time of propagation of ultrasonic pulses can be correlated with the density of the material.
To represent the existence of voids and failures of concrete, styrofoam balls were used with dimensions varying between 5, 10 and 15 cm, in diferent positions within the walls. The use of styrofoam is justiied because of its density, which is quite lower than the concrete, not allowing the penetration of cement paste inside. All the styrofoam balls were ixed with nylon cord, so that each one remains on its place, avoiding the interference of one over the other.
3.5 Concreting of elements
A vibrator needle type was used to concrete. The launch time of concrete was 2 hours. Due care was taken to avoid the displace-ment of voids (styrofoam balls). In igures 3 (a) and (b) are pre-sented, respectively, the concreting of the element without rein-forcement and the concreting of the element with reinrein-forcement. At the time of concreting, temperature and moisture conditions were 13 C and 70% humidity. After the release of total concrete, the elements remained stored inside the lab, in a covered place, well ventilated and no exposure to weather direct action.
3.6 Inluence of technological variables in the tests
There are several variables that inluence the NDT results for con-crete in determining the UPV. For this research, technological vari-ables chosen are as follows:
3.6.1 Transducers distance
In the tests to determine the UPV, measurements are performed with the variation of the distance between the transducers (grid). Considering the distances between the various measuring points in the tests, carried out with the use of the method of indirect read-ing, sought to identify whether there is a correlation between the mesh reinement and the ability of voids detection through the UPV method. For this, we used, distances of 25, 50 and 75 cm.
3.6.2 Reinforcement presence
It was sought to verify the inluence reinforcement in these essays and quantify it.
3.6.3 Operators
Due to the fact the NBR 8802 [19] indicate that the coupling and the pressure between the surfaces of the transducers must be consid-ered satisfactory, we analyzed the inluence of using the ultrasound machine with two operators. These was doing to identify if there is diference between the pressures applied by each operator, whereas UPV tests still depend on the human operation, not being automatized tests. Large structures require several operators running measure-ments simultaneously, since there is a large number of points needed, what justiies this analysis.
3.6.4 Surface conditions
In the blocks, it was formed a smooth surface and other rough, to analyze what is the inluence of this variable in both walls.
3.7 Reading processes
To start the UPV readings, it was expected the minimum time of 28 days since the concreting, so as to minimize the inluence of the variation of
re-Figure 3
(a) concrete molds without reinforcement and (b) concrete molds with reinforcement
sistance of concrete in the UPV measures. Indirect readings were made as NBR 8802 guidelines [19]. For the coupling of transducers, it was used gel. In Figure 4, are shown the combinations of the readings performed. According to the process of readings presented, the two walls with horizontal, vertical and diagonal readings around each point have been mapped. These readings were grouped
to-gether, creating what’s called reading quadrants.
At the time of carrying out the tests, predetermined points were used to locate accurately on a map, how long the wave takes to traverse the path between the transmitter-transducer and the transducer-receiver in accordance with their respective coordinate on the structure analyzed. Figure 5 shows how to
Figure 4
Reading processes
Figure 5
obtain a set of reading positioned from a selected grid. With the UPV values obtained, velocity variations were mapped graphically through computer image generator program. Later, sta-tistical analysis are suitable was performed for the validation of the method.
4. Result analysis
The analysis of results obtained from the tests will be presented. Initially, the results of axial compressive strength tests performed on the control specimens are presented. Then, are highlighted the results regarding questions about technological variables, which are divided into efects of grid size, the presence of reinforcement,
the operator and the supericial roughness. In the end, the interfer-ence that the presinterfer-ence of faults in the concrete, possibly gener-ated in the results.
4.1 Axial compressive strength of
bodies-of-proof control
For the control of the concrete used on the walls, were tested 6 bod-ies-of-evidence of 10 x 20 cm for each block. The result of compres-sive strength reached average value of 50 Mpa, with a coeicient of variation of 5%. As can be seen, the concrete obtained superior resistance to fck speciied, which was 30 MPa. However, the results obtained, even diferent speciication, did not hamper the search.
Figure 6
(a) 75 x 75 cm Grid (b) Grid 50 x 50 cm and (c) Grid 25 x 25
Figure 7
4.2 Analysis of the efect of technological
variables studied
The UPV readings were initiated to 28 days after the concreting and lasted about a week. Initially, many data were taken, so that it could be evaluated the efect of each of the technological variables selected for the study. In Figures 6, 8, 10, 12 and 14 it is possible to see clearly the hottest regions (in red), which indicate lower values of UPV, and colder regions (in blue), which indicate UPV zones with higher values. To allow the comparison between two concrete elements used in this research, the variables were analyzed from the results ob-tained by the experienced operator (presence of reinforcement, roughness and presence of failures). Except in this case the opera-tor variable, which was performed by two diferent operaopera-tors, one with experience in testing and another in training phase.
4.2.1 Grid size
As discussed in item 3, three mesh spacing were used to deter-mine changes in the type of response obtained through the map-ping of the data in relation to the defect identiication. In Figures 6 (a), (b) and (c), can be veriied, respectively, the images generated in grid of 75 cm, 50 cm and 25 cm, which were held on the wall without reinforcement and on a smooth face. In the grid of 25 cm is gotten a total of 120 readings, on the grid of 50 cm, 33 readings, and 75 cm grid, 20 readings, all indirect ones.
As it can be seen, the image generated with 25 cm reading grid enabled better representation of diferent regions, more deined regions when compared to images obtained with readings of 50 cm and 75 cm. In this way, to the analysis of the efects of diferent variables it was used the grid of 25 cm reading.
The UPV values obtained were between 4300 and 4800 m/s, cor-responding to concretes of excellent quality. In general, the choice of the grid signiicantly inluences the interpretation of possible re-gions committed to a massive concrete. However, this interpreta-tion and the choice of grid are strongly related to the magnitude of the problem to be found. More reined grids have the ability to
de-tect more sensible defects. When the diagnosis of a structure is the most signiicant extension search, less reined grids are already suicient and facilitate both the execution of the tests and their analyses. To highlight the diferences between grids presented in Figure 6, a statistical analysis was performed through variance (ANOVA), with the aim of comparing the UPV obtained for the dif-ferent grids. Figure 7 graphically presents the results obtained. It is possible to observe that the analysis gives us a probability close to zero (with a signiicance level of 95%), showing that the diferences of UPV are signiicant, when you change the distance between the transducers. With the increase in the grid, it shows a tendency of reduction of the UPV, independent of the presence or absence of reinforcement. This result highlights the importance of maintaining the same distance between transducers, when carried out a survey of the homogeneity of a concrete structure. The mix-ing of distances within the same structure is not indicated, since it can put at risk the analyses, and may generate wrong interpreta-tions, from velocity reduction with increasing distance, and not a region necessarily suspect.
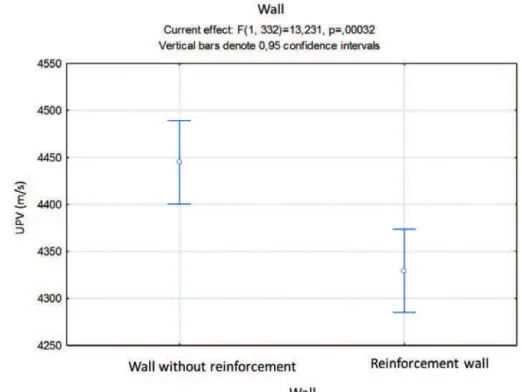
4.2.2 Presence of reinforcement
Although several authors have studied the inluence of the pres-ence of reinforcement in the UPV, the diferential of this study is to present elements in size and very close to those used daily in construction sites.
Figures 8 (a) and (b) are, respectively, the images generated from reinforcement walls and walls without presence of reinforcement. Analyzing visually the images, it is possible to see some difer-ences in coloration. These diferdifer-ences, although represent only a sharp reduction, are signiicant in the average of the velocity ob-tained with presence of reinforcement.
This behavior is not only contrary to what some authors claim, but is also contrary to the initial hypothesis of this research. About the homogeneity of the walls, the presence of reinforce-ment does not harm the interpretation of images, since the map-ping of regions with diferent velocity was similar in both settings.
Figure 8
Figure 9 presents the statistical analysis that evaluates the sig-niicance of the presence of reinforcement in the analysis of UPV. It can be observed in the chart above, a slight tendency for the ve-locity on the wall without reinforcement being larger than on the wall with the presence of reinforcement. When all data were subjected to statistical analysis, the presence of reinforcement used led to sig-niicant changes in UPV, reduced UPV with 95% signiicance level.
4.2.3 Operator
A comparisons concerning the use of the ultrasound machine for
diferent operators was also held. This factor is relevant, because the ield analyses demand often several operators working simul-taneously. Figure 10 shows two images generated from velocity of two operators, one with experience in previous works and another on training phase, Figure 9 (a) and (b). Both readings were per-formed on the wall without presence of reinforcement.
Analyzing Figure 9, it can observed that when the readings are made by experienced operator, the image shows more regular, both in colors as the average of the velocity. In the case of the inexperienced operator, were generated lower velocity and regions that could be interpreted as having problems inside the concrete.
Figure 9
Influence of the presence of reinforcement
Figure 10
To prove this fact, Figure 10 presents the statistical analysis made from all velocity obtained by each of the operators in analysis of the same wall.
The analysis of Figure 11 proves exactly what had already been checked in the interpretations of the images generated by the com-puter program, in which the inexperienced operator obtained ve-locity signiicantly below those of experienced operator, generating diferences in average of 300 m/s. From this, it is possible to con -clude that it is of the utmost importance, for future work in the ield, the training team that will perform these jobs. This training should
not be limited only to the team that will run the test, but must con-template, as well, the team that will interpretate the results. As it can be seen, the lack of training of a professional can compromise the analysis of a structure, or part of it, by condemning it, even if this, in fact, is in perfect condition.
4.2.4 Supericial roughness
Another test parameter studied was the roughness of the sur-face available for UPV readings. Two diferent roughness were
Figure 11
Influence of different operators
Figure 12
studied, one favourable for tests for been smooth, and the oth-er with enough roughness, howevoth-er, more found in situations of in situ inspections. Figures 12 (a) and (b) show the inluence of smooth and rough surfaces, respectively.
It can be observed that the readings performed by a single opera-tor, in the same structure, but with diferent surface roughness, are signiicantly diferent. With the image generated from the velocity
obtained in rough surface, it can be concluded that this setting nul-liies any interpretation, due to any noise caused by these irregu-larities in the propagation of UPV. Figure 13 presents graphically the proof of this efect.
It can be concluded, from the chart, that the roughness on the surface of the concrete inluences signiicantly the UPV values, decreasing them. It is concluded that, in situations where readings
Figure 13
Influence of different surfaces
Figure 14
are made under these conditions, it is imperative that the regu-larization of the parsed structure, by means of mechanical wear, especially at the points where the transducers come into contact with the surface.
4.3 Identiication of possible failures
Regarding the location of voids inside the concrete, one of the sev-eral variables studied, Figure 14 presents the image obtained by combination of parameters that showed greater ability to detect voids. The image presented is the result of the analysis of a wall without reinforcement, tested by a skilled operator, in a grid of 25 cm and smooth face.
It is evidenced that there is a region with velocity below the overall average, exactly in the center of the wall, where it was introduced a considerable void, compared to the size of the analyzed element, represented in Figure 14 for void 1. Due to the size of the void (15 cm), regions above and below it had afected UPV readings, as can be seen.
The advantage of using a iner grid is exactly the location closely to the defects. Minor defects can also be located through this setting, but not with the same accuracy that occurs with the void 1, located in the center. This is the case of the voids 3 and 4, in which the im-age shows areas with lower averim-age velocity, even though the sty-rofoam balls have been displaced from its original position during concreting. The void 5 was identiied with precision, although the image shows not clearly this diference in velocity. The void 2 was the only defect that the method failed to detect, probably through a combination of reduced size and depth it was in. Despite some uncertainties, the analysis by generating images indicates some trends similar to those that would have been produced during the investigation of a real structure.
In that way, there is the guarantee that, with the support of the appropriate tool to perform the analysis, it is possible to see the concrete areas in which there are diferences in uniformity. How-ever, it must be taken into account the size of the concrete surface that will be analyzed, to determine the size of the meshed test to the size of the surface and the magnitude of the heterogeneities to be located. With this investigation, it becomes feasible to infer the detection capability of heterogeneities in the concrete of actual structures, through the use of UPV, combined with the generation of a suitable software, conirming thus the potential use of UPV in the case of inspection of structures.
5. Conclusions
This work aimed to analyze the inluences that various parameters produced in the test results of UPV. In these trials, were veriied as operational variables: diferences of grids, operators with diferent experience levels, diferent surfaces, and the presence or absence of reinforcement.
Analyzing and comparing the results obtained from tests, it can be concluded that:
n the choice of a reading grid will depend on the size of the
ele-ment and the signiicance of the size of the defect in its interior. In the situation under consideration, the size of the grid had signiicant inluence on the readings, and the more reined grid
(25 cm) presented the best results regarding average velocity and the interpretation of images.
n it was found that the presence of reinforcement changed
signii-cantly the average velocity obtained by reducing velocity, being in disagreement with what has been published by many authors.
n the operator’s experience proved to be the most important and
signiicant variable in the analysis, since the lack of training can lead to erroneous interpretations, in order that the operator is essential to the carrying out of the trials.
A careful choice of parameters enables complete interpretation of the quality of concrete structures. For the localization of voids, the composition of the wall parameters without reinforcement, smooth face, grid 25 cm and experienced operator was that one that pre-sented in more clear and objective regions, in fact, contained de-fects inside.
The UPV test presents several advantages for the assessment of structures. However, the choice of test parameters is the key factor for a correct interpretation and without mistakes. It is important to note that all the conclusions reached at this work relate exclusively to the studied element.
Physically, there must be a relation between compactness and re-sistance to compression. The complex and heterogeneous nature of the concrete makes the modeling of the relation an arduous task. A large number of variables, potentially, afect the compactness results correlation, obtained via ultrasonic pulse, and compressive strength of concrete. The analysis of the data obtained by UPV allows to obtain parameters for assessing the characteristics of concrete structures. The crucial point to use the UPV for analysis of concrete structures is the interpretation of the results obtained. The lack of knowledge about the real situation in which a structure is, is a complicating factor when interventing damaged structures or under suspicion. The lack of information in a situation of emergency character, can make conservative decisions, increasing the scope and complexity of the interventions envisaged, increasing costs or generating additional disorders to its users. The use of the UPV may assist in decision making and establishing intervention strategies. In general, the case studies reinforce the idea that the use of UPV are useful tools for the analysis of structures. It is conirmed the idea that they have great potential for use in the case of inspection of structures. Its usage allows to get important information to the characterization of the concrete, as well as data on the uniformity and quality of the structure.
This study indicates that UPV tests are sensitive tools to variations of uniformity and density, and can therefore provide important data for decision making regarding the concrete structures. Upon the execution of UPV tests it is possible to contribute to the control of the quality of concrete structures. In this way, it can be inferred that the UPV application is very useful for mapping studies of variations of homogeneity of a structure.
References
[1] ISAIA, G.C., O Concreto: da Era Clássica à Contemporânea. In: ISAIA, G. C. (Editor), Concreto: Ensino, Pesquisa e Real-izações. São Paulo: IBRACON, 2005. cap.1, vol.1, p.1-44. [2] LORENZI, A. Aplicação de redes neurais artiiciais para es
da velocidade de propagação do pulso ultra-sônico, Porto Alegre, 2009, Tese (doutorado) – Programa de Pós-Grad-uação em Engenharia Civil, Universidade Federal do Rio Grande do Sul. Escola de Engenharia, 196p.
[3] LORENZI, A.; CAETANO, Luciane Fonseca ; CAMPAG-NOLO, João Luiz ; SILVA FILHO, Luiz Carlos Pinto da . An investigation of the suitability of diferent NDT test methods to detected voids of concrete elements. E-Journal of Nonde-structive Testing and Ultrasonics, v. 14, p. ID 7698, 2009. [5] LORENZI, A.; SILVA FILHO, Luiz Carlos Pinto da ;
CAM-PAGNOLO, João Luiz ; STRIEDER, Adelir Jose ; QUININO, Uziel Cavalcante de Medeiros ; CAETANO, Luciane Fon-seca . Estudos de caso sobre avaliação de estruturas de concreto através da utilização de ensaios não destrutivos. Revista ALCONPAT, v. 1, p. 188, 2011.
[6] LORENZI, A.; SILVA FILHO, Luiz Carlos Pinto da ; CAM-PAGNOLO, João Luiz ; CAETANO, Luciane Fonseca . Ana-lyzing two diferent data processing strategies for monitoring concrete structures using ultrasonic pulse velocity. Revista ALCONPAT, v. 2, p. 192, 2012.
[7] LORENZI, A.; SILVA FILHO, L. C. P. ; CAETANO, Luciane Fonseca ; CHIES, J. A. . Investigation of the Potential for Evaluation of Concrete Flaws Using Nondestructive Testing Methods. ISRN Civil Engineering, v. 2014, p. 1-8, 2014. [8] LORENZI, A.; CAETANO, Luciane Fonseca ;
CAMPAGNO-LO, João Luiz ; LORENZI, L. S. ; SILVA FILHO, L. C. P. . Application of Ultrasonic Pulse Velocity to Detect Concrete Flaws. E-Journal of Nondestructive Testing and Ultrasonics, v. 11.2015, p. 18430, 2015.
[9] CHIES, J. A. ; ADAMATTI, D. S. ; LORENZI, A. ; SILVA FIL-HO, L. C. P. . Detecção de Falhas em Estruturas de Con-creto através de Ensaios Ultrassônicos. In: 57° Congresso Brasileiro do Concreto, 2015, Bonito. Anais do 57° Congres-so Brasileiro do Concreto. São Paulo: IBRACON, 2015. [10] NOGUEIRA, C. L., Ensaios Não Destrutivos: Novas
Ferra-mentas para Inspeção de Obras Públicas. In: VI SINAOP – VI SIMPÓSIO NACIONAL DE AUDITORIA EM OBRAS PÚBLICAS. Anais... ,Florianópolis: 2001.
[11] MEDEIROS, A., PADARATZ, I.J., PINTO, R.C.A., Inluência da Presença de Armaduras na Estimativa da Profundidade de Fissuras Supericiais em Concreto Armado através do Ul-tra-som. In: CONGRESSSO BRASILEIRO DO CONCRETO (COBRACON 2009), 51, 2009, Curitiba. Anais..., São Paulo: Instituto Brasileiro do Concreto, 2009. 14p. 1 CD-ROM. [12] LORENZI, A.., SILVA FILHO, L.C.P., CAETANO, L.F,
LO-RENZI, L.S., Monitoramento de Estruturas de Concreto através de Ensaios de Velocidade de Propagação do Pulso Ultra-sônico. In: CONGRESSSO BRASILEIRO DO CON-CRETO (COBRACON 2009), 51, 2009, Curitiba. Anais..., São Paulo: Instituto Brasileiro do Concreto, 2009. 13p. 1 CD-ROM.
[13] BARBOSA, M.T.G., MENDES, L.O., COURA, C.G., Re-sistência à Compressão do Concreto x Velocidade de Propagação de Pulso Ultrasônico – Estudo de Caso. In: CONGRESSSO BRASILEIRO DO CONCRETO (COBRAC-ON 2009), 51, 2009, Curitiba. Anais.... São Paulo: Instituto Brasileiro do Concreto, 2009. 16p. 1 CD-ROM.
[14] EVANGELISTA, A. C. J., Avaliação da Resistência do Con-creto usando Diferentes Ensaios Não Destrutivos. 2002. 219p. Tese (Doutorado) – Programa de Pós-Graduação em Engenharia da Universidade Federal do Rio de Janeiro. Uni-versidade Federal do Rio de Janeiro, Rio de Janeiro, 2002. [15] INTERNATIONAL ATOMIC ENERGY AGENCY.
IAEA-TCS-17: Guidebook on Non-Destructive Testing of Concrete Structures. Viena: 2002, 231 p.
[16] KUMAR, S. A., SANTHANAM, M., Detection of Concrete Damage Using Ultrasonic Pulse Velocity Method. In: NA-TIONAL SEMINAR ON NON-DESTRUCTIVE EVALUA-TION, 2006, Hyderabad. Proceedings…. Hyderabad: Indian Society for Non-Destrctive Testing. Disponível em: <http:// www.ndt.net> . Acesso em: 18/07/2007.
[17] VALLUZZI, M. R., DA PORTO, F., CASARIN, F., MON-TEFORTE, N., MODENA, C., A Contribution to the Char-acterization of Masonry Typologies by using Sonic Waves Investigations. In: NON-DESTRUCTIVE TESTING IN CIVIL ENGINEERING (NDTCE’09), 2009, Nantes. Procedings.... Paris: Confédération Française por lês Essais Non Desc-tructifs, 2009. 6p.
[18] BREYSSE, D., SOUTSOS, M., FELICETTI, R, KRAUSE, M., LATASTE, J., MOCZKO, A., How to improve the quality of concrete assessment by combining several NDT measure-ments. In: NON-DESTRUCTIVE TESTING IN CIVIL ENGI-NEERNG (NDTCE 2009), 2009, Nantes. Proceedings.... Paris: Confédération Française pour les Essais Non De-structifs, 2009. Disponível em: <http://www.ndt.net>. Acesso em: 18 ago. 2013.
[19] ASSOCIAÇÃO BRASILEIRA DE NORMAS TÉCNICAS - ABNT. NBR 8802: Concreto Endurecido – Determinação da Velocidade de Propagação da Onda Ultra-sônica: Método de Ensaio. Rio de Janeiro: 2013.
[20] CHUNG, H. W., LAW, K.S., Diagnosing in situ Concrete by Ultrasonic Pulse Technique. Concrete International. [s.l.], n. 05, p.42-49, 1983.
[21] HAMASSAKI, L. T., Utilização do ultra-som em concreto. 1986. 108p. Dissertação (Mestrado em Engenharia Civil) – Escola Politécnica. Universidade de São Paulo, São Paulo, 1986.
[22] CARCAÑO, R. S; PEREYRA, J.B. The inluence of the phys-ical properties of aggregates on the ultrasound pulse thec-nique in predicting the compressive strength of concrete. Rev. Téc. Ing. Univ. Zulia, Vol. 26, No. 1, 2003.
[23] RODRIGUES, G. S. S.; FIGUEIREDO, E. I. P. Módulo de deformação do concreto pelo método ultrassônico; Estudo da Correlação. In: 46º Congresso Brasileiro do Concreto, Florianópolis, 2004. Anais..., IBRACON, Florianópolis, 2004, pp. II 1309-1324.
[24] ELVERY, R. H.; IBRAHIM, L. A. M. Ultrasonic assessment of concrete strength at early ages. Megazine of Concrete Research, Dec., 1976, pp 181-190.
[26] COMITÉ MERCOSUL DE NORMALIZACION, NM 58: Hormigón endurecido – Determinación de la velocidad de propagación de pulsos ultrasónicos. São Paulo: 1996. [27] NAIK, T. R.; MALHOTRA, V. M.; POPOVICS, J. S., The
Ul-trasonic Pulse Velocity Method, CRC handbook on nonde-structive testing of concrete, Tarun R. Naik and V M Malhotra eds, CRC Press, pp 169-189, 2004.
[28] MEDEIROS, A. Aplicação do ultra-som na estimativa da pro-fundidade de fendas supericiais e na avaliação da eicácia de injeções em elementos de concreto armado. Dissertação de Mestrado em Engenharia Civil da Universidade Federal de Santa Catarina. Florianópolis, 2007.