Universidade de Aveiro 2011
Departamento de Engenharia Cerâmica e do Vidro
Kiryl Yasakau
Protecção activa de corrosão na liga AA2024 por
revestimentos sol-gel com inibidores de corrosão
Active corrosion protection of AA2024 by sol-gel
coatings with corrosion inhibitors
Universidade de Aveiro 2011
Departamento de Engenharia Cerâmica e do Vidro
Kiryl Yasakau
Protecção activa de corrosão na liga AA2024 por
revestimentos sol-gel com inibidores de corrosão
Active corrosion protection of AA2024 by sol-gel
coatings with corrosion inhibitors
Dissertação apresentada à Universidade de Aveiro para cumprimento dos requisitos necessários à obtenção do grau de Doutor em Ciência e Engenharia de Materiais, realizada sob a orientação científica do Doutor Mário Guerreiro Silva Ferreira, Professor Catedrático do Departamento de Engenharia Cerâmica e do Vidro da Universidade de Aveiro, e do Doutor Mikhail Zheludkevich, Investigador Auxiliar da Universidade de Aveiro.
Apoio financeiro da FCT, referência SFRH/BD/25469/2005, e do FSE no âmbito do III Quadro Comunitário de Apoio
Dedicated to my mother Elena and to the memory of my grandmother Liliana for their immense love and care
o júri
presidente Prof. Doutor Domingos Moreira Cardoso
professor catedrático do Departamento de Matemática da Universidade de Aveiro
Prof. Doutor Mário Guerreiro Silva Ferreira
professor catedrático do Departamento de Engenharia Cerâmica e do Vidro da Universidade de Aveiro
Doutor Mikhail Zheludkevich
investigador auxiliar do Departamento de Engenharia Cerâmica e do Vidro da Universidade de Aveiro
Prof. Doutor Christopher Michael Ashton Bret
professor catedrático do Departamento de Engenharia Química da Faculdade de Ciências e Tecnologia da Universidade de Coimbra
Prof. Doutor Fernando Manuel Bico Marques
professor catedrático do Departamento de Engenharia Cerâmica e do Vidro da Universidade de Aveiro
Doutora Maria de Fátima Grilo da Costa Montemor
investigadora auxiliar do Departamento de Engenharia Química e Biológica do Instituto Superior Técnico da Universidade Técnica de Lisboa
Prof. Doutor Herman Terryn
agradecimentos
I would like to express sincere gratitude to my research advisors Dr. Mikhail Zheludkevich and Professor Mário Ferreira for inviting me in Portugal, their help, guidance and advises during my PhD studies.
I address many thanks to Dr. Syargei Poznyak and Dr. Sviatlana Lamaka for their help with the experimental work, guidance, interesting and motivating discussions. I acknowledge Dr. Dmitry Shchukin, Dr. Dominik Raps and Dr. M. Wittmar for providing materials for experiments and performing the
measurements.
I am particularly thankful to my colleagues and friends Dr. Alexandre Bastos, Dr. Ricardo Serra, Dr. Joao Tedim and Dr. Silvar Kalip, Dr. Alexei
Yaremchenko, Dr. Aliaksandr Shaula, Tatiana Zheludkevich, Olga Karavai, Aleksey Lisenkov who helped in my work.
Many thanks go to people in Ceramics department that assisted and helped me during all those years. I personally thank Célia, Marta, Agusto for helping me with experiments; many thanks to Luísa, Alexandra, Paula, Sophia, Carla from secretary of Ceramics department. I wish to thank Flávia Almeida for her support and advices. I also thank other people in department that I dare not mention.
Professor George Thompson and Dr. Igor Molchan are gratefully acknowledged for the help and support during my visit in Manchester University.
palavras-chave AA2024, pré-tratamento, sol-gel, corrosão, protecção activa, auto-reparação, inibidor, EIS, SKPFM, SVET
resumo A indústria aeronáutica utiliza ligas de alumínio de alta resistência para o fabrico dos elementos estruturais dos aviões. As ligas usadas possuem excelentes propriedades mecânicas mas apresentam simultaneamente uma grande tendência para a corrosão. Por esta razão essas ligas necessitam de protecção anticorrosiva eficaz para poderem ser utilizadas com segurança. Até à data, os sistemas anticorrosivos mais eficazes para ligas de alumínio contêm crómio hexavalente na sua composição, sejam pré-tratamentos, camadas de conversão ou pigmentos anticorrosivos. O reconhecimento dos efeitos carcinogénicos do crómio hexavalente levou ao aparecimento de legislação banindo o uso desta forma de crómio pela indústria. Esta decisão trouxe a necessidade de encontrar alternativas ambientalmente inócuas mas igualmente eficazes.
O principal objectivo do presente trabalho é o desenvolvimento de
pré-tratamentos anticorrosivos activos para a liga de alumínio 2024, baseados em revestimentos híbridos produzidos pelo método sol-gel. Estes revestimentos deverão possuir boa aderência ao substrato metálico, boas propriedades barreira e capacidade anticorrosiva activa. A protecção activa pode ser alcançada através da incorporação de inibidores anticorrosivos no pré-tratamento.
O objectivo foi atingido através de uma sucessão de etapas. Primeiro
investigou-se em detalhe a corrosão localizada (por picada) da liga de alumínio 2024. Os resultados obtidos permitiram uma melhor compreensão da
susceptibilidade desta liga a processos de corrosão localizada. Estudaram-se também vários possíveis inibidores de corrosão usando técnicas
electroquímicas e microestruturais.
Numa segunda etapa desenvolveram-se revestimentos anticorrosivos híbridos orgânico-inorgânico baseados no método sol-gel. Compostos derivados de titania e zirconia foram combinados com siloxanos organofuncionais a fim de obter-se boa aderência entre o revestimento e o substrato metálico assim como boas propriedades barreira. Testes industriais mostraram que estes novos revestimentos são compatíveis com os esquemas de pintura
convencionais actualmente em uso. A estabilidade e o prazo de validade das formulações foram optimizados modificando a temperatura de armazenamento e a quantidade de água usada durante a síntese.
As formulações sol-gel foram dopadas com os inibidores seleccionados durante a primeira etapa e as propriedades anticorrosivas passivas e activas dos revestimentos obtidos foram estudadas numa terceira etapa do trabalho. Os resultados comprovam a influência dos inibidores nas propriedades anticorrosivas dos revestimentos sol-gel. Em alguns casos a acção activa dos inibidores combinou-se com a protecção passiva dada pelo revestimento mas noutros casos terá ocorrido interacção química entre o inibidor e a matriz de sol-gel, de onde resultou a perda de propriedades protectoras do sistema combinado.
Atendendo aos problemas provocados pela adição directa dos inibidores na formulação sol-gel procurou-se, numa quarta etapa, formas alternativas de incorporação. Na primeira, produziu-se uma camada de titania nanoporosa na superfície da liga metálica que serviu de reservatório para os inibidores. O revestimento sol-gel foi aplicado por cima da camada nanoporosa. Os
inibidores armazenados nos poros actuam quando o substrato fica exposto ao ambiente agressivo. Numa segunda, os inibidores foram armazenados em nano-reservatórios de sílica ou em nanoargilas (halloysite), os quais foram revestidos por polielectrólitos montados camada a camada. A terceira alternativa consistiu no uso de nano-fios de molibdato de cério amorfo como inibidores anticorrosivos nanoparticulados. Os nano-reservatórios foram incorporados durante a síntese do sol-gel. Qualquer das abordagens permitiu eliminar o efeito negativo do inibidor sobre a estabilidade da matriz do sol-gel. Os revestimentos sol-gel desenvolvidos neste trabalho apresentaram
protecção anticorrosiva activa e capacidade de auto-reparação. Os resultados obtidos mostraram o elevado potencial destes revestimentos para a protecção anticorrosiva da liga de alumínio 2024.
keywords AA2024, pretreatment, sol-gel, corrosion, active protection, self-healing, inhibitor, EIS, SKPFM, SVET
abstract The aerospace industry employs high strength aluminum alloys as a constructional material for aircrafts. Aluminum alloys possess advanced mechanical requirements, though suffer from corrosion. Therefore, corrosion protection is always used for aluminum alloys. Up to now the most effective corrosion protection systems include chromium (VI) as the main constituent of pretreatments and corrosion inhibitive pigments. However, the chromates are strongly carcinogenic and the present health regulations banned the use of Cr (VI) containing materials in industry. Consequently, there is a need for
environmentally safe corrosion protection systems.
The main objective of the present work is the development of active anti-corrosion pre-treatments for 2024 aluminum alloy on the basis of hybrid sol-gel layers. The effective corrosion pre-treatment should confer adequate adhesion together with good barrier properties and active corrosion protection ability. The active corrosion protection can be achieved by introducing the corrosion inhibitors in the pre-treatment.
Successful fulfilment of the main objective required accomplishing of different stages of the work. At first the localized corrosion of AA2024 was investigated in detail. The obtained results provide better understanding of the intimate aspects of the corrosion susceptibility of AA2024. Different prospective
corrosion inhibitors were investigated using electrochemical and microstructural methods.
At the second stage the development of hybrid sol-gel coatings was performed. Titania and zirconia based derivatives were combined with organofunctional silanes in order to provide the enhanced adhesion between the metal and the coating and to confer good barrier properties. Industrial tests show that the developed sol-gel coatings are compatible with common organic protection systems. The stability and life time of the sol-gel formulations were also
optimized by changing the storage temperature and the amount of water during the synthesis.
Sol-gel systems were doped with the selected corrosion inhibitors and studied from the point of view of passive and active corrosion protective properties at the third stage of the work. The results demonstrate the influence of the inhibitive additives on the corrosion performance of the sol-gel coatings. Some inhibitors can provide active corrosion protection in combination with the sol-gel coating, but some chemically interact with the sol-gel matrix resulting in failure of the protective properties of coatings.
New approaches of inhibitor incorporation and delivery were used in the fourth stage of the work due to problems associated with the direct introduction of inhibitors in the sol-gels. A nanoporous titania-based pre-layer applied directly to the alloy was employed for storage and release of inhibitors. Nanocontainers of corrosion inhibitors based on silica and halloysite nanoclay with Layer-by-Layer assembled polyelectrolyte shells were used in the second approach. Amorphous cerium molybdate nanowires have been used as corrosion inhibitor nanoparticles in the third approach. During the sol-gel synthesis these
nanocontainers were added to impart active corrosion protective properties of the sol-gel coatings. Using these approaches the negative effect of inhibitor on the sol-gel matrix stability was eliminated. The developed sol-gel pretreatments demonstrate important active corrosion protection and self-healing ability. The obtained results show high potential of the developed hybrid sol-gel pre-treatment doped with corrosion inhibitors for the corrosion protection of AA2024.
Contents
Agradecimentos... v
Resumo... vi
Abstract ... viii
Contents... 1
List of abbreviations and symbols... 5
List of Figures ... 8
List of Tables... 16
Preface ... 17
INTRODUCTION ... 21
1 Corrosion and corrosion protection of aluminum alloys... 21
1.1 Corrosion susceptibility of aluminum alloys... 21
1.1.1 Pitting corrosion ... 23
1.1.2 Crevice corrosion ... 25
1.1.3 Filiform corrosion... 25
1.1.4 Intergranular corrosion and stress corrosion cracking ... 27
1.2 Corrosion protection of aluminum alloys... 29
1.2.1 Corrosion inhibition and the use of chromates ... 29
1.2.2 “Passive” corrosion protection ... 34
1.2.3 “Active” corrosion protection... 36
2 Pretreatments for corrosion protection of aluminium alloys... 39
2.1 Anodic films... 39
2.2 Chemical conversion coatings... 41
2.3 Anodized and chemical conversion coatings for active corrosion protection ... 43
2.4 Organosilane pretreatments... 45
2.4.1 Organosilane pretreatments with active protection ... 46
2.5 Sol-gel pretreatments ... 48
2.5.1 Chemistry of the sol-gel synthesis... 48
2.5.2 Inorganic and hybrid sol-gel materials ... 50
2.5.3 Hybrid sol-gel pretreatments for passive and active corrosion protection... 53
3 Theoretical background of the main experimental techniques... 61
3.1 AFM / SKPFM... 61
3.1.1 Instrumentation... 61
3.1.2 Theoretical background ... 63
3.2 DC polarization ... 66
3.2.1 Instrumentation and electrochemical cell ... 66
3.2.2 Theoretical background ... 67
3.3 Electrochemical Impedance Spectroscopy ... 75
3.3.1 Instrumentation... 75
3.3.2 Theoretical background ... 76
3.3.3 Validation of impedance data ... 84
3.3.4 Interpretation and application of impedance data... 85
3.3.5 Equivalent circuits used for fitting of impedance spectra... 89
3.4 Scanning microelectrode techniques ... 93
EXPERIMENTAL ...97
4 Materials, sample preparation, synthesis and experimental techniques ...97
4.1 Materials ...97 4.1.1 Aluminium alloy ...97 4.1.2 Chemicals...97 4.2 Sample preparation ...100 4.2.1 Polishing 1 ...100 4.2.2 Polishing 2 ...100 4.2.3 Alkaline cleaning ...100 4.2.4 Chemical etching...100
4.3 Synthesis and application of the sol-gel films ...101
4.3.1 Synthesis of Zr based sol-gel formulations (SgZr1,2)...101
4.3.2 Synthesis of Ti based sol-gel formulation (SgTi1,2) ...101
4.3.3 Synthesis of Ti-based nanostructured network layers with corrosion inhibitor (TiOxSgZr1/ TiOxBTASgZr1) ...102
4.3.4 Preparation of SiO2-based nanocontainers with corrosion inhibitor (SgZr1NCBT/ SgZr1NCBTx2)...102
4.3.5 Preparation of Halloysite nanocontainers with corrosion inhibitor (SgZrHSMBT SgZrHS) 103 4.3.6 Incorporation of inhibitive additives in the sol-gel system SgZr1 ...103
4.3.7 Dipcoating...105
4.3.8 Curing ...105
4.4 Experimental conditions of the main techniques used in the study ...106
4.4.1 AFM and SKPFM ...106
4.4.2 DC polarization ...106
4.4.3 EIS ...107
4.4.4 SVET and microelectrode techniques ...108
4.5 Experimental conditions of supplementary experimental methods ...113
4.5.1 Salt spray test for sol-gel coated AA2024 substrates ...113
4.5.2 Cross-cut test...113
4.5.3 SEM coupled with EDS ...113
4.5.4 Ultramicrotomy and TEM observations...113
4.5.5 Optical microscopy ...114
4.5.6 XPS ...114
4.5.7 FTIR...114
4.5.8 TGA/DTA ...115
4.5.9 Particle size and zeta-potential analysis ...115
RESULTS AND DISCUSSION ...117
5 Corrosion inhibition of AA2024 ...117
5.1 Localized corrosion of AA2024 ...117
5.1.1 SEM/EDS study ...117
5.1.2 AFM/SKPFM study ...118
5.1.3 Mechanism of localized corrosion of AA2024 ...124
5.2 Inhibition of localized corrosion of AA2024 with Rare Earth ions ...131
5.2.1 SEM/EDS results ...131
5.2.2 AFM and SKPFM results...133
5.2.3 In-situ AFM study...137
5.2.4 DC polarization ...139
5.2.5 EIS study...141
5.2.6 Mechanism of corrosion inhibition with RE compounds...143
5.3.1 Characterization of cerium molybdate compound... 149
5.3.2 Experimental procedure and corrosion solutions preparation ... 150
5.3.3 Localized corrosion inhibition of AA2024... 151
5.3.4 DC polarization ... 153
5.3.5 Optical characterization of AA2024 after corrosion... 154
5.3.6 Corrosion characterization of AA2024 using EIS. ... 155
5.3.7 Mechanism of corrosion inhibition... 158
5.4 Corrosion inhibition of AA2024 by organic corrosion inhibitors ... 163
5.4.1 EIS measurements ... 163
5.4.2 DC polarization measurements... 164
5.4.3 Surface evolution... 167
5.4.4 AFM/SKPFM study ... 168
5.4.5 Mechanism of corrosion inhibition... 170
5.5 Other effective organic corrosion inhibitors for AA2024 ... 172
5.5.1 EIS measurements ... 172
5.5.2 Optical observations ... 176
5.5.3 DC-polarisation ... 177
5.5.4 XPS characterisation ... 179
5.5.5 AFM/SKPFM investigation... 181
5.5.6 Mechanism of the corrosion inhibition... 182
6 Sol-gel coatings... 185
6.1 Hybrid sol-gel coatings as pretreatments for corrosion protection of AA2024... 185
6.1.1 Sol-gel synthesis... 186
6.1.2 TG/DTA characterization of the hybrid sol-gel polymers... 190
6.1.3 Microstructural characterisation of the sol-gel coatings ... 192
6.1.4 Corrosion protection properties of the sol-gel coatings... 197
6.1.5 Optical and microstructural characterization of sol-gel coatings after corrosion. ... 202
6.1.6 Salt spray tests ... 204
6.1.7 Paint adhesion tests ... 207
6.2 Influence of ageing of Ti-based sol-gel formulation on the corrosion protection performance ... 210
6.2.1 Influence of temperature, ageing time and water to alkoxides ratio ... 210
6.2.2 Discussion ... 217
6.3 Influence of alloy surface preparation on the corrosion protection conferred by sol-gel coatings... 221
6.3.1 Characterization of the surface of AA2024 after different cleaning procedures ... 221
6.3.2 Corrosion protection properties of AA2024 coated with Zr based sol-gel system. Influence of the surface preparation. ... 224
6.4 Mechanism of corrosion attack on AA2024 coated with sol-gel films ... 227
6.4.1 Corrosion activity of the sol-gel coated alloy... 227
6.5 Methods of investigation of self-healing effects on the sol-gel coated AA2024... 234
6.5.1 Application of EIS and SVET technique for studying the self-healing on the sol-gel coated alloy ... 234
7 Sol-gel coatings with corrosion inhibitors... 239
7.1 Inhibitor-containing hybrid sol-gel coatings ... 239
7.1.1 Synthesis and characterisation of hybrid sol-gel coatings ... 239
7.1.2 Surface characterisation after corrosion ... 242
7.1.3 Study of the corrosion protection of the sol-gel coatings by EIS ... 245
7.1.4 Active corrosion protection of the sol-gel coatings, SVET study ... 251
7.1.5 Mechanism of the corrosion attack on AA2024 coated with sol-gel films containing inhibitors... 252
7.2 Hybrid sol-gel coatings with nanostructured reservoirs of inhibitors ...257
7.2.1 Nanoporous titania based interlayer with inhibitor for enhanced corrosion protective properties of the sol-gel coatings ...258
7.2.1.1 Preparation and characterisation of nanostructured titania layer on AA2024...258
7.2.1.2 Corrosion protection ...263
7.2.2 Anticorrosion sol-gel coatings loaded with LbL nanocontainers with inhibitor ...270
7.2.2.1 Preparation and characterization of nanocontainers...270
7.2.2.2 Preparation and characterization of sol-gel coatings loaded with nanocontainers ...271
7.2.2.3 Corrosion protection conferred by nanocontainers loaded sol-gel coatings...274
7.2.2.4 Mechanism of corrosion protection ...277
7.2.3 Anticorrosion sol-gel coatings loaded with Halloysites nanocontainers of inhibitor ...280
7.2.3.1 Preparation and characterization of nanocontainers...280
7.2.3.2 Preparation and characterization of sol-gel doped with halloysite nanocontainers...282
7.2.3.3 Corrosion protection performance ...284
7.2.4 Sol-gel coatings loaded with cerium molybdate nanowires ...287
7.2.4.1 Preparation of the sol-gel coatings doped with cerium molybdate compound...287
7.2.4.2 Microstructural characterisation of doped sol-gel coatings ...288
7.2.4.3 Corrosion protection of the sol-gel coatings: EIS study ...290
7.2.4.4 Self-healing properties of the sol-gel coatings ...293
CONCLUSIONS ...297
8 General conclusions and future work...297
8.1 General conclusions of the work...297
8.2 Recommendations for future work ...308
List of abbreviations and symbols
General symbols and abbreviation
A Surface area
BSA Boric sulfuric anodizing C Capacitor in equivalent circuits Ccoat Coating capacitance
Cdl Double layer capacitance
Cinh Capacitance of inhibitive layer
Cox Oxide capacitance
C, Cox ,Cred Concentration, Concentration of oxidative and reductive species
C0 Coating capacitance at the beginning of exposure to electrolyte
Cx Coating capacitance at the end of exposure to electrolyte
CCC Chemical conversion coating
CE Counter electrode
CPE Constant phase element
d Distance
Dox , Dred Diffusion coefficient of oxidative and reductive species
E Electrode potential
Ecorr Corrosion potential
ECP Electroactive conducting polymers Eeq Equilibrium potential
Epit Pitting potential
icorr Corrosion current density
iL Limiting current density
i0 Exchange current density
I0 Current amplitude
EF Fermi level
F Faraday constant
f Frequency
IGC Intergranular corrosion
Kf , Kb Reaction rate constants for the forward and backward reaction
L Inductor in equivalent circuits
NBB Nanobuilding blocks
n Number of electrons involved in electrochemical process
nm Nanometer
ORR Oxygen reduction reaction
Q Fitting parameter of equivalent circuit with capacitor rf , rb Rates of forward and backward reaction
r Water to alkoxide ratio
R Resistor in equivalent circuits
R Universal gas constant
R, Y, A Organic functional groups in chemical formulas Rcoat Coating resistance
RE Reference electrode
Rinh Resistance of inhibitive layer
Rox Oxide resistance
Rpolar Polarization resistance
Rsol Solution resistance
SAA Sulfuric acid anodizing SCC Stress corrosion cracking SCE Saturated calomel electrode SHE Standard Hydrogen Electrode
t Time
T Temperature
TSA Tartaric sulfuric anodizing
VAC Externally applied alternating voltage
VCPD Contact potential difference
VDC Externally applied constant voltage
VVPD, VPD Volta potential difference
W, Zw Warburg impedance
WE Working electrode
Wm, Wp Work function of metal and probe
wt.% Weight percentage
Y0 Admittance
Z, Z0, Z(ω) Impedance
Z’, Z’’ Real and imaginary part of impedance
α Fraction of polarization
βa , βc Cathodic and anodic Tafel constant
∆Gf* , ∆Gb* activation energy of forward and backward reaction
∆V Potential difference
δ Diffusion layer thickness
ε Dielectric permittivity
ε0 Dielectric permittivity of vacuum
εw Dielectric permittivity of water
η Polarization
ηa Cathodic polarization
ηc Anodic polarization
ηact , ηconc Activation and concentration polarization
µ m Micrometer ρ Specific resistance σ Warburg coefficient τ Time constant φ Phase shift ω Angular frequency Experimental techniques AES Auger Electron Spectroscopy
AFM Atomic Force Microscopy
DC-polarization Direct current polarization DTA Differential thermal analysis EDS Energy Dispersive Spectroscopy
EIS Electrochemical impedance spectroscopy FTIR Fourier Transformed Infrared Spectroscopy SEM Scanning Electron Microscopy
SIET Scanning Ion-Selective Electrode Technique SKPFM Scanning Kelvin Probe Microscopy
SRET Scanning Reference Electrode Technique SVET Scanning Vibrating Electrode Technique TEM Transmission Electron Microscopy
TOF-SIMS Time of flight Secondary Ions Mass Spectroscopy TGA Thermogravimetric analysis
XPS X-ray Photoelectron Spectroscopy
Inhibitors and reagents
8HQ 8-Hydroxyquinoline
AcAc Acetylacetone
BTA Benzotriazole
MBT 2-mercaptobenzothiazole MPS 3-methacryloxypropyltrimethoxysilane PAH Polyallylhydrochloride PEI Polyethyleneimine PSS Polystyrenesulfonate QA Quinaldic acid SAL Salycilaldoxime TEOS Tetraetylorthosilicate TPOT Titanium (IV) propoxide TPOZ Zirconium (IV) propoxide
List of Figures
Figure 1.1.1. Potential - pH equilibrium diagram for the system aluminium – water at 25ºC [19]...22
Figure 1.1.2. Schematic representation of pitting potential Epit on the anodic polarisation curve for aluminium alloy. ...23
Figure 1.1.3. Schematic representation of pitting activity of aluminium alloy in chloride containing solution. Adapted from ref. [6] ...24
Figure 1.1.4. Example of the filiform corrosion on a coated steel substrate a) and schematic representation of the filiform corrosion mechanism b). Figure b is adapted from ref. [26]...26
Figure 1.1.5. Schematic representation of Intergranular corrosion. ...28
Figure 1.2.1. Potential vs. log i curves showing two half-cell reactions involving metal and environment (solid lines); the influence of inhibitors on the anodic and the cathodic currents is shown by dashed lines. Corrosion currents due to action of anodic and cathodic inhibition are icorr’ and icorr’’ respectively...30
Figure 1.2.2. Schematic representation of industrial coating system for aluminium alloys. Adapted from ref. [41]...35
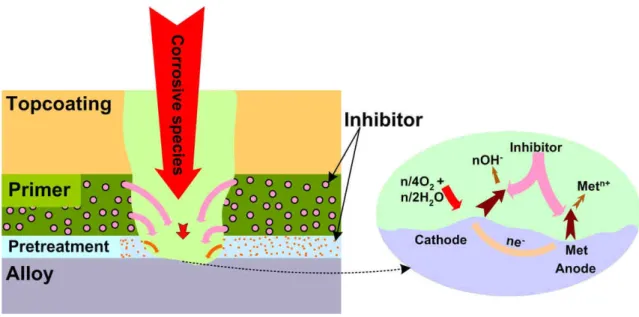
Figure 1.2.3. Schematic representation of active corrosion protection system for aluminium alloys. ...36
Figure 2.1.1. Schematic representation of porous anodized layer formed on aluminium a), pores are closed using sealant b). ...40
Figure 2.5.1. Dependence of γ-glycidoxypropyltrialkoxysilane hydrolysis rate in water on pH taken from [176]...49
Figure 2.5.2. Class I hybrid material (no covalent bonds are formed between inorganic and organic phases). Adapted from ref. [183]. ...52
Figure 2.5.3. Class II hybrid materials; (A) hybrid network with added functionality (Y) linked by inorganic bonds; (B) hybrid network linked by inorganic and organic bonds; (C) organic-inorganic network made of nano-building blocks linked through organic bonds. Adapted from ref. [183]. ...52
Figure 2.5.4. Scheme of chemical bond formation between metal, sol-gel and paint [188]. ...55
Figure 3.1.1. Schematic diagram of AFM microscope ...62
Figure 3.1.2. Energy diagram of metal and material of the AFM probe without electrical contact a); when there is an electrical contact b); when voltage is applied externally c). Adapted from ref. [264]. ...64
Figure 3.1.3. Schematic diagram of SKPFM microscope ...65
Figure 3.1.4. Plot of VPD measured in air vs. OCP measured in water solution for different pure metals. Graph is adapted from ref. [266]...65
Figure 3.2.1. Schematic setup for potentiostatic polarization measurements...67
Figure 3.2.2. Energy profile of half cell reaction; solid line presents equilibrium state and dashed line presents polarized state. Graph is adapted from ref. [26]...69
Figure 3.2.3. Potential vs. log i showing linear Tafel behaviour (straight lines)...71
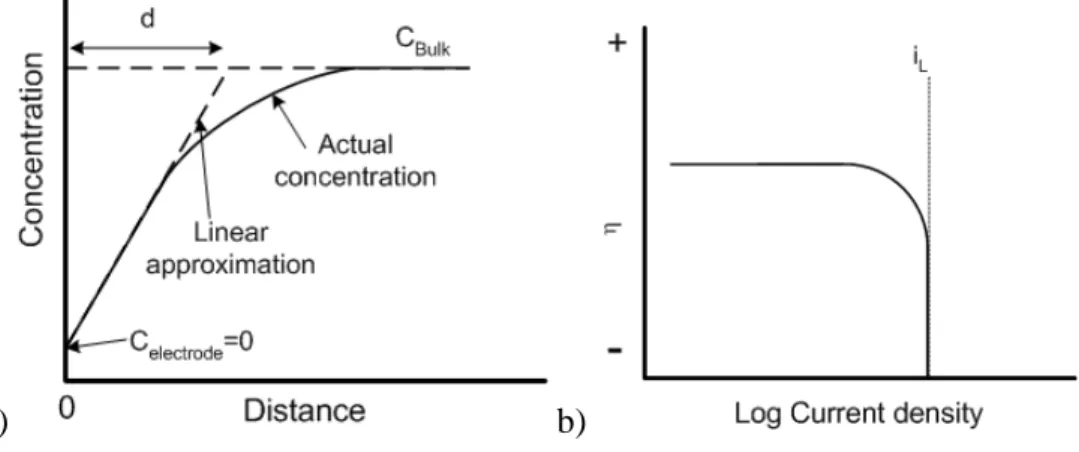
Figure 3.2.4. Concentration profile of electroactive species near the electrode surface a); overpotential (η) vs. current density at mass transfer conditions b) Adapted from ref. [26]...72
Figure 3.2.5. Overpotential η vs. logi showing activation polarization (ηact), concentration polarization (ηconc) and combined polarization (ηact+ηconc). Adapted from ref. [26]. ...73
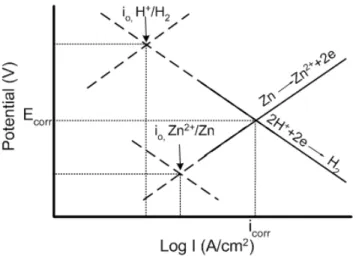
Figure 3.2.6. E vs. log I plot showing two half cell reactions on zinc surface. Adapted from ref. [26]. ...73
Figure 3.3.1. A block diagram of the instrumentation used for EIS. Adapted from ref. [284]. ...76
Figure 3.3.2. Sinusoidal signals of the applied voltage and current response with phase shift. ...77
Figure 3.3.3. Lissajous Figure (an oval) formed by applied voltage signal on the X axis and current response signal on the Y axis. Adapted from [282]. ...77
Figure 3.3.4. Argand diagram showing impedance vectors a), Complex plane plots representation of real and imaginary parts of impedance spectra at different frequencies on real axis (Z`) and imaginary axis (Z``) b). 78
Figure 3.3.5. Bode plots representation of modulus of impedance and phase angle vs. frequency... 79
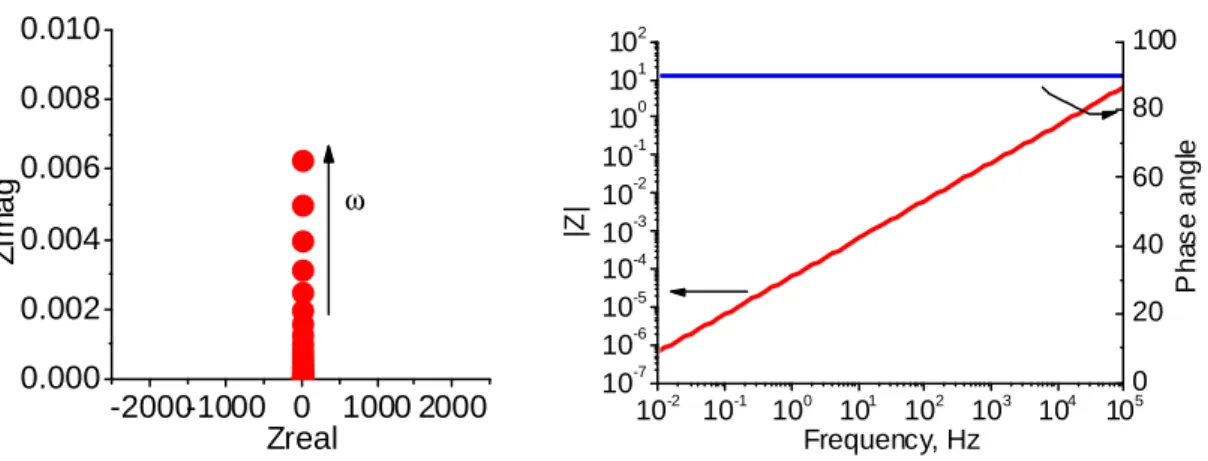
Figure 3.3.6. Complex plane and Bode plots representing the impedance of 3000 Ohm resistor. ... 81
Figure 3.3.7. Complex plane and Bode plots representing the impedance of 1*10-6 F capacitor... 81
Figure 3.3.8. Complex plane and Bode plots representing the impedance of 1*10-5H inductor... 81
Figure 3.3.9. Complex plane and Bode plots representing the impedance of R-C element combined in series. R=3000 Ohm, C=1*10-6 F. ... 82
Figure 3.3.10. Complex plane and Bode plots representing the impedance of R-C element combined in parallel. R=3000 Ohm, C = 1*10-6 F. ... 82
Figure 3.3.11. Complex plane and Bode plots representing the impedance of R1R2C circuit. R1 = 500 Ohm, R2 = 1*106 Ohm, C=1*10-6 F... 83
Figure 3.3.12. Equivalent circuits and corresponding Bode plots representing different stages of metal-coating degradation; a) the intact metal-coating, b) the porous metal-coating, c) the porous metal-coating and the started corrosion activity. ... 86
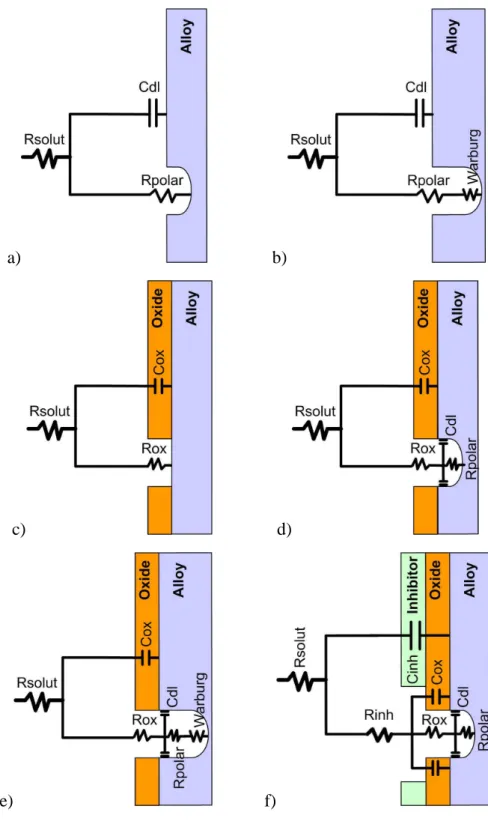
Figure 3.3.13. Equivalent circuits used for fitting of impedance spectra of the alloy samples during immersion in corrosive electrolytes... 90
Figure 3.3.14. Equivalent circuits used for fitting of impedance spectra of the sol-gel coated alloy samples during immersion in corrosive electrolytes. ... 92
Figure 3.4.1. Schematic sketch of current and potential distribution above a local anodic zone. Adapted from ref. [320]... 94
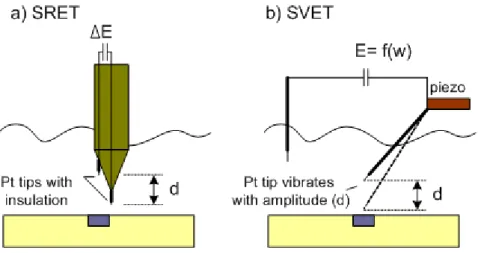
Figure 3.4.2. Scheme of SRET a) where two Pt tips are separated on distance “d” and SVET b) where a single tip vibrates with amplitude “d”. Adapted from ref. [320]... 95
Figure 4.4.1. Cell for polarization measurements... 107
Figure 4.4.2. Cell for impedance measurements a); the electrode arrangement b)... 108
Figure 4.4.3. Electrochemical setup for SVET measurements, vibrating Pt probe b). ... 109
Figure 4.4.4. Electrochemical setup for SIET measurements a), top end of the ion selective electrode b)... 110
Figure 4.4.5. Calibration curve between the pH of the buffer solutions and response of the micro potentiometric probe for pH detection... 110
Figure 4.4.6. Electrochemical setup for microamperometric measurements a), a tip of Pt microdisc electrode b). ... 111
Figure 4.4.7. Polarization curve obtained in cathodic direction made on Pt electrode showing the diffusion limited plateau of oxygen reduction reaction. ... 112
Figure 4.4.8. Schematic sketch of a cell for SVET, SIET and Microamperometric measurements. ... 112
Figure 5.1.1. SEM micrograph of AA2024 immersed in 0.005M NaCl solution for 2 hours. ... 118
Figure 5.1.2. Topography (a) and VPD map (b) for AA2024 before corrosion; Topography (c) and VPD map (d) for AA2024 after immersion for 2 h in neutral solution 0.005M NaCl. ... 119
Figure 5.1.3. SEM micrograph of area presented in Figure 5.1.2c a), profiles across the black horizontal line of EDS elemental analysis upper part of (b) and Height and VPD lower part of (b). ... 120
Figure 5.1.4. Topography a) and VPD map b) for AA2024 before corrosion; Topography c) and VPD map d) after immersion for 2 h in 0.005M NaCl with pH 3. ... 121
Figure 5.1.5. SEM micrograph of area presented in Figure 5.1.4, profiles across the black horizontal line of EDS elemental analysis upper part b) and Height and VPD bottom b). ... 122
Figure 5.1.6. Optical micrograph of polished AA2024 surface after immersion in neutral 0.005M NaCl for 2 hours. ... 123
Figure 5.1.7. Back-scattering electron micrographs made on AA2024 at the place of pit after immersion in 0.5M NaCl for 2 months; EDS spectra taken at two places c); Surface of the sample was preliminary cleaned from the layer of corrosion products before the investigation. ...124 Figure 5.1.8. Schematic representation of corrosion mechanism of AA2024 in chloride solution. ...126 Figure 5.1.9. Optical photograph of the surface of the AA2024 at the beginning of the immersion test in NaCl solution; on the left and right sides bubbles are seen. ...127 Figure 5.1.10. Fraction “a” of different metal species in the solution depending on pH. ...129 Figure 5.2.1. SEM image of the AA2024 after immersion for 1 h in 0.005M NaCl with 0.15M of Ce(NO3)3
a); inset picture presents micrograph after 2 h of immersion b); surface after immersion for 2 h in 0.005M NaCl with 0.0015M of Ce(NO3)3 is presented in picture c); EDS analysis of the areas indicated in SEM
images d)...132 Figure 5.2.2. SEM image of the AA2024 after immersion for 1h in 0.005M NaCl with 0.15M of La(NO3)3 a)
and for 2 h in 0.005M NaCl with 0.0015M of La(NO3)3 b); EDS analysis of the areas indicated с)...133
Figure 5.2.3. Topography (a), VPD map (b) and Height and VPD Profile (c) for AA2024 immersed in 0.005M NaCl solution with 0.15M Ce(NO3)3 for 1 hour. ...134
Figure 5.2.4. Topography (a), VPD map (b) and Height and VPD Profile (c) for AA2024 immersed in 0.005M NaCl solution with 0.15M La(NO3)3 for 1 hour. ...135
Figure 5.2.5. VPD maps for AA2024 immersed in 0.005M NaCl solution with 0.015M Ce(NO3)3 (a) and
0.15M Ce(NO3)3 (b) for 1 hour. ...136
Figure 5.2.6. Evolution of the VPD profiles across the S-phase intermetallic particles (a) for the AA2024 samples immersed in 0.005M NaCl solution with 0.15M, 0.015M, 0.0015M of Ce(NO3)3 b), and with
0.15M, 0.015M, 0.0015M of La(NO3)3 c)...136
Figure 5.2.7. In-situ AFM scans of the AA2024 surface after 3h of immersion in 0.005M NaCl with 0.015M La(NO3)3 a) and at the end of immersion in 0.5M NaCl with 0.015M La(NO3)3 solution (b) and evolution of
height profile in the solution of 0.005M and 0.5M NaCl with time (c). ...138 Figure 5.2.8. Rate of the lanthanum hydroxide precipitation at the place showed in Figure 5.2.7 in 0.005M NaCl at the beginning (red squares) and in 0.5M NaCl (green squares) at the end of in-situ AFM measurement. ...139 Figure 5.2.9. Potentiodynamic polarization curves for the AA2024 in 0.05M NaCl solution without cerium nitrate (after 1 hour of immersion) and with 0.0015M of Ce(NO3)3 inhibitor after 10 min, 1 h and 2 h of
immersion a), and 0.0015M of La(NO3)3 after 10 min, 1 h and 2 hours of immersion b). ...141
Figure 5.2.10. Bode plots of AA2024 recorded during different time of immersion (1, 3, 7, 14 days) in 0.05M NaCl solution with 1mM Ce or La salts a); bode plots of alloy immersed in 0.05M NaCl solution b). ...142 Figure 5.2.11. Optical photographs of AA2024 made after 14 days of immersion in 0.05M NaCl solution with 1mM Ce a) and 1mM La b); photo c) shows alloy surface after corrosion in 0.05M NaCl solution. ....143 Figure 5.2.12. Diagram of the pH range of the respective hydroxides existence. Range of existence of different insoluble hydroxides was calculated using Solubility Products constants. ...145 Figure 5.2.13. Fraction “a” of different metal species in the solution depending on pH. ...145 Figure 5.3.1. SEM micrograph of the dried suspension a) and size distribution of a suspension based on cerium molybdate compound b)...150 Figure 5.3.2. SEM micrographs made on polished AA2024 substrates before a), b) and after 2h of immersion in undoped 0.05M NaCl c) and in Centrifugate #1 solution d); EDS spectra taken after corrosion exposure on the intermetallics in the middle e). ...152 Figure 5.3.3. SEM micrographs made on polished AA2024 substrates after 2h immersion in Centrifugate #1 solution a) and Suspension #1 b). ...153 Figure 5.3.4. Polarization curves made on polished AA2024 samples obtained after 1 h of immersion in bare 0.05M NaCl solution, Centrifugate #1 and Centrifugate #2 solutions. ...154 Figure 5.3.5. Optical photographs of AA2024 substrates after 14 days of immersion in Suspension #1 a), Centrifugate #1 b) and #2 c), and undoped 0.05M NaCl d). ...155
Figure 5.3.6. Bode plots for AA2024 after 7 days of immersion in Suspension #1, Centrifugate #1 and #2 and uninhibited 0.05M NaCl solution. ... 157 Figure 5.3.7. Evolution of oxide layer resistance (Rox) a), oxide layer capacitance (Cox) b), polarization
resistance (Rpolar) c) for bare AA2024 substrates during immersion in Suspension #1, Centrifugate #1 and #2
and 0.05M NaCl. ... 157 Figure 5.3.8. Potential-pH equilibrium diagram for the system Mo-water, at 25ºC [19]. ... 159 Figure 5.3.9. SEM micrographs made on AA2024 substrates after EIS testing in Suspension #1 electrolyte a) and in Centrifugate #2 electrolyte b). ... 161 Figure 5.3.10. Bode plots for AA2024 after 7 days of immersion in Suspension #1, Centrifugate #1 and #2 and uninhibited 0.05M NaCl solution in comparison with the solutions of 1 or 50 mM of Na2MoO4 in 0.05M
NaCl. ... 162 Figure 5.4.1. Bode plots for AA2024 after 2 a) and 12 days b) of immersion in 0.005 M NaCl electrolyte without and with different inhibitors. ... 164 Figure 5.4.2. Anodic and cathodic polarization curves for 2024 aluminium alloy in 0.05 M NaCl with different inhibitors. The potential was scanned in the positive direction. (Inset shows linear Tafel parts on the first section of the anodic branches). The samples were immersed in solutions for 20 min prior the measurements. ... 166 Figure 5.4.3. Anodic and cathodic polarization curves for copper in oxygen saturated 0.05 M NaCl electrolyte. The potential was scanned from open circuit potential to the respective direction... 166 Figure 5.4.4. Optical micrographs of the polished alloy immersed for 2 h in 0.005 M NaCl a), and in the solution containing BTA b), MBT c) and 3-amino1,2,4-triazole d) inhibitors... 168 Figure 5.4.5. Topography (a, c) and VPD map (b, d) of AA2024 after 2 h of immersion in 0.005 M NaCl solution containing BTA (a, b) and MBT (c, d). Black lines on the maps correspond to profiles of the topography and VPD which are presented on the graphs e) for BTA and f) for MBT... 169 Figure 5.5.1. EIS spectra obtained for AA 2024 after 14 days of immersion in 0.05 M NaCl with or without inhibitors... 174 Figure 5.5.2. Bode plots for AA 2024 after 1 day a) and 14 days b) of immersion in 0.05 M NaCl with 8HQ, QA and SAL inhibitors; solid lines present fitting curves... 174 Figure 5.5.3. Evolution of capacitance a) and resistance b) of inhibitor layer; resistance of the oxide layer c) during the immersion time in 0.05M NaCl with or without inhibitors. ... 175 Figure 5.5.4. Photos of the AA2024 samples immersed for two weeks in 0.05 M NaCl with and without inhibitors... 177 Figure 5.5.5. Polarization curves made on AA2024 in 0.05 M chloride solution with different inhibitors. The curves were taken after 1 hour of immersion a) and 24 hours of immersion b). ... 178 Figure 5.5.6 XPS spectra corresponded to ionizations of Al 2p a), N 1s b), Cu 2p c) and Mg 2p d) obtained on the AA2024 immersed for 5 hours into pure NaCl solution, or NaCl with different inhibitors. ... 180 Figure 5.5.7 Topography and VPD profiles of the polished specimens of AA2024 before and after 5h immersion in 0.05 M NaCl solution with SAL a), QA b), 8HQ c) and NaCl solution only d). ... 181 Figure 6.1.1. Schema of the sol-gel synthesis route. ... 186 Figure 6.1.2. Optical photograph of the suspension formed in alkosol 1 with TPOT, AcAc and water after ultrasonic agitation a), and the final sol-gel mixture alkosol 3 (SgTi2) b). ... 188 Figure 6.1.3. Optical photograph of the suspension formed in alkosol 1 with TPOT, EthAcAc and water after ultrasonic agitation a), and final sol-gel mixture alkosol 3 (SgTi1) b). ... 188 Figure 6.1.4. Optical photograph of the suspension formed in alkosol 1 with TPOZ, AcAc and water after ultrasonic agitation a), and final sol-gel mixture alkosol 3 (SgZr2) b)... 188 Figure 6.1.5. Optical photograph of the suspension formed in alkosol 1 with TPOZ, EthAcAc and water after ultrasonic agitation a), and final sol-gel mixture alkosol 3 (SgZr1) b)... 189 Figure 6.1.6. XRD spectra of TiO(AcAc)2 compound obtained after centrifugation of the alkosol 1 containing
Figure 6.1.7. TGA/DTA curves for zirconia - (1) and titania - (2) based hybrid xerogels; for xerogels prepared from alkosol 2 containing GPTMS, 2-propoxide and water (3); for xerogels from alkosol 1 containing TPOZ, EtAcAc and water (4)...192 Figure 6.1.8. Topography of hybrid sol-gel coatings SgZr1 a), b) and SgTi2 c), d). ...193 Figure 6.1.9. SEM micrographs of SgZr1 (a,b) and SgTi2 (c,d) sol-gel coatings deposited on AA20204 substrates...194 Figure 6.1.10. SEM cross-section micrographs of SgZr1 a) and SgTi2 b) sol-gel coatings deposited on AA2024 substrates. ...194 Figure 6.1.11. TEM cross-section micrographs of SgZr1 a), b), c) and SgTi2 d) sol-gel coatings deposited on AA2024 substrates. ...196 Figure 6.1.12. Impedance spectra of AA2024 coated with Zr based hybrid sol-gel film taken after 1 hour, 1 day, 2 weeks and 1 month of immersion in 0.5 M NaCl. Solid lines present fit using appropriate equivalent circuits...197 Figure 6.1.13. Evolution of capacitance Ccoat a) and resistance Rcoat b) for different hybrid coatings on
AA2024 during immersion in 0.5 M NaCl solution...200 Figure 6.1.14. Evolution of resistance of the intermediate layer Rox a) and polarization resistance of corrosion
process Rpolar b) for different hybrid coatings deposited on AA2024 during immersion in 0.5 M NaCl
solution...202 Figure 6.1.15. Optical photographs of AA2024 samples coated with different sol-gel films SgSgZr1 a) and SgZr2 b), SgTi1 c) and SgTi2 d) after 1 month immersion in 0.5 M NaCl solution...203 Figure 6.1.16. SEM micrographs of SgZr1 (a), SgTi1 (b) and SgTi2 (c) sol-gel after 1 month immersion in 0.5 M NaCl solution (plane view). Picture d) shows blister at higher magnification. ...204 Figure 6.1.17. Photos of AA2024 samples coated with chromate conversion coating (a), SgZr1 (b), SgTi2 (c) after 168 h and 336 h in neutral salt spray test according to ISO 9227...206 Figure 6.1.18. Photos of the scribe area (1 mm scribe width) of AA2024 samples coated with chromate conversion coating (a), SgZr1 (b), SgTi2 (c) after 168 h and 336 h in neutral salt spray test according to ISO 9227. ...207 Figure 6.1.19. Crosscut adhesion tape test of the SgZr1 (a), SgTi2 (b) sol-gel coatings on AA2024 samples coated with water based epoxy primer and water based epoxy topcoat before and after 14d immersion in DI water...208 Figure 6.1.20. TEM micrograph shows a cross-section of a primer coating and SgZr1 sol-gel coating deposited on AA2024 sample. Alloy is on the bottom, sol-gel coating is in the middle and primer is on the top of the image. ...209 Figure 6.2.1. Bode plots for sol-gel coatings applied after different aging time at 25ºC and -6ºC. EIS spectra correspond to the sol-gel coated AA2024 samples after 14 days of immersion in 0.5M NaCl. Solid lines present fits of the spectra using an appropriate model. ...212 Figure 6.2.2. Evolution of the sol-gel coating resistance a) and capacitance b); intermediate oxide film resistance c) and polarization resistance d) obtained after fitting of impedance spectra...213 Figure 6.2.3. Bode plots for sol-gel coatings applied after different aging time at 25ºC and -6ºC. EIS spectra correspond to the sol-gel coated AA2024 samples after 14 days of immersion in 0.5M NaCl. Solid lines present fits of the spectra using appropriate model. ...216 Figure 6.2.4. Evolution of coating resistance a), capacitance b) intermediate oxide film resistance c) and polarisation resistance d) obtained after fitting of impedance spectra. ...216 Figure 6.3.1 Schematic representation of AA2024 cleaning procedures (paragraph 4.2.3, 4.2.4). ...222 Figure 6.3.2 SEM micrographs of AA2024 surface after alkaline cleaning procedure (paragraph 4.2.3). ....223 Figure 6.3.3 SEM micrographs of AA2024 surface after chemical etching procedure (paragraph 4.2.4). ....224 Figure 6.3.4. Bode plots of AA2024 coated with SgZr1 sol-gel coatings after 1 day and 1 month of immersion; alloy substrate was etched using alkaline cleaning procedure (sample A) (paragraph 4.2.3) and chemical etching procedure (sample C) (paragraph 4.2.4)...225
Figure 6.3.5. Optical photographs of AA2024 coated with SGZr1 hybrid sol-gel coatings after 1 month of immersion; alloy substrates were etched using alkaline cleaning procedure (Sample A) described in paragraph 2.3.3, and chemical etching procedure (Sample C) described in paragraph 2.3.4. ... 226 Figure 6.4.1. Evolution of OCP of AA2024 coated with Zr1 sol-gel during immersion in NaCl solution. .. 228 Figure 6.4.2. SEM image of AA2024 coated with Zr1 sol-gel after short exposure to NaCl solution. ... 228 Figure 6.4.3. SEM Micrograph of pit a) and EDS spectra b) of two different zones. ... 228 Figure 6.4.4. Optical photograph of the micro defects made on the sol-gel coated AA2024 sample a). Profile of ionic current b) measured at 100 µm away from the surface across the line indicated in optical picture. 229 Figure 6.4.5. Line scans of ionic current (SVET) a), pH b) and dissolved oxygen c) obtained at 50 µm (100 µ m for SVET) above the surface of the sol-gel coated alloy with two artificial defects during immersion in 0.05M NaCl solution. ... 230 Figure 6.4.6. SEM image a) and EDS spectra on the blister and on the sol-gel matrix after immersion in NaCl solution. ... 232 Figure 6.4.7. SEM image of the delaminated part of the sol-gel coating around a big corrosion pit after immersion in NaCl solution... 232 Figure 6.4.8. Localized corrosion of sol-gel coated alloy presenting pitting, cracking and blistering. ... 233 Figure 6.5.1. Evolution of impedance spectra of undoped sol-gel coated alloy during immersion in 0.5M NaCl before and after defect formation a) and in undoped 0.5M NaCl during 1 day after defect formation with following 4 days in electrolyte containing 0.5M NaCl and 0.1mM 8HQ b). ... 235 Figure 6.5.2. Optical photo (a) and the SVET maps taken in the corresponding zone of AA2024 coated with sol-gel film after 1 hour (b) and 1 day (c) of immersion in 0.05M NaCl electrolyte. The electrolyte was changed to the 0.05M NaCl + 0.1mM 8-hydroxyquinoline and the SVET maps were obtained after 1 hour (d) and 1 day (e). ... 237 Figure 7.1.1. Plane and cross-section views obtained by SEM of the sol-gel coatings deposited on AA2024 before corrosion exposure SgZr1BTA3 (a,b), SgZr18HQ3 (c,d), SgZr1Ce3 (e,f). ... 241 Figure 7.1.2. SEM images of sol-gel coated samples after 25 days of immersion in 0.5M NaCl, SgZr1BTA3 a), SgZr18HQ3 b) and SgZr1Ce3 c)... 243 Figure 7.1.3. SEM images of SgZr1BTA3 sample after 25 days of immersion in 0.5M NaCl, pit a), zone on the periphery of the pit at higher magnification b), zone of cracking at higher magnification c)... 244 Figure 7.1.4. EIS spectra of different sol-gel coatings doped with BTA a), 8HQ b) and Ce(NO3)3 c)
inhibitors. Spectra were obtained after 7 days of immersion in 0.5M NaCl solution... 245 Figure 7.1.5. Evolution of Sol-gel films capacitance for coatings doped by BTA a), 8HQ b) and Ce(NO3)3 c)
during immersion in 0.5M NaCl solution... 247 Figure 7.1.6. Evolution of sol-gel films resistance for coatings doped by BTA a), doped by 8HQ b) and Ce(NO3)3 c) during immersion in 0.5M NaCl solution. ... 249
Figure 7.1.7. Evolution of intermediate oxide layer resistance for sol-gel coatings doped by BTA a), 8HQ b) and Ce(NO3)3 c) during immersion in 0.5M NaCl solution... 250
Figure 7.1.8. SVET maps of the local current fluxes after 4h and 4 days of immersion in 0.05M NaCl for undoped sample (a, b), SgZr18HQ3 sample (c, d) and SgZr1Ce3 sample (e, f). Scale units: µA cm−2. ... 252 Figure 7.1.9. Localized corrosion inhibition in the sol-gel coating with micro defect. ... 253 Figure 7.2.1. FTIR spectra of individual components and model reactive mixture of semihydrolyzed Ti(OPri)4 with Pluronic F127 as well as transmittance spectra of the aluminium alloy substrate covered with
TiOx layer after heat treatment... 260 Figure 7.2.2. AFM images of the surface morphology for polished aluminium AA2024 a) and for polished aluminium AA2024 treated with TiOx layer b). ... 261
Figure 7.2.3. SEM micrographs for AA2024 etched bare substrate a), etched alloy coated with TiOx film b) and fragment of the EDS spectra of the materials presented in a) and b) pictures c). ... 262
Figure 7.2.4. Bode plots of AA2024 substrates covered with different sol-gel pretreatments after 14 days of immersion in 0.05 M NaCl solution. Sample coated with benzotriazole doped sol-gel was immersed in 0.005M NaCl solution...264 Figure 7.2.5. Evolution of the sol-gel coating resistance during the immersion. ...266 Figure 7.2.6. Evolution of the oxide layer resistance during the immersion...266 Figure 7.2.7. Evolution of the Complex plane plots during immersion in 0.05 M NaCl obtained for the aluminium AA2024-T3 treated with formulation TiOxBTSgZr1 a) and undoped sol-gel coating SgZr1 b). 267 Figure 7.2.8. Schematic view of the self-healing process when defect is formed on sol-gel coated alloy with TiOx network loaded with inhibitor...267 Figure 7.2.9. SVET maps of the ionic currents measured 200 µm above the surface of the AA2024 coated with SgZr1 hybrid film (a, c, d) and with TiOxBTSgZr1 coating (e, g ,h) exposed to 0.05M NaCl; for 1 day (a,e). The defects were made after 1 day (b, f). SVET scans were taken in 5min after defect formation (c,g) and 3h after defect formation (d,h). Scale units: µA cm−2. Scanned area: 2 mm × 2 mm. ...268 Figure 7.2.10. Schematic view of the nanocomposite sol-gel coating with inhibitor...270 Figure 7.2.11. Electrophoretic mobility measurements of nanocontainers a) and diameter of the nanocontainers vs. LbL assembly step b); (0 layer - initial SiO2 particles), 1 layer - SiO2/PEI, 2 layer -
SiO2/PEI/PSS, 3 layer - SiO2/PEI/PSS/BTA, 4 layer - SiO2/PEI/PSS/BTA/PSS, 5 layer -
SiO2/PEI/PSS/BTA/PSS/BTA.). ...271
Figure 7.2.12. Plane a) and cross-sectional b) electron micrographs of the sol-gel film loaded with BTA nanocontainers and deposited on AA2024 substrate...273 Figure 7.2.13. Topography of the hybrid film SgZr1NCBT1x2 obtained by AFM before a) and after 14 days b,c) of immersion in NaCl solution. ...273 Figure 7.2.14. Impedance spectra of different sol-gel films after 190 hours of immersion in 0.005 M NaCl.
...275 Figure 7.2.15. Evolution of the sol-gel film resistance a) and resistance of the intermediate oxide layer b) during immersion in 0.005M NaCl electrolyte for AA2024 coated with different hybrid films...276 Figure 7.2.16. SVET maps of the ionic currents measured above the surface of the AA2024 coated with undoped sol-gel film (SgZr1) (a,c,d,e) and with film doped by nanocontainers (SgZr1NCBT1x2) (g,h,i). The maps were obtained before defect formation a) after defect formation for 4h (c,g), 24h (d,h) and 48h (e,i). Scale units: µA cm−2. Scanned area: 2 mm × 2 mm...277 Figure 7.2.17. Scheme of the controllable release of inhibitor from the nanocontainers and the “smart self-healing” process. ...278 Figure 7.2.18. SEM a) and TEM b) images of the halloysite nanocontainers...281 Figure 7.2.19. Left: schematic illustration of the fabrication of MBT-loaded halloysite/polyelectrolyte nanocontainers. Right: zeta-potential data for sequential deposition of PAH and PSS polyelectrolytes on halloysite nanotubes, pH 7.5. ...281 Figure 7.2.20. SEM image of halloysites doped with 2-mercaptobenzothiazole and coated with PAH/PSS/PAH/PSS polyelectrolyte layers...282 Figure 7.2.21. Optical photograph of the sol-gel formulation doped with halloysites. ...283 Figure 7.2.22. SEM images of AA2024 specimen coated by the sol-gel film doped with halloysites...283 Figure 7.2.23. Bode plots for Sol-gel films doped with halloysites with or without MBT after 21 days of immersion in 0.5M NaCl solution...285 Figure 7.2.24. Evolution of sol-gel films resistance and capacitance for coatings doped with halloysites with or without MBT during immersion in 0.5M NaCl solution. ...285 Figure 7.2.25. Evolution of intermediate oxide layer resistance a) and polarization resistance b) for coatings doped with halloysites with or without MBT during immersion in 0.5M NaCl solution...285 Figure 7.2.26. Optical photograph of the sol-gel formulation doped with cerium molybdate nanoparticles. 288
Figure 7.2.27. TEM micrograph of cross-section of sol-gel coatings doped with cerium molybdate inhibitor and EDS analysis performed on the dark black inclusions... 289 Figure 7.2.28. Bode plots for Sol-gel films undoped and doped with cerium molybdate after 21 days of immersion in 0.5M NaCl solution. ... 291 Figure 7.2.29. Evolution of sol-gel films resistance and capacitance for coatings doped with cerium molybdate during immersion in 0.5M NaCl solution. ... 291 Figure 7.2.30. Evolution of intermediate oxide layer resistance Rox a) and polarization resistance Rpolar b) for
coatings doped with cerium molybdate during immersion in 0.5M NaCl solution. ... 292 Figure 7.2.31. Increase of impedance during 7 days of immersion of sample SgZrMo1. ... 293 Figure 7.2.32. SEM micrograph made on sample SGZrMo1 after some days of corrosion testing in 0.5M NaCl solution a) and EDS spectrum taken at the place of the pit and at the sol-gel matrix b). ... 294
List of Tables
Table 3.3.1. Common electrical elements used in circuits ...80 Table 4.1.1. Composition of aluminum alloy 2024-T3, wt. %...97 Table 4.1.2. List of reagents used for synthesis. ...97 Table 4.1.3. List of compounds used for testing their corrosion inhibition properties for 2024 aluminum alloy.
...98 Table 4.3.1. Sol-gel formulations...104 Table 5.1.1. Atomic ratios between the elements on different phases of AA2024 after immersion in 0.005M NaCl for 2h (see Figure 5.1.1). ...118 Table 5.3.1. Compositions of different solutions and respective reference name. ...151 Table 5.5.1. Concentrations of reagents used for testing in 0.05M NaCl solution...172 Table 5.5.2. The properties of insoluble complexes of Cu, Mg and Al with 8HQ...183 Table 6.1.1. Compositions of different sol-gel systems and their reference name...186 Table 6.1.2. Numerical data of capacitance (C), dielectric permittivity ε, and water uptake for different sol-gel coatings. ...199 Table 6.1.3. The resistance of different coatings at the beginning of immersion and after 24 hours of immersion in 0.5 M NaCl. ...201 Table 6.1.4. Results of the salt spray test of different coatings after 168 h and 336 h. ...205 Table 6.1.5. Results of the paint adhesion test (ISO 2409) before and after 14 days immersion in DI water. The results are classified in classes, with class 0 (GT 0) representing no removal of paint and class 5 (GT 5) severe loss of paint. The number of blisters (m) is ranked from 0 (no blisters) to 5 (covered with blisters), the size of blisters g is ranked from 0 (not visible) to 5 (more than 5mm). ...208 Table 6.2.1. Compositions of different sol-gel systems and respective reference name of the samples. ...211 Table 6.2.2. Compositions of different sol-gel systems and respective reference name. ...214 Table 7.1.1. Addition step of inhibitor during preparation of Zr based sol-gel and respective reference names of coatings applied on AA2024 substrates. ...240 Table 7.1.2. Numerical data of capacitance and water uptake for different sol-gel coatings with inhibitors. 248 Table 7.2.1. Composition of different coatings tested on AA2024 ...263 Table 7.2.2. Composition and name of different coatings applied on AA2024 ...272 Table 7.2.3. Compositions of different sol-gel systems and respective reference name. ...283 Table 7.2.4. Compositions of different sol-gel systems and respective reference name. ...288
Preface
Corrosion can be generally characterized as a chemical degradation of materials under the action of external factors. Corrosion of metallic structures is associated with the loss of material under the action of environment and is a huge problem for many activities. It links a lot of fields like aerospace, naval, automotive, constructional and others. Material degradation due to corrosion calls for the replacement of damaged metallic parts, failure of equipment and engineering systems and can lead to fatal catastrophes. Corrosion of pipelines or tanks can lead even to ecological disasters. Therefore problems associated with corrosion cause significant economic impact and can lead to irretrievable human loses.
In order to fight problems associated with corrosion significant funds have been invested in the area of corrosion protection. Defense strategies against corrosion were created based on the knowledge of the corrosion susceptibility and corrosion activity of different materials. The first strategy is to determine the parameters that influence corrosion of metals. These parameters can be different such as atmosphere aggressiveness, temperature, type of water and solution. Successful control of such parameters can decrease corrosion, but it is possible only in some particular cases. In the majority of the circumstances it is not possible to avoid factors responsible for corrosion. In such way a second strategy can be applied, which is based on creating a protection system e.g. coating. Most of the protection using coatings is called “passive” corrosion protection and usually is only a temporal measure. Because of damaging, defects or ageing the coating “barrier” can fail, which results in appearance of corrosion. The second type of protection has chemical nature and is called “active” corrosion protection. In order to provide active protection, barrier coatings often are combined with inhibitive compounds which can significantly reduce the rate of corrosion of the materials. Cathodic protection is another kind of protection of metal structures such as buried pipelines and naval structures. However, this sort of protection can be applied only in some special cases.
The aerospace industry employs barrier coatings for corrosion protection of main structural alloys. The barrier coatings usually consist of an organic polymeric matrix with different fillers and pigments used to increase the lifetime of metallic materials and enhance physical properties like mechanical resistance to scratches and provide long term corrosion protection. Corrosion protection properties of coatings also depend on adhesion between metal and organic coatings. Even a good coating can not protect metal when adhesion is poor between them. In many cases a proper pre-treatment of metal surface is required before application of organic coatings because there is a lack of adhesion between organic coating and the substrate. Different sort of pre-treatments could be used like conversion coatings, anodized layers, sol-gel derived coatings and others.
Chromate based compounds were mostly used for making pretreatments for aerospace aluminum alloys and for active corrosion protection of metallic structures [1-3]. The combination of its high inhibiting efficiency and easy integration in conversion coatings or anodized layers made it a good inhibitor for decades. However, in spite of valuable properties, the use of chromates is dangerous for the ecology, environment and human health [4]. The exposure to chromates can cause cancer and genetic mutations, which make them significantly harmful for living organisms. Therefore recent environmental regulations almost banned completely the use of Cr (VI) in industry, thus opening a big discussion for the replacement of chromate base compounds and finding new methods of pretreatments and corrosion protection of metals. Hence, one of the challenges nowadays is to find effective pretreatments for aluminum alloys and environmentally safe inorganic or organic inhibitors to substitute the use of chromates in industry.
The main objective of the thesis is the development of active anti-corrosion pre-treatments for 2024 aluminum alloy on the basis of hybrid sol-gel layers. Successful fulfillment of the main objective required accomplishing of different particular objectives of the work presented below:
• Investigation of the localized corrosion activity of AA2024. The obtained results provide better understanding of the intimate aspects of the corrosion susceptibility of AA2024.
• Study of different potential corrosion inhibitors based on the corrosion investigation of the alloy using electrochemical and microstructural methods.
• Development of hybrid sol-gel pre-treatments for AA2024 and study the corrosion protective properties and mechanism of corrosion of the sol-gel coated alloy.
• Study the stability of the sol-gel systems and influence of the alloy surface preparation on the corrosion protective properties of the sol-gel coated alloy.
• Study passive and active corrosion protective properties of the sol-gel systems with the selected corrosion inhibitors and influence of inhibitor addition on the corrosion protective properties of different coatings.
• Investigation into new approaches of inhibitor incorporation and delivery that include a combination of the sol-gel and nanocontainers of inhibitors such as nanoporous titania-based pre-layer, nanocontainers of corrosion inhibitors with Layer-by-Layer assembled polyelectrolyte shells and nanostructured compound based on cerium and molybdate ions.
The thesis is constructed of four main parts: introduction, experimental, results and discussion and conclusions. The objective of the introduction is to give an insight on the issues related to corrosion and corrosion protection of aluminum alloys. The first chapter will be addressed looking at the nature of the corrosion activity of aluminum alloys and different examples of localized corrosion attack occurring on alloy surface. Subsequent topics include information available in literature on the corrosion protection of aluminum alloys using different inhibitors. Two major strategies, namely active and passive corrosion protection used for aluminum alloys, will be reviewed. In the second chapter of the introduction different alternative pretreatments are presented as examples of environmentally acceptable substitutions to toxic chromate based pretreatments used in industry. The details of the sol-gel processing, advantages of the sol-gel coatings over other pretreatments and their application are described in more details, as the main topic of the thesis is the use of the sol-gel coatings as pretreatments for 2024 aluminum alloy. The third chapter is devoted to the short description of the theoretical background of main testing methods used in studying the corrosion of 2024 aluminum alloy. The instrumentation, application and theoretical background of the techniques such as atomic force microscopy, DC polarization, electrochemical impedance spectroscopy and localized potentiometry are discussed.
The experimental part presented in the fourth chapter is an overview of the materials used in the study, sample preparation methods, preparation of the sol-gel formulation and application of the sol-gel films, experimental conditions of the main testing methods, corrosion tests and methods of surface and chemical analysis.
The results and discussion part is constituted of three chapters and presents the core of the thesis. The chapters are separated into three main topics accessing the corrosion susceptibility and corrosion protection of the bare alloy by different inhibitors, investigating the sol-gel systems as pretreatments for the alloy, and investigating the pretreatments with active corrosion protective properties. A study of the localized corrosion activity of the alloy was performed in the fifth chapter to more clearly understand the corrosion mechanism of the alloy. The knowledge of the localized corrosion activity has been used to select different inorganic (salts of rare earth elements and complex inorganic compounds such as Cerium molybdate) and organic (triazole and thiazole derivatives, effective complexants and chelates compounds) corrosion inhibitors for effective protection of the alloy.
The sixth chapter provides a detailed study of the sol-gel systems based on Zr and Ti alkoxides and organomodified silane as pretreatments for AA2024. The study includes the characterization of the sol-gel formulations with different compositions, detailed corrosion and microstructural investigation of the obtained sol-gel pretreatments. A study of different factors such as ageing of the sol-gel formulation and influence of AA2024 substrate preparation on the effectiveness of the corrosion protection conferred by the sol-gel coatings has been additionally performed. Mechanism of corrosion of the sol-sol-gel coated alloy has been suggested basing on the study of the gel pretreatments. Since
sol-gel coatings provide only passive corrosion protection different strategies have been developed to impart active corrosion protection properties to the sol-gel coatings. Although the monitoring of active corrosion protection and self-healing abilities of the coatings might be complicated by different factors, several model experiments have been performed using EIS and SVET techniques to prove the ability to monitor the inhibition of the corrosion process on the sol-gel coated alloy.
The seventh chapter presents studies of the sol-gel systems with direct inhibitor addition and incorporation of inhibitor in nanocontainers to impart active corrosion protection to the coatings. Corrosion protective properties of the sol-gel coatings with inorganic and organic inhibitors have been evaluated using different methods. The results showed that direct inhibitor addition in the sol-gel systems can not always be beneficial for the corrosion protection. Therefore the selected inhibitors were included in nanocontainers and combined with the sol-gel formulations to avoid disadvantages of direct inhibitor addition into the sol-gel coatings. The nanoporous titania-based networks with benzotriazole, silica-core based nanocontainers with polyelectrolyte multilayers containing benzotriazole, halloysites nanoclays with incorporated mercaptobenzothiazole and coated with polyelectrolyte multilayers, nanowires of cerium molybdate have been used as nanocontainers with inhibitors. The obtained sol-gel coatings were studied using electrochemical impedance and localized techniques to reveal active corrosion protection.
The last part of the thesis summarizes particular conclusions of the work and presents the recommendations for future work.
INTRODUCTION
1
Corrosion and corrosion protection of aluminum alloys
1.1 Corrosion susceptibility of aluminum alloys
Aluminum alloys have been the primary material of choice for different structural components of aircrafts due to the combination of valuable mechanical properties, known fabrication cost and low density [5,6]. Aerospace industry is one of the branches of engineering that uses high strength aluminum alloys for skinning and structural applications. However, due to the presence of additional alloying metals the corrosion susceptibility of alloys increases, especially in chloride solutions. Typical alloying elements are copper, silicon, iron, manganese, magnesium, zinc and others. The segregation of alloying elements during the solidification from the melt results in formation of different phases which are noble with respect to aluminum solid solution, thus making alloys susceptible to various forms of corrosion, especially in chloride containing solutions. Such inhomogeneity of the alloys results in appearance of localized corrosion activity which was a subject of research in many works [7-17]. One of the most commonly used aluminum alloys for skinning applications in aerospace industry is AA2024. It may contain up to 5 wt. % of copper, which is the main alloying element. There are two main intermetallic phases formed during the heat treatment of the alloy. One of the most abundant phases that occupy around 3% of surface area of alloy is Al-Cu-Mg phase with Al2MgCu nominal composition which is called phase. Among other intermetallics S-phase may occupy up to 60% of space. The other S-phase is Al-Cu-Fe-Mn, which is mainly presented by Al6(Cu-Mn-Fe) and Al2Cu2Fe intermetallic phases. Generally more noble elements like Cu and Fe are contained in such phases making them more noble compared to aluminum. However, the behavior of the S-phase can be different. Electrochemical measurements made on S-phase showed that corrosion potential in NaCl solution is more active compared to Al-4Cu solid solution [18]. Based on these measurements one can conclude that during the corrosion exposure of AA2024 the S-phase will be anodically polarized, which will cause its dealloying. Dealloying is the process when more active elements “run away” or dissolve from metallic phase leaving more noble elements inside [15]. As a result of such process Mg dissolves and copper is left inside the phase changing the electrochemical behavior of S-phase in AA2024 from anodic to cathodic and promotes a localized pitting activity.
The nature of the corrosion activity of aluminum alloys becomes clear when making analysis of the composition and electrochemical behavior of the main constituents. Aluminum by itself is a very reactive metal that has a low standard reduction potential - 1.66V [17], though under normal conditions it is covered by a thin amorphous oxide film which protects it against corrosion in neutral environment. However, the presence of acids or alkalis can change its corrosion behavior. In water solutions the thermodynamics of
![Figure 1.1.1. Potential - pH equilibrium diagram for the system aluminium – water at 25ºC [19]](https://thumb-eu.123doks.com/thumbv2/123dok_br/15733724.1071762/31.892.222.651.355.788/figure-potential-equilibrium-diagram-for-system-aluminium-water.webp)

![Figure 2.5.4. Scheme of chemical bond formation between metal, sol-gel and paint [188]](https://thumb-eu.123doks.com/thumbv2/123dok_br/15733724.1071762/64.892.163.753.109.346/figure-scheme-chemical-bond-formation-metal-sol-paint.webp)
![Figure 3.3.1. A block diagram of the instrumentation used for EIS. Adapted from ref. [284]](https://thumb-eu.123doks.com/thumbv2/123dok_br/15733724.1071762/85.892.251.628.249.500/figure-block-diagram-instrumentation-used-eis-adapted-ref.webp)