Credit Ratings and
Corporate Diversification:
The Aftermath of the
Global Financial Crisis
Diana Martins Ventura
Dissertation written under the supervision of Dr. Diana Bonfim
Dissertation submitted in partial fulfilment of requirements for the
International MSc in Management with Major in Corporate Finance,
i
CATÓLICA-LISBON School of Business and Economics
Credit Ratings and Corporate Diversification: The Aftermath of the
Global Financial Crisis
by Diana Martins Ventura
December 2018
Abstract
As ten years have passed by since the 2007-2008 world financial crisis, one of the largest ones in recent history, this thesis investigates whether credit ratings still have an informa-tional effect on diversified firms. That is, if credit ratings still are an useful tool to coun-teract the diversification discount often documented in literature.
Thus, to study this research question, two main hypotheses are developed. The first one predicts that diversified rated firms are less affected by the diversification discount than unrated ones. The second one predicts that higher rated diversified firms are less affected by diversification discount than low-rated ones.
The employed approach to study these hypotheses is through OLS regressions with data for 39,174 firm-years from 1985 to 2016. These regressions are performed both for rated and unrated subsamples and then dividing the timeframe into 3 periods (pre-crisis, crisis, post-crisis). In this context, three analysis are performed differing only in the crisis period definition. The first analysis encompassed the crisis years as 2007-2008, whereas the sec-ond and third contains 2007-2009 and 2008-2009, respectively.
The results obtained indicate that both hypotheses hold true in the pre-crisis period, which denotes a mitigation in the diversification discount for rated and investment grade rated firms. Nonetheless, in the post-crisis period, only the unrated diversification coefficient is significant. Therefore, this indicates that ratings credibility was somehow undermined as a clear difference in its role before and after the crisis is denoted. These results are consistent with the intertemporal robustness regressions performed in this dissertation.
Keywords: Financial crisis, Diversification, Diversification discount, Ratings, Credit
Rating Agencies, Information Asymmetry
ii
CATÓLICA-LISBON School of Business and Economics
Credit Ratings and Corporate Diversification: The Aftermath of the
Global Financial Crisis
por Diana Martins Ventura
Dezembro de 2018
Resumo
Após dez anos desde a crise financeira de 2007-2008, esta tese investiga se as notações de crédito ainda têm um efeito informativo sobre empresas diversificadas. Isto é, se as notações de crédito ainda são uma ferramenta útil para contrariar o desconto de diversifi-cação, frequentemente documentado na literatura.
Assim, para estudar esta questão científica, são desenvolvidas duas hipóteses basilares. A primeira prevê que empresas diversificadas, possuidoras de uma notação de crédito, se-jam menos afetadas pelo desconto de diversificação do que as que não contêm. A segunda hipótese antecipa que empresas diversificadas com classificações mais elevadas sejam menos afetadas pelo desconto de diversificação do que as de baixa classificação.
Para conduzir este estudo, usa-se como metodologia regressões MQO com dados para 39.174 empresas-ano de 1985 a 2016. Essas regressões comparam empresas classificadas com não-classificadas durante 3 períodos: pré-crise; crise; pós-crise. Foram feitas três análises que diferem apenas nos anos definidos como crise. A primeira análise considera os anos de crise de 2007-2008, enquanto a segunda e terceira definem como 2007-2009 e 2008-2009, respetivamente.
Os resultados obtidos indicam que ambas as hipóteses são verificadas no período pré-crise, o que denota uma atenuação no desconto de diversificação para empresas classifi-cadas e de elevada qualidade de crédito. No entanto, no período pós-crise, apenas o coe-ficiente de empresas diversificadas não classificadas se torna significativo. Portanto, isto sugere uma perda de credibilidade das classificações, visto que há uma clara diferença no seu papel pré-crise e pós-crise. Finalmente, estes resultados são robustos com regressões intertemporais realizadas nesta tese.
Palavras-chave: Crise Financeira, Diversificação, Desconto de diversificação, Notações de Crédito, Agências de Notação de Crédito, Informação Assimétrica
iii
Contents List
1. Introduction ... 1
2. Literature Review ... 6
2.1 Corporate diversification on firm value... 6
2.2 Credit Ratings ... 8
3. Data and Methodology ... 10
3.1 Data extraction:... 10
3.2 Data universe and restrictions... 12
3.3 Excess value construction ... 16
4. Results ... 17
4.1 Descriptive statistics ... 17
4.2 Univariate analysis ... 18
4.3 Hypothesis development... 19
4.4 Multivariate analysis for H1 ... 20
4.5 Multivariate analysis for H2 ... 27
4.6 Robustness checks ... 28
5. Concluding Remarks ... 32
6. Reference list ... 36
iv
Appendices
Appendix 1: Ratings distribution for diversified and non-diversified firms...39 Appendix 2: Yearly Average Ratings for analysis 2 (2007-2009) and
analysis 3 (2008-2009) ...40 Appendix 3: Industry distribution for diversified and non-diversified firms...41 Appendix 4: Multivariate tests for the diversification discount for ratings and financial crisis dimension - H1 - Analysis 2-...42 Appendix 5: Multivariate tests for the diversification discount for ratings
levels and financial crisis dimension - H2 - Analysis 2-...43 Appendix 6: Multivariate tests for the diversification discount for ratings
levels and financial crisis dimension - H2 - Analysis 3-...44 Appendix 7: Robustness checks: Intertemporal Analysis - Analysis 2-...45 Appendix 8: Robustness checks: Intertemporal Analysis - Analysis 3-...46
v
List of figures
Figure 1 - S&P credit rating distribution of 1485 rated companies...14 Figure 2 - Yearly Average Rating...15 Figure 3 - Industry Distribution...15
vi
List of tables
Table 1 - Definition of variables...10
Table 2 - Numerical Score...11
Table 3 - Diversification distribution by year...13
Table 4 - Summary Statistics...17
Table 5 - Excess Value Univariate Analysis...18
Table 6 - Pairwise Correlation Matrix...20
Table 7 - Multivariate tests for the diversification discount for ratings dimension -H1...22
Table 8 - Multivariate tests for the diversification discount for ratings and financial crisis dimension -H1- Analysis 1...24
Table 9 - Multivariate tests for the diversification discount for ratings and financial crisis dimension - H1-Analysis 3...26
Table 10 - Multivariate tests for the diversification discount for ratings levels and financial crisis dimension - H2 - Analysis 1-...29
vii
List of abbreviations
Capex – Capital Expenditures CEO – Chief Executive Officer CRAs – Credit Rating Agencies
EBIT – Earnings before interest and taxes MQO – Mínimos Quadrados Ordinários
NAICS – North American Industry Classification NPV – Net present value
OLS – Ordinary Least Squares
SEC – Securities and Exchange Commission SIC – Standard Industrial Classification Code S&P – Standard and Poor’s
viii
Acknowledgments
I would like to start this section by thanking Dr. Diana Bonfim for all her valuable inputs and guidance. All her comments were very much appreciated and considered.
To my close friends a special thanks for making me realize and enjoy all the life that lies beyond writing a master thesis. Having regular fun moments with you helped me keep the balance and enjoy this self-challenging path. A special word of thanks to Laura for accompanying and supporting me through every up and down in the Católica journey and to Ana Carolina for being the friend that dreams are made of. To Franziska, I would like to show my gratitude for reviewing my dissertation so carefully and altruistically.
To Eduardo, I want to thank for all his patience, critical thinking and affection throughout the entire process. I would also like to express my gratitude for him being the person I could talk with regarding my thesis, no matter the hour or the day of the week.
À minha família e em especial aos meus pais, o agradecimento que se impõe. Obrigada por fazerem dos meus sonhos, os vossos sonhos. Obrigada pelo apoio constante e o amor incondicional não só nesta, mas em todas as fases da minha vida. Como tal, dedico-vos esta tese.
ix
Põe quanto és no mínimo que fazes.
Ricardo Reis, in "Odes"
1
1. Introduction
For this dissertation, two controversial topics in literature are merged. These top-ics are the diversification on firm value and the role of credit ratings in the market. To take this analysis even further and make it more interesting for the present days, I specif-ically focus on the interaction of these two topics after the global financial crisis.
Since this was one of the most dramatic and impactful crises from 1929 onwards, it is relevant to assess in what extent do the results change after 10 years of the crisis peak. In other words, it is interesting to understand if credit ratings still are an useful tool to counteract diversification discount or if its credibility was somehow shaken due to Credit Rating Agencies (CRA’s) questionable conduct.
This is because the global financial crisis helped to uncover that due to the issuer-shopping revenue model, that was in practice among the CRA’s oligopolistic market, there were inflated ratings (Bolton, Freixas, & Shapiro, 2012). This was later proven at the crisis peak moment when there were massive downgrades from rated instruments. Some of them even experienced a decrease from being highly rated to turn into junk level in the same day (Soroushian, 2016). Thereby, this finding brought suspicion to the market regarding the ratings independence and trustworthiness. As one of the CRA’s analysts put it “[The investment] could be structured by cows and we would rate it” (Bolton et al., 2012).
So, in the periods after the crisis there was the acknowledgment of the need of a rating refinement. This happened with the 2010 Dodd-Frank act alongside with several other measures created to eradicate any persisting conflicts of interest (Bolton et al., 2012; deHaan, 2017). On the CRA’s perspective, they are also interested in recovering the rep-utation they had before the crisis. This is because the cornerstone of their model is de-pendent on the trust that different parties give to them (White, 2010). Only this way the CRA’s can keep dealing with sensitive information and releasing ratings perceived as credible informational sources. Thus, it is suitable to analyze whether the effort made on rating refinement was enough to contain the reputational damage spillover effect or if the market perceives the rating notations differently than before the crisis (deHaan, 2017).
On the other hand, diversification has often been a widely debated topic in the literature. Academics are not being able to reach a consensus regarding the diversification impact on corporate value. Whether it is a value-enhancing strategy (Chandler, 1978; G.
2
Lewellen, 1960), if it destroys value (Jensen, 1986; Lamont & Polk, 2002; Stulz, 1990) or if it does not have an impact at all because as the shareholder value decreases, the bondholder wealth increases (Mansi & Reeb, 2002).
Therefore, the credit ratings emerge as a tool to clarify the impact that diversifi-cation has on corporate value and consequently eliminate any mispricing caused by di-versification discount. In other words, rating notations contribute to understand whether firms are being more valuable as stand-alone businesses or if the sum of their segments proves to be higher (Chou & Cheng, 2012).
In this context, this dissertation aims at analyzing the impact of credit ratings on corporate diversification especially after the financial crisis. For that purpose, two main hypotheses are developed.
Firstly, if the credit ratings deliver what they promise they should be informative and unbiased public opinions regarding the firms’ creditworthiness (Whited, 1992). So, intuitively, one should expect that, on average, in a ceteris paribus scenario rated con-glomerate firms are less affected by diversification discount than unrated ones. In fact, this transparency increase brought by the rating notations should help to mitigate infor-mation asymmetry problems among distinct layers of stakeholders and, thus, rated diver-sified firms are less prone to diversification discount.
So, I analyze the veracity of this prediction with Campa & Kedia (2002) approach by regressing excess value on: a diversification dummy (DIV), the number of business segments reported by each firm (Segn), the firm size (Size), leverage (Leverage), Ebit/to-tal sales (EBIT) and Capex/toEbit/to-tal sales (Capx). Moreover, I include in the regression the one and two lag variables for firm size, investment and profitability as a robustness meas-ure since their past values could be impacting the firm’s characteristics in time t.
To study the impact of ratings throughout the crisis, I split the rated conglomerate firms’ sample into a pre- and post- 2007-2008 financial crisis period. In this context, its assessed whether the results remain similar, or if the crisis undermined credit ratings rep-utation and, thus, they are no longer an useful tool to increase transparency while miti-gating asymmetry informational problems.
The second hypothesis predicts that, on average, in a ceteris paribus scenario, high rated conglomerate firms are less affected by diversification discount than low rated ones. It is understandable that if ratings matter, then there should be a positive relation between credit rating levels and less diversification discount. Moreover, this study is also extended
3
to analyze if after the financial crisis having high rating levels matters on the diversifica-tion issue or if they were somehow discredited.
Beginning with the equally weighted yearly average ratings, I find that diversified firms have, on average, better ratings. Notwithstanding, both diversified and focused firms had a notation decrease during the financial crisis which they did not recover in the years following the crisis. This finding suggests that, on average, before the crisis there were inflated ratings. However, considering the total sample, the average rated firms are found to be worthier than the average unrated ones, which indicates a positive informa-tional effect brought by rating notations.
On the other hand, the average diversified firms are valued less than the average focused firms. Moreover, even when controlling for other factors as firm’s leverage, size, EBIT, CAPEX and their one and two lag variables, there is evidence for a diversification discount. Nonetheless, this discount is attenuated for rated firms as expected.
The same result is obtained for the period before the financial crisis. Notwith-standing, during the 2007-2008 financial crisis the diversification coefficient, on average, remains negative, but it is no longer significant, as well as most of the variables analyzed in the model. So, the excess value variable is no longer suitably explained by the model and the division between rated and unrated does not cause any apparent impact on the model quality. This seems to suggest that during the financial crisis there were confound-ing effects, as it is common in crisis periods, which are not captured in this model.
Regarding the post-financial crisis period, the average diversification coefficients are both negative, but only the unrated one is significant. This indicates that credit ratings suffered a spillover reputational damage effect due to one of the biggest world financial crisis, that many denote as the CRA’s fault. Thus, most probably the credit rating nota-tions had, as a crisis consequence, a lack of credibility from the market and investors.
To take several approaches into consideration, I also perform the same regression as before, but with different divisions of the financial crisis timeframe. This way, I test if the results remain the same when considering the financial crisis period in 2007 to 2009 (analysis 2) and in 2008 to 2009 (analysis 3). Considering the financial crisis as in 2007-2009 is relevant since it also encompasses 2007-2009 which is a recession year for most of the world economies, though China and India were starting to recover (Verick & Verick, 2010). Furthermore, considering it as in 2008-2009 is also valuable because the crisis only unfolded by the end of 2007 (Verick & Verick, 2010).
4
As in the first analysis, the pre-financial crisis period denotes, on average, a di-versification discount for both rated and unrated firms, which is mitigated for the rated firms. This suggests a value-enhancing effect brought by rating notations before the crisis, (though we should acknowledge that there are costs associated with obtaining a rating, which might be disproportionately high for the smaller firms). Yet, in the post-financial crisis period the only diversification coefficient that is significant is the unrated one. So, once more, these findings indicate that the CRA’s are being penalized by the questionable behavior they had before the crisis that resulted in inflated ratings.
However, these three analyses differ in the results obtained during the crisis as well as on the definition of the crisis period. In model 1, the financial crisis period is denoted as 2008 while in analysis 2 the crisis period is considered solely as 2007-2009 and the third one is defined as 2008-2007-2009.
The first and second analysis have matching results. But, on the third analysis (2008-2009), the average diversification coefficients for rated and unrated samples still have explanatory power. However, the average rated coefficient turns positive and sug-gests a diversification premium during the crisis. This result is in line with the literature arguing that conglomerate firms are better equipped in terms of financing and investment and also benefited from competitive advantage as opposed to focused firms when there was the financial crisis (Kuppuswamy & Villalonga, 2010). Consequently, the corporate value of diversified firms is said to have increased during the crisis.
However, this result is questioned when taking a total sample approach instead. In this case, the average coefficients are no longer significant during the crisis. This may indicate that the previous results are due to some composition effect when splitting the sample into rated and unrated. In fact, if taking the total sample approach, the three anal-ysis coincide in the results derived. Nonetheless, regardless of the approach taken, every model shows the same clear difference between the importance of credit ratings role be-fore and after the crisis.
Concerning hypothesis 2, and despite the fact speculative firms are insignificant in every analysis and time period, the evidence suggests a positive relation between in-vestment grade rating levels and less diversification discount. When one inserts the finan-cial crisis into the problematic, then the results remain unaltered for before the crisis, but are not verified for the period after the crisis. Thereby, this leads to question the
5
informational role of the credit ratings after the crisis since these results lead to believe that some of their reputation was undermined. Regarding the speculative firm’s case, rep-resenting 33% of the rated sample, its lack of significance may indicate that the diversi-fication discount problematic for speculative firms is not as crucial as for investment grade firms.
Finally, to ensure the robustness of my results, I perform some intertemporal re-gressions. To analyze H1 veracity, I constructed a dummy named “After” to capture the firms that were unrated and later became rated. So, after constructing an interaction vari-able between “After” and the diversification coefficient (DIV), the result obtained is that the diversification discount is attenuated when firms become rated.
For analysis 2 and 3, the interaction coefficient, on average, is still positive and significant. However, and as expected, this coefficient turns, on average, negative and insignificant for the post-crisis period in every analysis. Thus, this finding suggests that, on average, after the financial crisis, firms becoming rated or not does not impact corpo-rate value on conglomecorpo-rate firms.
For H2 cross-check analysis, I created two dummy variables named “Upgrade” and “Downgrade”. Their role is to compare firms’ ratings in time t with the ratings in time
t-1. Therefore, a dummy interaction is created with the diversification coefficient and
each of these two dummies.
In this context, the results obtained suggest that, on average, when there is a rating decrease the companies are penalized for it, whereas the reverse happens for a rating up-grade. Hence, it seems that there is an additional incentive for diversified firms to pursue higher ratings as the diversification discount is reduced. Nonetheless, this result is ques-tioned for the period after the financial crisis since that, on average, the interaction vari-ables are no longer significant. This finding suggests that in the post-crisis period there is no distinction between rating levels.
This dissertation complements the literature on diversification intertwined with ratings, as in Chou & Cheng (2012). The results suggest the existence, on average, of the so-called diversification discount, which is attenuated for rated firms. Moreover, these findings also contribute to the literature that argues in favor of the positive benefits brought by credit ratings to the market in a ceteris paribus scenario. For instance, as dis-cussed by Kisgen (2006), credit ratings are able to increase transparency while decreasing asymmetric information problems between several layers of stakeholders.
6
Nonetheless, this dissertation also builds on recent literature (Alp, 2013; Bolton et al., 2012; Partnoy, 2017) since the results indicate that, on average, there were inflated ratings before the crisis and that the rating refinement was not able to recover the same reliance and credibility for rating notations as there were before the crisis.
All in all, my results intertwin two hot topics that are still very controversial and relevant on corporate decisions nowadays, particularly on diversified firms that are con-sidering their rating status.
This dissertation is distributed as follows. Section 2 discusses previous papers on the studied topic to enable a better understanding of what has been done in the past and builds on it. Section 3 gives a detailed explanation for the data and methodologies used. Section 4 provides descriptive statistics, univariate analysis and multivariate analysis aligned with some rationales behind the results. Section 5 englobes some concluding re-marks and possible further extensions to this dissertation.
2. Literature Review
2.1 Corporate diversification on firm value
According to the Modigliani-Miller theorem, capital structure decisions of a com-pany do not have an impact on its value. However, this would only hold under perfect capital markets which implies that a set of conditions would need to be satisfied (Modigliani & Miller, 1958). Thereby, it is widely acknowledged that, in the real-world setting, the diversification decision impacts the firm value. It is only controversial and debated among academics on how it does so.
One of the most suggested benefits regarding diversification on corporate value concerns the increase in efficiency obtained in the production lines as opposed to focus firms (Chandler, 1978). Not only those companies profit from scale economies (Ekkayokkaya & Paudyal, 2015), but can also enjoy corporate resources sharing, even the intangible ones such as know-how. This will then have several advantages on topics such as benefiting from improved organizational fit structure (Campa & Kedia, 2002; Matsusaka, 2001); decrease the deadweight costs of capital (Campa & Kedia, 2002; Perold, 2005) and even impact at the risk management level (Chou & Cheng, 2012; Lin, Pantzalis, & Park, 2007).
7
Furthermore, the value-enhancing effects of diversification are also extended to the capital structure decision. Indeed, multi-segment firms are able to create an internal capital market in order to finance themselves (Stein, 1997). So, in theory, diversified firms will have more leverage than single-segment firms due to their higher debt capacity and because of benefiting from tax shields (W. G. Lewellen, 1971).
Thus, following this line of reasoning, Servaes (1996) believes that when diversi-fying the main objective is to increase the shareholder wealth. By eliminating total exter-nal market dependence when financing themselves, they are also avoiding some infor-mation asymmetry problems that would have arisen on external markets.
Nevertheless, there is a stream of literature embodied by May (1995) that suggests that managers are not totally unbiased when making such type of decisions. It is even argued that when CEOs remain in the position for many years or have more personal wealth invested, they are more prone to diversify. Hence, personal risk is considered when reducing firm risk, which means that they can opt for negative net present value (NPV) projects for the firm that are actually increasing their personal wealth (Jensen & Meckling, 1976). This is because shareholders are more capable of diversifying their port-folio in the capital market, while managers are dependent on the firm level to do so (May, 1995).
Along with the perverse compensation incentives managers can have when decid-ing to diversify, there is plenty of literature argudecid-ing that diversification destroys firm value. The reasoning behind this is that conglomerate firms tend to invest inefficiently due to the cross-subsidization across highly performing segments to inefficient ones (Berger & Ofek, 1995; Rajan, Servaes, & Zingales, 2000). Therefore, Berger & Ofek (1995) find that diversified firms often have less profitable segments compared to focused companies. Similarly, Stulz (1990) reinforces this argument by proving that multi-seg-ment firms overinvest in divisions characterized by a lack of investmulti-seg-ment opportunities.
The overinvestment issue may be partially explained by the fact that when firms diversify they may start laxing their investment constraints due to the disposal of several resources and so can validate projects that do not create much firm value (Stulz, 1990). Likewise, Jensen (1986) argues that multi-segment firms engage in much more wasteful investments, projects with negative NPV, than they would if they had their divisions split up.
8
There is also the argument that conglomerate firms because of their consolidated nature, make harder to immediately detect harmful segments (Chou & Cheng, 2012). This increased structure complexity leads to lower transparency and, thus, drives agency costs between managers and stakeholders (Hadlock, Ryngaert, & Thomas, 2001).
Notwithstanding, there is a paper by Thomas (2002) that demonstrates that diver-sification does not cause an increase in information asymmetries nor forecasting errors are higher. They are practically the same as matching focused firm portfolios. Therefore, it is possible to consider that there is still a long path to go to reach a consensus regarding the impact of diversification on corporate value. There is even a strand of literature that suggests that diversification does not have an impact on firms’ value since the shareholder wealth decreases with diversification as the firm risk declines, while the bondholder value rises. This leads to the conclusion that all equity financed firms do not suffer from a di-versification discount (Mansi & Reeb, 2002).
In this context, when companies decide to diversify, they take the risk of not being totally understood both by the market and skeptical investors concerning diversification benefits. Hence, most of the times this misalignment results in the fact that the company is not valued at its true worth. So, very often the diversifying decisions are taken as value destroying even if it is not the case (Campa & Kedia, 2002). Indeed, much of these issues are to blame to asymmetric informational problems. Thus, the insertion of credit ratings appears as an attempt to increase transparency and consequently solve the problematic of whether the firms are more valuable as stand-alone businesses or if the sum of their seg-ments proves to be higher.
2.2 Credit Ratings
In fact, when a company asks for a rating notation it is requesting an informed and unbiased public opinion regarding its creditworthiness. By doing this, the firms are bridg-ing the gap between managers and firm stakeholders for the sake of transparency increase without compromising their competitive advantage and strategic plans (Kisgen, 2006). As a matter of fact, the attribution of a notation is backed up by a considerable amount of sensitive information that helps improving the ratings’ reliability, giving an useful meas-ure of the firms risk as well as its futmeas-ure prospects (Whited, 1992).
This disclosure intention is driven by the fact that the company wants to clarify the impact that the diversification is having on the firm value and, consequently, eliminate
9
any mispricing caused by the diversification discount. This enhanced transparency is rel-evant because as argued by Campa & Kedia (2002) having a discount does not mean that diversification is synonym of value loss. The endogenous decision to diversify is affected by numerous firm characteristics. This is the reason why, in the same exogenous condi-tions, some companies are able to derive value from diversification and others are not. Thereby, one can easily understand the importance of credit ratings in attenuating infor-mation asymmetries caused by omitted variables between stakeholders and, thus, provide an useful tool to assess the true impact of diversification in each firm.
Yet, credit ratings also have their drawbacks that became particularly visible after the global financial crisis. The so-called sub-prime loan crisis, mainly due to unstainable debt in the market, helped to uncover that the credit rating agencies (CRA’s) were not as impartial as they should have been when attributing notations due to the issuer-shopping model (Bolton et al., 2012). This behavior has led to inflated ratings in which the investors trusted without thinking twice or analyzing other indicators. This heavy dependence on ratings occurred also because the CRA’s were entitled to receive classified information under the SEC’s Regulation Fair Disclosure (Jorion, Liu, & Shi, 2005). Hence, they were intuitively used as an assessment tool of firm quality. But as expressed by one of the CRA’s analysts “[The investment] could be structured by cows and we would rate it”(Bol-ton et al., 2012).
So, when the crisis crashed there were innumerable instruments previously as-sessed as high quality that suffered a massive downgrade, even to junk notation (Soroushian, 2016). Therefore, all these dramatic events undermined the CRA’s reputa-tion to be reliable (Utzig, 2010).
Then, after the global financial crisis there was a rating refinement to increase the information effect that notations provided, as well as stricter regulations to eliminate pre-vious contradictory incentives (Tang, 2009). One of these measures to eradicate conflicts of interest when attributing rating notations became known as the 2010 Dodd-Frank act (Bolton et al., 2012; deHaan, 2017). This and several other measures prevented that hold-ing a rathold-ing would become meanhold-ingless in the market and there would no longer be an informational role of ratings in companies’ value. This loss of reputation would also not suit CRA’s interests since confidence is the cornerstone of their revenue model (White, 2010). If the ratings go on being unreliable and an unrealistic assessment of the true firms’
10
net worth, then CRA’s might incur into legal costs as well as a loss in their integrity that might cause spillover effects in their revenue model (deHaan, 2017).
Notwithstanding, there are recent papers that question the trustworthiness and in-dependence of ratings after the crisis. Indeed, recent literature on this topic argues that the rating refinement, done after the financial crisis, was not enough to stop the reputa-tional damage on ratings, due to CRA’s questionable conduct in the pre-crisis period (Partnoy, 2017; Utzig, 2010).
So, it is relevant to analyze if after the financial crisis the credit ratings can still be used as an informational tool that mitigates information asymmetries problems regard-ing the diversification effect on firm value.
3. Data and Methodology
3.1 Data extraction:
The data demanded for this study is entirely withdrawn from North American Compustat database. This extraction was done for different layers, namely, at the firm level, segments level and the corresponding firm rating notations. The aimed timeframe
Variable Definition
Market Value of Equity Common Shares*Annual Fiscal Year Price Close (Compustat: item 25*item 199) Book Value of Debt Long Term Debt+ Debt in Current Liabilities (Compustat: item 9+item34)
Actual Value Market Value of Equity + Book Value of Debt (Compustat: (item 25*item 199)+(item 9+item34)) Market to Sales Ratio (MSR) Actual Value/ Total sales (Compustat: ((item 25*item 199)+(item 9+item34))/item 12)
Market to Assets Ratio (MAR) Actual Value/ Total Assets (Compustat: (item 25*item 199)+(item 9+item34)/item 6) Imputed Value (I(V)) Segment sales (assets)*Median market to sales (assets)
Excess Value Ln(Actual value/Imputed value)
Leverage Long term debt/Total assets (Compustat: item 9 * item 6)
Size Log(Total Assets) (Compustat: log(item 6))
EBIT EBIT/ Total sales
Capx Capex/totalSales (Compustat: item 128 * item 12)
Fyear Fiscal year of the current fiscal year-end month
Diversification (DIV) Dummy variable that takes the value of one if a firm reports more than one segment, and zero otherwise
SIC Standard Industry Classification Code
NAICS North American Industry Classification Code
Segn Number of segments the firms report
Israted Dummy variable that takes the value of one if a firm is rated, and zero otherwise
InvestmentGrade Dummy variable that takes the value of one if a firm is rated from BBB- level onwards, and zero otherwise DIV*Ratlvl Interaction term between the diversification dummy and the rating levels
b.crisis Dummy variable that takes the value of one if the year is below 2008, and zero otherwise a1.crisis Dummy variable that takes the value of one if the year is above 2009, and zero otherwise b3crisis Dummy variable that takes the value of one if the year is below 2007, and zero otherwise
Table 1 - Definition of variables
The data demanded for this study was withdrawn from North American Compustat database for a timeframe from 1985 to 2016. The data was retrieved both at the firm level and segments level and the corresponding rating notations. This table reports the definition of each variable and between brackets there is explained the Compustat items used to compute each one.
11
was from 1985, when the ratings were initially issued, until the end of 2017, to complete ten years after the beginning of the financial crisis. However, since the ratings were only available until February 2017 the timeframe used is shortened to January 1985 until De-cember 2016. These 31 years enable a deep analysis of the pre- and post- financial crisis period.
At the firm level, I extracted the annual fundamentals such as both long and short-term debt, total assets, capex, EBIT, sales, close price and common shares outstanding to compute the market capitalization. In addition, the same fundamentals are withdrawn but at the segments level. This culminated in the construction of the variables shown in Table 1.
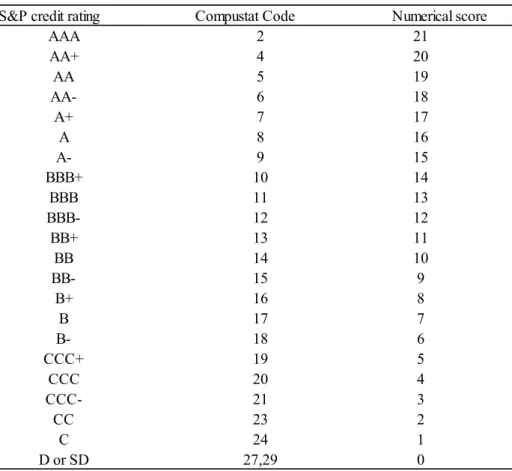
Finally, I also took the S&P Long-Term Issuer Credit Rating notations for the studied timeframe. This is relevant since it is an useful tool to analyze whether firms are credit worthy or not, that is, if they are able to honor their financial obligations. The rat-ings are converted into numerical score as explained in Table 2.
S&P credit rating Compustat Code Numerical score
AAA 2 21 AA+ 4 20 AA 5 19 AA- 6 18 A+ 7 17 A 8 16 A- 9 15 BBB+ 10 14 BBB 11 13 BBB- 12 12 BB+ 13 11 BB 14 10 BB- 15 9 B+ 16 8 B 17 7 B- 18 6 CCC+ 19 5 CCC 20 4 CCC- 21 3 CC 23 2 C 24 1 D or SD 27,29 0
Table 2 - Numerical Score
This table reports the S&P ratings conversion into numerical score that goes from 0 to 21. The higher the rating the higher is the numerical score. This is for a total of 39174 firm-years which contain 11864 rated firm-years.
12
Thus, a company given an “AAA” rating is assigned a numerical score of 21, whereas the lower grade firms are converted into a 0. Therefore, the firms with higher credit ratings are also the ones with higher numerical scores.
3.2 Data universe and restrictions
After merging these three files, there are some restrictions to be satisfied. Firstly, all the financial services firms (NAICS:520000-529999; SIC:6000-6999) are eliminated due to their distinct nature on valuation methods, and also because the majority of them do not contain data on EBIT (Berger & Ofek, 1995). Likewise, all the firm-years that report negative assets and sales less than 20 million are also excluded to keep the database unbiased from the results being driven by small firms. In addition, all the years that do not provide information on capital are deleted.
Another elimination criterion excludes companies which do not have the segment sales within 1% of total firm sales. Whenever this rule applies, it means a data error or a large discrepancy occurs between the firm-level accounts and the segments data. Addi-tionally, when a company reports the same segment more than once a year, the observa-tions that report the most recent source-date are kept. This duplication was due to the fact that the firms’ reports contain the information for the present year as well as for the past three more recent years, leading to a duplication. Hence, keeping the observations with the most recent source-date enables a more reliable analysis since the reported figures will be the most updated and, thus, they will be the ones that provide the best picture of the firm’s segments shape in every point in time. Finally, the firm years that do not report whether they are rated or not, are eliminated.
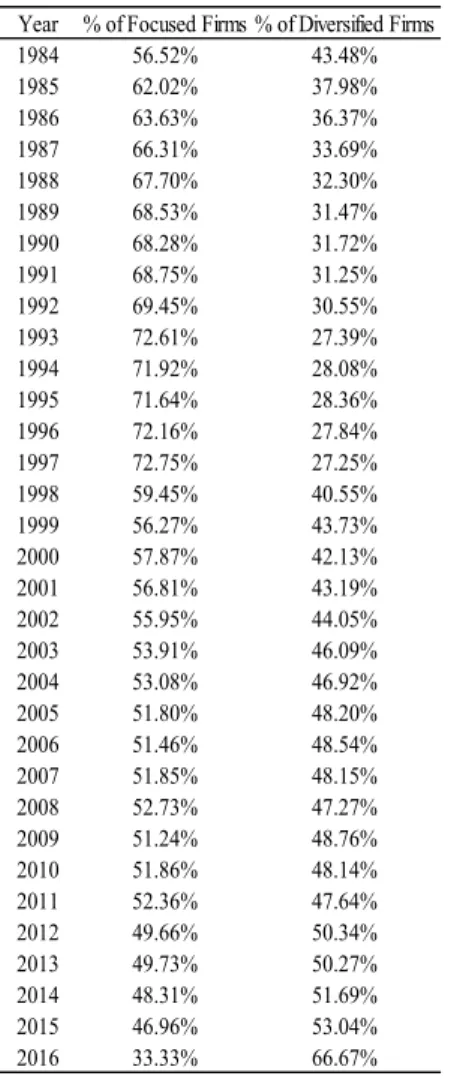
Hence, after all these deletion criteria are satisfied, I remain with a total of 39,174 firm-years, which comprises 3,793 different companies. Furthermore, this sample con-tains 14,424 conglomerate firm-years, the ones that report more than one business seg-ment per year, as opposed to 24,750 focused ones. A closer examination can be taken in Table 3 where the sample distribution by year is displayed.
From Table 3, one can observe that the percentage of focused firms decreases considerably, particularly after 1997. Thus, one can infer a diversification trend across the years. In fact, across the sample there are 28% of firms that changed their diversifica-tion status. Particularly, 687 firms become diversified whereas 481 refocused (unreported results).
13
Taking the ratings into perspective, there are 1,485 rated firms which are com-posed by 947 diversified firms. Therefore, 64% of rated firms are diversified. On the other hand, there are 3,497 unrated companies throughout the years, which encompass 1,361 diversified firms. So, 39% of unrated firms are diversified. These statistics suggest that diversified firms consider ratings as an useful informational tool, which is in line with the argument that credit ratings insertion may be an attempt to increase transparency between stakeholders and mitigate the informational asymmetry problems.
Nonetheless, the unrated subsample is nearly 2.36 times larger than the rated one. Figure 1 shows the ratings distribution across the entire sample.
The rating notations that appears the most throughout the sample period is BBB and A with a weight of roughly 12% each in the rated subsample, which corresponds to a numerical score of 13 and 16. In fact, the rated sample is characterized by having
Year % of Focused Firms % of Diversified Firms
1984 56.52% 43.48% 1985 62.02% 37.98% 1986 63.63% 36.37% 1987 66.31% 33.69% 1988 67.70% 32.30% 1989 68.53% 31.47% 1990 68.28% 31.72% 1991 68.75% 31.25% 1992 69.45% 30.55% 1993 72.61% 27.39% 1994 71.92% 28.08% 1995 71.64% 28.36% 1996 72.16% 27.84% 1997 72.75% 27.25% 1998 59.45% 40.55% 1999 56.27% 43.73% 2000 57.87% 42.13% 2001 56.81% 43.19% 2002 55.95% 44.05% 2003 53.91% 46.09% 2004 53.08% 46.92% 2005 51.80% 48.20% 2006 51.46% 48.54% 2007 51.85% 48.15% 2008 52.73% 47.27% 2009 51.24% 48.76% 2010 51.86% 48.14% 2011 52.36% 47.64% 2012 49.66% 50.34% 2013 49.73% 50.27% 2014 48.31% 51.69% 2015 46.96% 53.04% 2016 33.33% 66.67%
Table 3 - Diversification distribution by year
This table reports the diversification trend from 1984 to 2016 for a total of 39,174 firm-years, which 14,424 are conglomerate firm-years whereas the remaining 24,750 are focused.
14
approximately 67% of the total sample as investment grade ratings. Regarding the equally weighted yearly average rating it is 12.68 which also means a BBB investment grade.
Looking at the ratings for diversified firms the distribution does not suffer major changes (Appendix 1). However, for focused firms the universe of rated firms is much smaller as well as the rating notations spectrum. There are only seven different ratings attributed and it lies from BBB+ to B (Appendix 1). This finding leads to believe that focused rated firms do not perceive the rating status as important as diversified rated firms. This is in accordance with the theory that argues that diversified firms look at rat-ings as a tool to reduce information asymmetries due to their complexity and opaque structure, as opposed to focused firms that do not suffer from this issue as much.
Furthermore, in Figure 2, the rated sample is sliced into diversified and focused firms for three different periods to account for the effect of the 2007-2008 financial crisis. Looking at Figure 2, one can conclude that diversified firms have, on average, better rat-ings. Notwithstanding, both diversified and focused firms had a notation decrease during the financial crisis which they did not recover in the years following the crisis. This find-ing suggests that before the crisis there were inflated ratfind-ings. The same results are ob-tained if considering the crisis as in 2007-2009 or 2008-2009 (Appendix 2).
15
Regarding the industry dispersion, it is possible to conclude from Figure 3 that during the studied timeframe the lion share of the companies on the database are concen-trated in the Manufacturing sector followed by Transports and Public Utilities industry. There are no companies in the financial services industry, due to the elimination criterions carefully explained above.
Taking this Standard Industrial Classification Code (SIC-Code) analysis even fur-ther to a subsample of diversified and non-diversified, one concludes that the industry distribution is very similar to the one presented in Figure 3. Therefore, there is not a major industry representative change between the diversified and non-diversified subsamples driving the results (Appendix 3).
Figure 3 - Industry Distribution Figure 2- Yearly Average Rating
16
3.3 Excess value construction
As stated before, one of the persistent problematics of diversification is to perceive its true impact on firm value. Thus, I construct an excess value variable as in Berger & Ofek (1995). This methodology intends to analyze for each case if diversification is cre-ating or destroying value. In fact, the excess value variable aims at understanding whether firms are more valuable as stand-alone businesses or if the sum of their segments are proven to be higher. In case of a positive excess value the evidence suggests that diversi-fication is a value-enhancing strategy, while having negative excess value indicates di-versification discount (Berger & Ofek, 1995). Thus, the following equations illustrate the procedure:
Excess value = ln(Actualvalue/Imputedvalue) Imputed value(V)=∑𝑛𝑖=1𝐴𝐼𝑖× 𝐼𝑛𝑑𝑖(𝑉/𝐴𝐼)𝑚𝑓
As stated above in Table 1, the actual value (V) is composed by the sum of book value of debt and market value of equity. On the other hand, the imputed value is con-structed in two steps.
First, one needs to focus on single-segment firms and compute their median mar-ket to sales (MSR) or their median marmar-ket to assets (MAR) depending on the fundamental that most suits the analysis. This computation needs to be done for the same year and for comparable industries. Therefore, to be in the same industry the companies must have the same 3-digit SIC and it needs to contain at least 5 different firms. Otherwise, the same industry will be proxied by single-firms that are in the same 2-digit SIC. Thus, after com-plying with these criteria, one gets the (𝐼𝑛𝑑𝑖(𝑉/𝐴𝐼)𝑚𝑓).
Secondly, one multiplies this result by the segment fundamental (𝐴𝐼𝑖), either sales
or assets, according to the choice that was made in the first step. Then, this approach is repeated for the number of segments (n) of each firm. So, the imputed value measures the segment worth as if it was a stand-alone business. Thereby, each firm’s imputed value is the sum of all its segment imputed values and yields its worth as if they were splitted up. Additionally, the excess value variable is winsorized at 1% and 99% to attenuate the in-fluence of outliers.
A note of caution should be made regarding the choice of the accounting item to construct the multiple, that is, either sales or assets. According to Berger & Ofek (1995),
17
the assets fundamental is more prone to have deviations between the firm-level and seg-ments level data. This may be due to unlocated assets. In this context, as well as for com-parison sake with Chou & Cheng (2012) results, I use the sales multiplier approach.
4. Results
4.1 Descriptive statistics
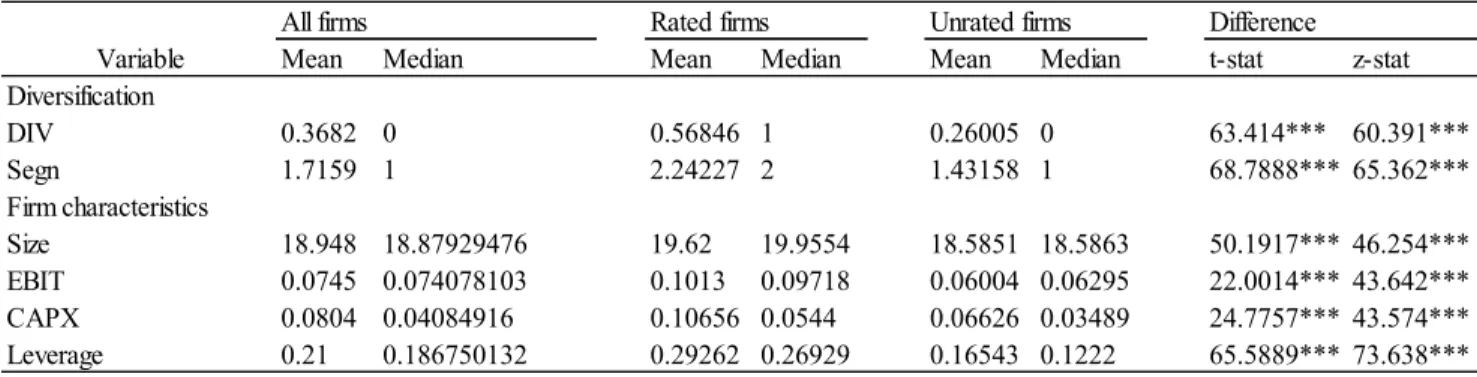
Analyzing Table 4 one can understand that nearly 37% of the firm-years in the studied sample are diversified, meaning that they are composed by more than one ment. In fact, on average, the firm-years are characterized by having 1.72 business seg-ments. If one narrows down this analysis even more, the average diversified firm-year reports 2.94 segments (result not reported).
Looking at the firm characteristics, the average size of each firm, which was com-puted as the natural logarithm of total assets, is $18.948 million whereas the median size is $18.8793 million. The mean (median) of the Ebit-to-sales ratio is 7.45% (7.408%), which proxies as the firm profitability. On the other hand, the mean of the Capex-to-sales ratio is 8.04% while the median is 4.085% which indicates a highly positive skewness for this variable. Finally, the mean (median) of the leverage, a ratio of long-term debt to total firm assets, is 0.21 (0.18675) which may also suggest positive skewness.
This table also provides summary statistics comparison between the rated and un-rated subsample as well as parametric (T-statistics) and non-parametric (Wilcoxon z-sta-tistics) statistical tests. These tests, computed for the differences in means and medians of the studied variables, are all significant. In fact, on average, the rated sample has more
All firms Rated firms Unrated firms Difference
Variable Mean Median Mean Median Mean Median t-stat z-stat
Diversification DIV 0.3682 0 0.56846 1 0.26005 0 63.414*** 60.391*** Segn 1.7159 1 2.24227 2 1.43158 1 68.7888*** 65.362*** Firm characteristics Size 18.948 18.87929476 19.62 19.9554 18.5851 18.5863 50.1917*** 46.254*** EBIT 0.0745 0.074078103 0.1013 0.09718 0.06004 0.06295 22.0014*** 43.642*** CAPX 0.0804 0.04084916 0.10656 0.0544 0.06626 0.03489 24.7757*** 43.574*** Leverage 0.21 0.186750132 0.29262 0.26929 0.16543 0.1222 65.5889*** 73.638***
Table 4 - Summary Statistics
This table reports the mean and medians for the studied variables, which encompasses a total of 39174 firm-years. This sample is further composed by 14424 conglomerate firm-years and 24750 focused ones. Taking the ratings perspective there are 11864 rated firm-years and 19065 unrated ones. Furthermore, this table also provides parametric (T-statistics) and non-parametric (Wilcoxon z-statistics) statis-tical tests to evaluate the difference in means and medians, respectively. Here, DIV is a dummy variable that takes the value of one if the firm reports more than one business segment and zero otherwise; Segn is the number of segments each firm report; Size is computed as the natural logarithm of total assets; EBIT are the earnings before interest and taxes divided by total sales; CAPX are the capital expend-itures divided by total sales and Leverage is the ratio of long-term-debt to total assets. The significance legend corresponds *, **, *** to 10% ,5% and 1%, respectively.
18
conglomerate firms and reports more business segments than the unrated ones. For the remaining analyzed variables, the rated firms always present higher values which goes in line with the literature that rated companies benefit from better growth opportunities and are usually larger (Chou & Cheng, 2012).
4.2 Univariate analysis
On Table 5, the excess value variable is carefully analyzed both in the ratings and in the diversification dimension. Not only the means and medians are computed but so are the T-statistics and the Wilcoxon rank-sum test in order to understand whether the difference was statistically significant.
The conclusions that one can draw from this table are that diversified firms have, on average, lower valuations than focused firms. The mean (median) excess value of the average rated diversified firm is 0.116 (0.093) while for the average rated focused firm it is 0.178 (0.143).
Likewise, the same happens in the unrated subsample where the mean (median) for the diversified firm is -0.053 (-0.058) and for the focused firm it is -0.042 (-0.040).
However, in the subtotal column a puzzling result is obtained since the average diversified firm (0.038) appears with a higher valuation than the average focused firm (0.010). As this is not the case in any of the subsamples, these figures lead to believe that the result is due to a composition effect. Moreover, this argument is reinforced by the fact
Excess value Rated firms Unrated firms Subtotal Row test stat.: Rated-Unrated
Mean 0.11629 -0.05325 0.03802 0.06303*** Median 0.09255 -0.05798 0.02325 0.03457*** Nº of firm years 7809 6615 14424 Mean 0.17824 -0.04230 0.01053 0.13595*** Median 0.14290 -0.03952 0.00744 0.10338*** Nº of firm years 5928 18822 24750 Mean 0.14328 -0.04514 0.02058 0.09814*** Median 0.11633 -0.04440 0.01291 0.07193*** Nº of firm years 13,737 25,437 39,174
Column test stat.: Mean 0.06195*** 0.01096 0.02749***
diversified-focused Median 0.00546*** 0.01846* 0.0158**
Diversified
Focused
Subtotal
Table 5 - Excess Value Univariate Analysis
This table reports the mean and medians both at the ratings and diversification dimension for the excess value, which is the dependent variable. The sample encompasses a total of 39174 firm-years which is further composed by 14424 conglomerate firm-years and 24750 focused ones. Taking the ratings perspective there are 11864 rated firm-years and 19065 unrated ones. Furthermore, this table also provides parametric (T-statistics) and non-parametric (Wilcoxon z-statistics) statistical tests to evaluate the difference in means and medians, respectively. Here, the Excess Value is computed as the natural logarithm of actual value to Imputed Value; the Actual Value is computed as the sum of Market Value of Equity with Book Value of Debt; the Imputed Value is the product between Segment Sales and the Median Market to Sales. The significance legend corresponds *, **, *** to 10% ,5% and 1%, respectively.
19
that further in the multivariate analysis, when controlling for several factors, this result no longer appears and a diversification discount is documented.
Secondly, there is also the fact that, on average, rated firms have higher valuations than unrated companies. For rated companies, the mean (median) excess value is 0.143 (0.116) while for unrated firms the mean (median) it is -0.045 (-0.044).
Therefore, these conclusions suggest that diversified companies would benefit from being rated since it seems to be a value-enhancing strategy (though we should acknowledge that there are costs associated with obtaining a rating, which might be dis-proportionately high for the smaller firms). According to the literature, the benefits from obtaining a rating might be related to their role as an informational tool, given that the enhanced transparency provides important information to market participants. Hence, the informational asymmetry problems are mitigated for diversified rated firms.
4.3 Hypothesis development
As explained in previous sections, credit ratings appear as a tool to disclose what the true impact of diversification on firm value is. This happens because credit ratings are attributed based on sensitive and confidential information that is not disclosed to the pub-lic. Therefore, under the SEC’s Regulation Fair Disclosure, CRAs are given access to documents such as the company’s strategic plans or future growth prospects. Thus, in theory and according to the results obtained so far, credit ratings should increase trans-parency and mitigate information asymmetry problems among distinct layers of stake-holders. So, it seems that rated diversified firms are less subject to diversification discount due to the informational tool provided by rating notation.
H1. In a ceteris paribus scenario, rated conglomerate firms are, on average, less affected
by diversification discount than the unrated ones.
This hypothesis comes in line with the conclusion derived from Table 5, but there should be some control for other omitted variables that could be biasing the results. Thus, I analyze the likeness of this prediction with Campa & Kedia (2002)’s approach by re-gressing excess value on: a diversification dummy (DIV) that takes the value of one if a firm reports more than one segment and zero otherwise; the number of business segments reported by each firm (Segn); the firm size (Size) computed as the natural logarithm of assets; leverage (Leverage) to account for the risk-reduction hypothesis as argued by Mansi & Reeb (2002); Ebit/total sales (EBIT) which is a profitability proxy and
20
Capex/total sales (Capx) to account for investment. Moreover, I include in the regressions the one and two lag variables for firm size, investment and profitability as a robustness measure since their past values could be impacting the firm’s characteristics in time t.
𝐸𝑥𝑐𝑒𝑠𝑠𝑣𝑎𝑙𝑢𝑒 = 𝛼 + 𝛽1𝐷𝐼𝑉𝑡+ 𝛽2𝑆𝑖𝑧𝑒𝑡+ 𝛽3𝐸𝐵𝐼𝑇𝑡+ 𝛽4𝐶𝑎𝑝𝑥𝑡+ 𝛽5𝐿𝑒𝑣𝑒𝑟𝑎𝑔𝑒𝑡+
𝛽6𝑆𝑖𝑧𝑒𝑡−1 + 𝛽7𝐸𝐵𝐼𝑇𝑡−1+ 𝛽8𝐶𝑎𝑝𝑥𝑡−1+ 𝛽9𝑆𝑖𝑧𝑒𝑡−2+ 𝛽10𝐸𝐵𝐼𝑇𝑡−2+ 𝛽11𝐶𝑎𝑝𝑥𝑡−2 + u for t = 1985,…, 2016
In a further analysis, the rated conglomerate firms’ sample is split into a pre- and post- 2008/2009 financial crisis period. In this context, its assessed whether the results remain similar, or the crisis undermined credit ratings reputation and, thus, they are no longer an useful tool to increase transparency while mitigating asymmetry informational problems.
H2. In a ceteris paribus scenario, high rated conglomerate firms are, on average, less
affected by diversification discount than low rated ones.
Following Chou & Cheng (2012)’s methodology, this thesis studies if there is a positive relation between credit rating levels and less diversification discount. As referred in the previous hypothesis, I also conduct a sample separation to check if the results suffer any major change after the financial crisis.
4.4 Multivariate analysis for H1
Before delving into analyzing the regressions, it is important to observe how strongly the variables are correlated with each other through the correlation coefficient. Table 6 presents the Pairwise Correlation Matrix.
DIV Capx EBIT Size Leverage Size (lag 1) Size (lag 2) EBIT (lag 1) EBIT (lag 2) Capx (lag 1) Capx (lag 2) Excess value DIV 1.0000 Capx -0.0344*** 1.0000 EBIT 0.0820*** 0.0006 1.0000 Size 0.2107*** 0.1058*** 0.1235*** 1.0000 Leverage 0.0606*** 0.1689*** -0.0012 0.1170*** 1.0000 Size (lag 1) 0.1283*** 0.0999*** 0.0992*** 0.7821*** 0.1189*** 1.0000 Size (lag 2) 0.1190*** 0.0972*** 0.1008*** 0.7422*** 0.1248*** 0.7789*** 1.0000 EBIT (lag 1) 0.1818*** 0.0936*** 0.5468*** 0.1367*** -0.0007 0.1265*** 0.1062*** 1.0000 EBIT (lag 2) 0.1954*** 0.1298*** 0.4107*** 0.1455*** 0.0124*** 0.1420*** 0.1368*** 0.6018*** 1.0000 Capx (lag 1) 0.1174*** 0.7529*** -0.0227*** 0.1057*** 0.1740*** 0.1046*** 0.0985*** 0.022*** 0.1108*** 1.0000 Capx (lag 2) 0.0963*** 0.6567*** -0.0075 0.1045*** 0.1765*** 0.1055*** 0.1045*** 0.004*** 0.048*** 0.7576*** 1.0000
Table 6 - Pairwise Correlation Matrix
This table reports the correlation coefficients for the studied variables for a total of 39174 firm-years. Here, DIV is a dummy variable that takes the value of one if the firm reports more than one business segment and zero otherwise; Segn is the number of segments each firm report; Size is computed as the natural logarithm of total assets; EBIT are the earnings before interest and taxes divided by total sales; CAPX are the capital expenditures divided by total sales and Leverage is the ratio of long-term-debt to total assets. The significance legend corre-sponds *, **, *** to 10% ,5% and 1%, respectively.
21
Then, in Table 7, the regression presented in the first hypothesis development for the ratings dimension is estimated. So, the sample is subdivided into rated and unrated firms (columns 1 to 2) while regressing excess value on the diversification discount and several other control variables. If the diversification coefficient (DIV) is positive that means there is a diversification premium, whereas a negative coefficient signifies that there is a diversification discount and provides an estimation for the value loss from di-versification.
Moreover, in column 3, this regression is also performed without any sample split but rather introducing an interaction variable (DIV*Israted) composed by two dummy variables. Here, DIV is the diversification coefficient that takes the value of one if the firm reports more than one business segment and zero otherwise while Israted is a dummy that takes the value of one if the firm is rated and zero otherwise. Thereby, the creation of this third column enables to ensure that there are not composition effects driving the regression results of the sample split.
To account for heteroskedasticity, I used the robust standard errors for all the anal-ysis performed. Furthermore, there are applied firm fixed effects to control for omitted variables related to firm characteristics, as well as year fixed effects to account for time-variant variables impacting the results. This estimation is done for 30,929 firm-years.
The results displayed in Table 7, in column 1 and 2, with the excess value as the dependent variable, are in accordance with the literature that documents the existence of a diversification discount. Both rated and unrated subsamples exhibit, on average, nega-tive diversification coefficients estimates, indicating that diversification is a value-de-stroying strategy for both cases.
Yet, one can observe that the unrated sample is characterized by having a more negative average diversification coefficient (-0.110) than the average rated coefficient (-0.071). Hence, this finding suggests that, on average, ratings mitigate the information asymmetry problems and, consequently, rise the value of a diversified firm.
As for the result in the third column, there is no major change in the figures of interest. As expected, the average diversification coefficient (-0.115) is negative and sig-nificant while being closer to the unrated one. This is derived by the fact that the unrated subsample is 1.6 times bigger than the rated one. Regarding the average interaction
22
variable (DIV*Israted), it exhibits a positive and significant coefficient (0.066) which, once more, indicates a positive impact from ratings, on average.
Rated firms
Unrated
firms Total sample
Intercept DIV -0.071** -0.110*** -0.115*** (-2.87) (-3.87) (-5.29) DIV*Israted 0.066** (2.69) Size 0.007** 0.039*** 0.022*** (2.36) (8.43) (8.96) EBIT 0.298*** 0.323** 0.317*** (4.16) (2.15) (4.08) Capx 0.737*** 0.769*** 0.709*** (7.55) (8.2) (11.69) Size (1 lag) 0.000 0.004 -0.001 ( 0.04 ) (1.15) (-0.52) EBIT (1 lag) 0.180** 0.291*** 0.255*** (2.29) (2.75) (3.75) Capx (1 lag) 0.203*** 0.291*** 0.232*** (3.60) (2.85) (4.65) Size (2 lag) -0.009*** -0.008** -0.009*** (-3.21) (-1.95) (-4.15) EBIT (2 lag) 0.556*** 0.323*** 0.352*** (6.71) (3.32) (5.10) Capx (2 lag) 0.188*** 0.296*** 0.212*** (4.83) (4.55) (6.08) Leverage 0.288*** 0.285*** 0.257*** (4.26) (4.45) (5.61)
Firm dummies Yes Yes Yes
Year dummies Yes Yes Yes
Number of
observations 11,864 19,065 30929
Adjusted 0.205 0.120 0.146
Firm fixed-effects model
2
This table reports the firm fixed-effects model for the diversification reduced by the credit ratings to test hypothesis 1. The dependent variable is Excess Value and its computed following the sales multiplier approach. Here, DIV is a dummy variable that takes the value of one if the firm reports more than one business segment and zero otherwise; Israted is a dummy that takes the value of one if the firm is rated and zero otherwise; Segn is the number of segments each firm report; Size is computed as the natural logarithm of total assets; EBIT are the earnings before interest and taxes divided by total sales; CAPX are the capital expenditures divided by total sales and Leverage is the ratio of long-term-debt to total assets. These estimations were computed with both firm and year fixed effects. To account for heteroskedasticity there were used robust standard errors. The values in brackets correspond to the t-statistics computed for each estimated coefficient. The significance legend corresponds *, **, *** to 10% ,5% and 1%, respectively.
23
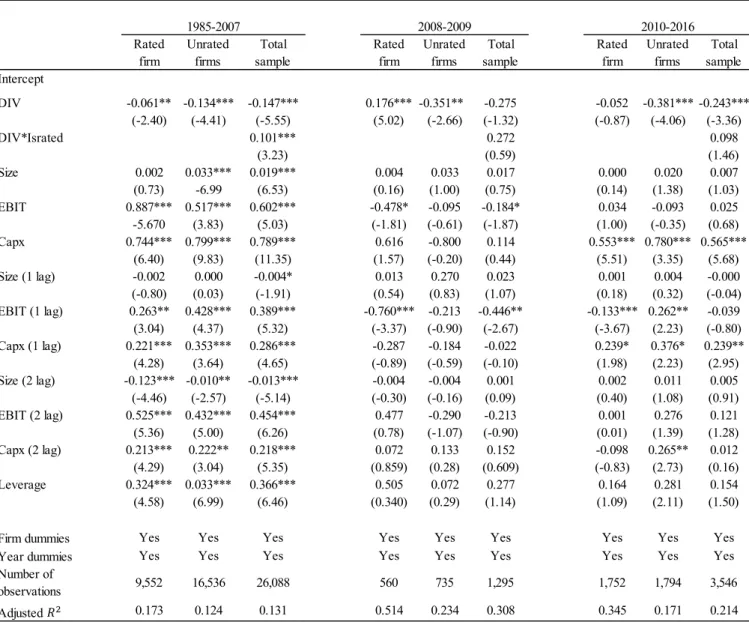
In Table 8 the sample is split into a pre- and post-2007/2008 financial crisis period is addressed. In fact, the aim is to test whether the results remain similar across the peri-ods, or if the crisis undermined credit ratings reputation and, thus, they are no longer an useful tool to increase transparency while mitigating asymmetry informational problems. For the period denoted as before the crisis in this analysis (1985-2006, column 1
to 3), the results do not experience any major change since, on average, both rated (-0.055) and unrated (-0.115) coefficient remain negative with the unrated still presenting
a more negative value as expected. The total sample column results also are in line with the existence of a diversification discount attenuated for rated firms.
However, during the financial crisis (2007-2008, column 4 to 6) the average di-versification coefficient is no longer significant, as well as most of the variables analyzed in the model. So, the excess value variable is no longer suitably explained by the model and the division between rated and unrated does not cause any apparent impact on the model quality. If considering the total sample instead (column 6), the results remain in-significant for all the variables of interest (DIV; DIV*Israted). This seems to suggest that during the financial crisis there were confounding effects, as it is common in crisis peri-ods, which are not captured in this model.
Regarding the post-financial crisis period (2009-2016, column 7 to 9), the average
diversification coefficients are both negative, but only the unrated one turns significant (-0.381). The same happens for the total sample (column 9) where the average
diversifi-cation coefficient is negative and significant (-0.242), but the average interaction term is insignificant as during the crisis period.
This points to the fact that, on average, credit ratings suffered a spillover reputa-tional damage effect due to one of the biggest world financial crisis, that many denote as the CRA’s fault. Thus, most probably the credit rating notations had, as a crisis conse-quence, a lack of credibility from the market and investors. This would be explanatory for the faster recovery of the unrated diversification coefficient that becomes significant at 1%, but still more negative than it was in the periods before the crisis.
To take several approaches into consideration, I also perform the same regression as before in Table 8, but with a different division of the financial crisis timeframe. This way, it is tested if the results remain the same when considering the financial crisis period in 2007 to 2009 (analysis 2) and in 2008 to 2009 (analysis 3). Considering the financial
24
crisis as in 2007-2009 is relevant since it also encompasses 2009 which is a recession year for most of the world economies, though China and India were starting to recover (Verick & Verick, 2010). Furthermore, considering it as in 2008-2009 is also valuable because the crisis only unfolded by the end of 2007 (Verick & Verick, 2010).
Rated firm Unrated firms Total sample Rated firm Unrated firms Total sample Rated firm Unrated firms Total sample Intercept DIV -0.055** -0.115*** 0.120*** 0.023 0.007 0.04 -0.089 -0.339*** -0.254*** (2.20) (-4.29) (-5.26) (0.16) (0.04) (0.26) (-1.62) (-3.25) (-3.20) DIV*Israted 0.074** -0.108 0.090 (2.88) (-0.58) (1.26) Size 0.001 0.030*** 0.017*** 0.015 -0.037 -0.023 0.002 0.156 0.008 (0.48) (7.35) (6.49) (0.68) (-1.63) (-1.41) (0.35) (1.32) (1.33) EBIT 0.848*** 0.581*** 0.632*** 0.600*** 0.473* 0.473** 0.046 -0.127 0.020 (5.85) (5.22) (6.45) (3.25) (1.88) (3.03) (1.34) (-0.51) (0.47) Capx 0.706*** 0.743*** 0.721*** 1.431*** 0.364* 0.385** 0.523*** 0.757*** 0.584*** (6.83) (8.50) (11.01) (3.43) (1.74) (2.62) (5.14) (3.37) (6.03) Size (1 lag) -0.002 0.001 -0.004* -0.004 -0.054** -0.045** 0.000 -0.003 -0.003 (-0.93) (0.19) (-1.86) (-0.27) (-2.17) (-2.80) (0.13) (-0.25) (-0.54) EBIT (1 lag) 0.235** 0.487 0.418*** -1.472** 0.029 -0.088 -0.105** 0.210** -0.006 (2.71) (6.12) (6.94) (-3.06) (0.12) (-0.46) (-2.78) (2.07) (-0.13) Capx (1 lag) 0.223*** 0.354*** 0.289*** 0.998** -0.326 -0.064 0.258** 0.443** 0.245*** (4.40) (4.13) (5.44) (2.60) (-0.79) (-0.29) (2.47) (2.57) (3.34) Size (2 lag) -0.012*** -0.009** -0.012*** -0.021 -0.013 -0.020* 0.008 -0.007 -0.000 (-4.38) (-2.40) (-5.29) (-1.62) (-0.67) (-1.67) (1.35) (-0.70) (-0.06) EBIT (2 lag) 0.480*** 0.333*** 0.361*** -1.188** -0.049 -0.048 0.113 0.213 0.168 (5.13) (4.67) (6.01) (-2.43) (-0.59) (-0.61) (1.20) (1.12) (1.57) Capx (2 lag) 0.191*** 0.203** 0.199*** 0.335** 0.247 0.141 -0.066 0.245** 0.055 (4.07) (3.07) (5.34) (2.55) (0.47) (0.99) (-0.59) (2.49) (0.73) Leverage 0.306*** 0.237*** 0.296*** -0.110 -0.077 -0.055 0.159 0.344** 0.212** (4.53) (4.49) (6.27) (-0.53) (-0.43) (-0.42) (1.13) (2.69) (2.35)
Firm dummies Yes Yes Yes Yes Yes Yes Yes Yes Yes
Year dummies Yes Yes Yes Yes Yes Yes Yes Yes Yes
Number of
observations 9,243 16,140 25,383 595 778 1,373 2,026 2,147 4,173
Adjusted 0.176 0.136 0.14 0.629 0.535 0.556 0.334 0.159 0.208
1985-2006 2007-2008 2009-2016
2
Table 8 - Multivariate tests for the diversification discount for ratings and financial crisis dimension -H1- Analysis 1
This table reports the firm fixed-effects model for the diversification reduced by the credit ratings to test hypothesis 1. Furthermore, this table also introduces the financial crisis into the problematic, dividing the timeframe in 3 periods (analysis 1). The dependent variable is Excess Value and its computed following the sales multiplier approach. Here, DIV is a dummy variable that takes the value of one if the firm reports more than one business segment and zero otherwise; Israted is a dummy that takes the value of one if the firm is rated and zero otherwise Segn is the number of segments each firm report; Size is computed as the natural logarithm of total assets; EBIT are the earnings before interest and taxes divided by total sales; CAPX are the capital expenditures divided by total sales and Leverage is the ratio of long-term-debt to total assets. These estimations were computed with both firm and year fixed effects. To account for heteroskedasticity there were used robust standard errors. The values in brackets correspond to the t-statistics computed for each estimated coefficient. The significance legend corresponds *, **, *** to 10% ,5% and 1%, respectively.