Acoustic Birefringence and Poisson’s Ratio Determined by Ultrasound: Tools to Follow-Up
Deformation by Cold Rolling and Recrystallization
Linton Carvajala*, Alfredo Artigasa, Alberto Monsalvea, Yolanda Vargasb
Received: December 13, 2016; Revised: June 25, 2017; Accepted: July 5, 2017
Poisson’s ratio and birefringence, both measured by ultrasound, are used to follow the evolution of the anisotropy in ASTM A-36 steel plates cold-rolled between 5 and 50% deformation, and then
subjected to recrystallization at 900 and 1000 °C. Times of light of longitudinal and shear waves along the thickness of the plates were measured. As orthotropy increases, both birefringence and the diference
between Poisson’s ratios measured using a shear wave polarized along the length and another wave polarized along the width of the plate, are linearly related to the degree of deformation and cold-rolled hardness. In addition, the ultrasonic methods used clearly detected the complex changes in anisotropy produced by the austenization and recrystallization heat treatments. Thus, Birefringence or Poisson’s ratio, measured by ultrasound, can be used to follow-up nondestructively changes in the anisotropy of rolled plates as a function of both, degree of deformation and recrystallization heat treatment.
Keywords: Ultrasound, Poisson’s Ratio, Acoustic Birefringence, Cold Working, Recrystallization
* e-mail: linton.carvajal@usach.cl
1. Introduction
The use of ultrasound to measure second order elastic constants in multiphase or polycrystalline materials is based
on the Christofel equation, which relates them with the phase
velocity of three non-dispersive ultrasonic waves with mutually perpendicular polarization directions (i.e., of displacement of
the medium’s particles), propagating in speciied directions1. This equation comes from considering that the passage of
a wave through a body generates small elastic stresses and
deformations, setting up a dynamic equilibrium described by the equations of motion, wherefrom the equation that
governs wave propagation in a homogeneous elastic medium is obtained by considering the generalized form of Hooke’s
law. The Christofel equation is inally obtained by assuming
the propagation of harmonic elastic waves as a solution for
the equation of motion:
(1)
where Cijkl are the second order elastic constants; (n1,n2,n3), the direction cosines of the normal to the wavefront, indicating, therefore, the direction of propagation of the wave; ul is
the displacement or polarization vector; ρ, the density of the medium, and δil, the Kroenecker delta. The equation corresponds to three homogeneous equations from which, for every propagation direction considered, three diferent velocity values arise from the cubic equation in v2, obtained
by making the determinant of the coeicient matrix equal to
zero. These three velocities correspond to three waves with mutually perpendicular polarization vectors.
The solution to the inverse problem of determining the elastic constants from experimental measurements of wave velocity is well established, and the measuring protocols
are clearly deined in the literature1. Most materials used
in engineering either have isotropic symmetry, with two independent elastic constants, or orthotropic symmetry, with nine independent constants. The following relations are obtained for the isotropic case, where C11 = C22 = C33, C44 = C55 = C66 = ½(C11-C12):
(2)
with vii, the velocity of the longitudinal wave (longitudinally polarized to its direction of propagation i), and vij, with i ≠ j, the velocity of the shear wave (polarized in the direction j, transverse to its direction of propagation i). Thus, the values of the elastic constants may be obtained just by measuring the velocities of a longitudinal wave and a shear wave in any direction of propagation. From the theory of elasticity2, which for the isotropic case relates the elastic stifness constants
with Young’s and shear moduli, and with Poisson’s ratio ν, these parameters may be expressed in terms of the velocities aDepartment of Metallurgical Engineering, Universidad de Santiago de Chile, Av. Libertador Bernardo
O’Higgins, 3363, Estación Central, Santiago, Chile.
bDepartment of Physics, Universidad de Santiago de Chile, Av. Libertador Bernardo O’Higgins, 3363,
Estación Central, Santiago, Chile.
C n n
ijkl j k-
t d
v
2 ilu
l=
0
Q
V
;
;
;
C
v
v
C
v
v
C
v
2
v
L
T L T
ii ij
11 2 2 44 2
2 12
2 2
/
/
t
t
t
t
t
=
=
of the longitudinal and shear waves3, as Equation (3) shows
for Poisson’s ratio:
(3)
Since in an isotropic material vL and vT are independent of their directions of propagation and polarization, access to any one plane is enough to calculate its elastic properties.
In order to obtain the independent constants of an
orthotropic material, nine measurements are required.
These are the velocities of longitudinal and shear waves in the three symmetry directions of the material, allowing to obtain C11, C22, C33, C44, C55 and C66; and the velocities of
either quasi-longitudinal or quasi-shear waves in the three
symmetry planes, but at an angle with respect to the axes, obtaining C12, C13 and C23. Now, using only normal incidence for propagation along the z-axis (Figure 1), the following relations are obtained:
(4)
That is, although to obtain all of the constants of an orthotropic material, three perpendicular planes must necessarily be accessed, variations in the degree of orthotropy may be studied by having access to only one plane and measuring the velocities of the shear waves v31 and v32, thus determining
the diference between the elastic constants C44 and C55. This diference gives rise to the acoustic birefringence B, which is quantiied as the ratio of the diference of velocities v31
and v32 to their average, as Equation 5 shows, so that for a perfectly isotropic material, B = 0:
(5)
where tij corresponds to the times of light of the waves
along the z-axis. The equation shows that birefringence can be quantiied without measuring the distance, usually the
thickness as in the case of rolled metal plates, of the material through which the wave travels, because the ratio of the velocities of two waves traveling the same distance becomes
a ratio of the times of light of those waves. Therefore, on
the one hand, an important source of error in measurement is omitted, and on the other hand, it allows the study to be
made under conditions in which it is diicult or impossible
to measure the thickness4-7.
Notice that Equation (3) indicates that the thickness can also be omitted to calculate Poisson’s ratio. This equation is
valid for an isotropic material; for an orthotropic material, the
diference between the elastic constants C44 and C55 should
generate two values for Poisson’s ratio, depending on the polarization direction of the shear wave, that is:
(6) (7)
/
/
v v
v v
2
1
2
L T L T 2 2o
=
-Q
Q
V
V
"
%
;
;
C
33=
t
v
332C
44=
t
v
322C
55=
t
v
312B
v
v
v
v
t
t
t
t
2
1
2
1
31 32 31 32 32 31 32 31=
+
-
=
+
-Q
V
Q
V
/
/
/
/
v
v
v
v
t
t
t
t
2
1
2
2
1
2
3 3 3 3 31 3 1 2 3 1 2 31 33 2 31 33 2o
=
-=
-Q
Q
V
V
Q
Q
V
V
" % " %
/
/
/
/
v
v
v
v
t
t
t
t
2
1
2
2
1
2
3233 32 2 33 322
32 332 32 33 2
o
=
-=
-Q
Q
V
V
Q
Q
V
V
" % " %
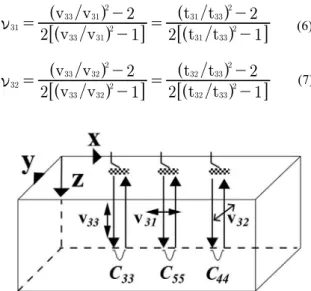
Figure 1. Waves for the determination of elastic constants, with longitudinal and shear waves propagating along z. The longitudinal wave is polarized along the z-axis, while the shear waves of velocities v31 and v32 are polarized along the x and y axes, respectively.
Therefore, it should be possible to relate Poisson’s
ratio with the efect of deformation processes and post
deformation heat treatments on the anisotropy, without specifying the thickness of the material under study. There is no information in the literature with respect to the use of Poisson’s ratio for this purpose. The objective of this paper is, then, to study the feasibility of relating Poisson’s ratio and acoustic birefringence measured by ultrasound with the degree of cold-working and the temperature and time of austenization after cold deformation of an structural steel.
For this research, the traditional contact ultrasonic technique
was used (as Figure 1 suggests), which readily lends itself to some industrial use, though it might be a limitation when contact between transducers and the part becomes an issue.
However, the method is suitable for any non-contact technique,
such as Electromagnetic Acoustic Transducer (EMAT) and Laser Ultrasonic (LUS), as long as longitudinal and shear waves may be induced in the part.
2. Experimental Procedure
Seven samples measuring 505 mm x 54 mm x 15 mm were cut for cold rolling from a hot-rolled ASTM A-36 steel
plate. Their surfaces were adequately prepared to readily
accommodate the transducers and propagate the ultrasonic
waves. Before rolling each sample, 21 points were identiied
along the central line of the top surface, separated by 10 mm each. The thickness at every point was measured with a micrometer. Then, the seven samples were rolled each at a
diferent degree of deformation. Afterwards, the seven rolled samples were each cut into four equal parts, all of which were
previously heated at the required temperature as shown in
Table 1. Thus, four heat treatments were performed for each degree of deformation.
The longitudinal velocity v33, whose polarization vector is perpendicular to the rolling direction, has a decreasing trend as the degree of deformation increases beyond
17.9%, reaching, at 42%, a maximum diference of 46 m/s
(0.78%) compared to its original average value without cold deformation. On the other hand, it is observed that for the
original non-cold rolled sample, the diference between the
average values of velocities of the perpendicularly polarized shear waves, v31 and v32, is barely 3 m/s. From Equation
4, this gives rise to a diference of a mere 0.18% between
C44 and C55, rendering the sample nearly isotropic. As cold deformation increases, the shear wave velocity v31, polarized parallel to the rolling direction,increases constantly from
its original average value, so that the velocity is 2 m/s higher (0.06%), at ε = 5.4% and 28 m/s higher (0.86%) at ε
= 49.7%; meanwhile, v32 (perpendicularly polarized to the
rolling direction) decreases between 5 and 86 m/s (0.15% and
2.65%), relative to its respective original value. Following
Equation 4, this implies that C55 increases and C44 decreases because of the deformation, while the efect on C33 is more
complex, although it clearly tends to decrease.
3.2 Efect of cold rolling on poisson’s ratio and
birefringence
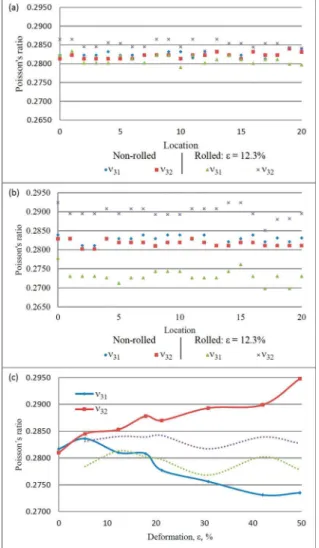
According to Equations 5, 6 and 7, the changes in the
elastic constants modify B and ν. To illustrate the efect of cold rolling, Figure 2a compares Poisson’s ratios at the 21 locations of a sample before and after cold rolled to 12.3% deformation, and Figure 2b does the same for the sample rolled to 42%. On the non-rolled samples of Figure 2, the
average values of Poisson’s ratios determined from Equations
6 and 7 are ν̅31 = 0.2817 and ν̅32 = 0.2810, respectively. Figure 2 also shows that the individual values of ν31 and ν32 before
deformation slightly luctuate around their respective mean values, with a maximum diference between ν31 and ν32 of
0.0019 at locations 4 and 10. On the other hand, when the
samples are rolled, luctuations around the respective averages
increase somehow, but more importantly, as the deformation increases, ν31 decreases while ν32 increases at every location.
Hence, the diference between the mean values for the sample
rolled to 12.3% grows to ν̅31 – ν̅32 = 0.0042, while for the one rolled to 42%, climbs to ν̅31 – ν̅32 = 0.0168, that is, more than an order of magnitude greater than ν̅31 – ν̅32 = -0.0007,
the diference between the mean values for the non-rolled samples. The efect of cold deformation, from 0 to 49.7%,
Table 1. Time and temperature for heat treatment of rolled samples.
Temp. ºC 900 900 1000 1000
Time, min. 15 30 15 30
To determine birefringence and Poisson’s ratio, normal incidence from longitudinal and shear contact piezoelectric
transducers and pulse-echo technique were used. Ultrasonic
tests were carried out before and after each deformation and after each heat treatment in the 21 locations corresponding to the marked points. The waves propagated from the top surface (xy plane in Figure 1) and along the thickness of the samples (z-axis in Figure 1). Naturally, longitudinal waves were always polarized along the z-axis. On the other hand, by alternatively placing the shear wave transducer on the surface with its polarization direction perpendicular to and along the rolling direction, shear waves polarized along the principal axes (x and y axes in Figure 1) of the samples were propagated. The ultrasonic system consisted of a Panametrics 5077PR pulser-receiver, on pulse-echo mode; 5-MHz, 11 mm in diameter Panametrics contact transducers for longitudinal and shear waves; and an HS805 TiePie oscilloscope emulator plate to obtain and store the echoes for later processing.
To relate results to standard techniques, metallographic
samples were prepared by common procedures, and Rockwell B hardness was measured before and after deforming the samples, and after the heat treatments. Five measures were taken on each sample for averaging.
3. Results and Discussion
3.1 Efect of cold rolling on wave velocities
After obtaining and storing the ultrasonic signals, the
times of light of the waves were measured, quantiied as the diference between the times of the maxima of the irst
two echoes.
Table 2 shows the propagation velocity values before and after rolling the samples; each value corresponds to the average of the measurements for each of the 21 points marked along the samples before deformation.
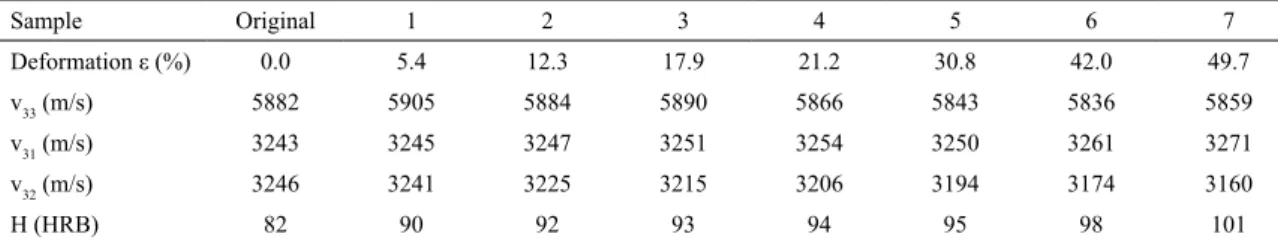
Table 2. Averages of the wave velocities and hardness in the rolled samples.
Sample Original 1 2 3 4 5 6 7
Deformation ε (%) 0.0 5.4 12.3 17.9 21.2 30.8 42.0 49.7
v33 (m/s) 5882 5905 5884 5890 5866 5843 5836 5859
v31 (m/s) 3243 3245 3247 3251 3254 3250 3261 3271
v32 (m/s) 3246 3241 3225 3215 3206 3194 3174 3160
on the average values of ν31 and ν32 is shown in Figure 2c. For comparison, the dotted lines also shown indicate the
range of luctuation of the individual values of ν31 and ν32
along the 21 points measured on each of the seven samples before rolling.
Figure 3 summarizes the efect of cold rolling on the diference between average values of Poisson’s ratios (that is, the diference between the curves of Figure 2c), and on birefringence. It is seen that ∆ν = (ν̅31 – ν̅32) increases linearly with deformation from -0.0007 to 0.0213. Likewise, the average birefringence B, which is barely -0.0011 in the hot
rolled condition, relecting its nearly isotropic behavior, increases linearly with cold deformation to 0.0346. Equations
(8) and (9) give the respective relations:
(8) Figure 2. Poisson’s ratios measured at 21 locations on samples;
(a) non-cold rolled and rolled to ε=12.3%; (b) non-cold rolled and rolled to ε=42%. (c) Average of Poisson’s ratios ν31 and ν32 versus
cold deformation (dotted lines indicate the range of luctuation of
values of ν31 and ν32 before rolling).
.
.
r
.
0 0004
0 0009
0 9932
31 32
2
o
o
o
f
D
=
-
=
-=
Q
V
(9)
Thus, it is possible to establish a linear relation between
the diference of Poisson’s ratios and birefringence. Such
relation is given by:
(10)
.
.
.
B
0 0007
0 0017
r
20 9871
f
=
-
=
.
.
.
B
r
0 6215
0 0004
0 9761
31 32
2
o
o
o
D
=
-
=
+
=
Q
V
Figure 3. Efect of deformation on birefringence B and on the
diference between Poisson’s ratios ∆ν = (ν̅31– ν̅32).
3.2.1 Relationship to hardness
Average values of hardness for the samples are shown in Table 2. The average value for the original hot rolled plate was 82 (HRB). As expected, hardness increases with cold rolling, and from the data in Table 2 is seen that it does it linearly as deformation increases between 5.4 and 49.7%.
The resultant relation is given by Equation (11), where, H
stands for hardness.
(11)
As a consequence, both birefringence and the diference
of Poisson’s ratios are linearly related to hardness. The respective relations are given by:
(12)
(13)
Therefore, it is possible to estimate precisely the level of deformation as well as the hardness achieved by rolling
from measurements of the time of light of shear waves
for birefringence, and of longitudinal and shear waves for Poisson’s ratios.
.
.
.
H
0 2302
88 8
r
20 978
f
=
+
=
.
.
.
B
=
0 0031
H
-
0 2739
r
2=
0 9961
.
.
.
H
r
0 0019
0 1658
0 9649
31 32
2
o
o
o
D
=
-
=
-=
3.3 Efect of heat treatment on poisson’s ratio and
birefringence
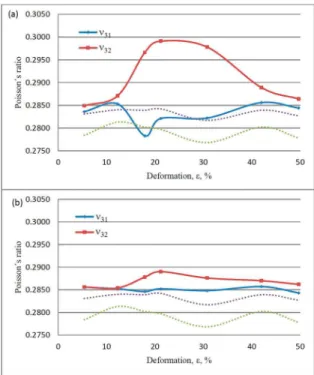
For high levels of deformation, Figures 4 and 5 show that the heat treatments to which the rolled samples were subjected tend to return the values of Poisson’s ratio to the original values, which are shown by the dotted lines that
indicate the range of luctuation of the ratios, both ν31 and
ν32, considering the 21 points measured on each of the seven
samples before rolling. However, at 900º C (Figures 4a and 4b), it is seen that regardless of treatment time, between 17.9% and 30.8% deformations, the ν31 curves show a maximum, shifting even more from the original values. This implies that the material behaves more anisotropically after the heat treatment within that deformation range.
would recrystallize below curve A1, followed by a partial transformation above curve A1 and a total transformation above curve A3. Then, on cooling the γ → α and γ → α
+ cementite transformations would occur. The onset of recrystallization and the recrystallized fraction depend on both the degree of deformation applied and the time at the recrystallization temperature. For low levels of deformation, the α → γ → α transformations could take place without prior recrystallization. If so is the case, the deformed α structure (αDEF) can be expected to be transformed into deformed γ (γDEF) upon heat treatment, and then on cooling it would transform back into αDEF.
Then, graphs a and b of Figure 4 suggest that up to 21.2% deformation, at 900 ºC the αDEF → γDEF → αDEF transformation cycle may take place, whether the heat treatment lasts 15 or 30 minutes.
At 1000 ºC, on the other hand, the αDEF → γDEF → αDEF transformation cycle is valid only for 15 minutes of heat treatment. Apparently, as time at 1000 ºC is increased all the γ grains would adopt a gray texture, giving rise to α grains without a preferred orientation. The same would happen with 30.8% deformation at the two heat treatment temperatures. The analysis suggests that for 42% deformation at 900 ºC (Figures 4a and 4b) the αDEF → γDEF → αDEF cycle still takes place in a time of 15 minutes, however, at a temperature of 1000 ºC (Figures 5a and 5b) there would be recrystallization prior to the α → γ transformation. A 49.70% deformation is Figure 4. Efect of heat treatment on Poisson’s ratio ν31 and ν32 in
rolled samples. (a) 900 °C, 15 min.; (b) 900 °C, 30 min. (Dotted lines
indicate the range of luctuation of values of ν31 and ν32 before rolling).
The tests carried out at 1000 ºC (Figures 5a and 5b) show a behavior similar to the previous one, but only for a time of 15 minutes of treatment (Figure 5a). It is also seen that for deformations lower than 17.9% and greater than 30.8%, ν31 and ν32 are practically identical.
Therefore, only for the treatment at 1000 ºC for 30 minutes (Figure 5b), the samples, regardless of the degree of deformation to which they were subjected, return to a practically isotropic behavior.
Those results may be explained as follows: it would be expected that a cold-deformed ASTM A-36 steel sample, when heated above the upper critical temperature curve,
Figure 5. Efect of heat treatment on Poisson’s ratio ν31 and ν32 in rolled samples. (a) 1000 °C, 15 min.; (b) 1000 °C, 30 min. (Dotted
lines indicate the range of luctuation of the individual values of ν31
Figure 7. a) Sample rolled to 21.2%, and annealed at 900 ºC, 30 min.; b) sample rolled to 49.7%, and annealed at 1000 ºC, 30 min.
apparently suicient to produce some degree of recrystallization
prior to the α → γ transformation, because it is seen that the values tend toward those of the isotropic material. This practically 100% isotropic symmetry is achieved after 30 minutes at 1000 ºC for all degrees of deformation, as shown in Figure 5b, where Poisson’s ratios tend to 0.286, a value slightly higher than the range of the original samples from the hot rolled material.
As could be expected, the behavior of birefringence to the heat treatments is similar to that of Poisson’s ratio.
3.4 Hardness and metallographic analysis
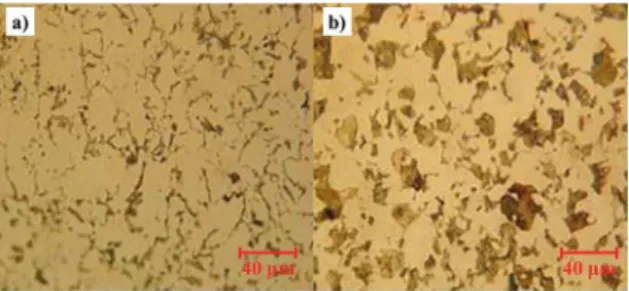
The micrographs shown in this section were taken at a
magniication of 500X. Figure 6a belongs to a material in its original state, showing an equiaxial ferrite plus pearlite
microstructure, typical of an ASTM A-36 steel. Figure 6b shows a micrograph of a rolled sample at a medium degree
of deformation, where, as expected, no signiicant change
is seen in the orientation of the grains. As is well known,
more sophisticated techniques, such as DRX and EBDS, are required to detect such changes. However, the results
obtained by ultrasound clearly show that it is possible, in a nondestructive mode, to detect the increased orthotropy at even the lowest degrees of deformation.
Figure 6. a) Material in its original state; b) sample rolled to 21.2%.
Figures 7a and 7b show that after the heat treatments
there is a slight diference in ferritic grain size compared
to the original sample (Figure 6a), and that in the sample treated at higher temperature there is the presence of colonies of thicker pearlite.
The hardness of all the heat-treated samples luctuated
randomly between 77 and 82 (HRB), with no relation to the temperature or time of treatment, showing a decrease of the hardness down to values lower in most cases than the average value obtained for the original plate.
The previous hardness results and the metallographic analysis show that those procedures do not allow following
up the process of modiication of anisotropy caused by
the heat treatment applied to the cold-rolled samples. In contrast, the determination of birefringence or Poisson’s
ratio by ultrasonic methods allows these modiications to
be distinguished precisely.
4. Conclusions
The main conclusions obtained from this work are the following:
• The mapping of Poisson’s ratio on the ASTM A-36 steel showed it to be nearly isotropic.
• It was shown experimentally that the efect of deformation by cold rolling on wave velocity, birefringence, and Poisson’s ratio is to shift the obtained data from their initial values in proportion to the degree of deformation applied.
• The above means that both birefringence and Poisson’s ratio make it possible to determine the degree of cold deformation and the hardness of the materials studied by means of simple linear relationships.
• The efect of the heat treatment in the austenitic
ield on cold-rolled samples depends on the degree
of deformation and on the temperature and time of treatment. Medium levels of deformation, low temperature and shorter austenization time tend to shift the values of birefringence and Poisson’s ratio from the original values of the material before the deformation; high levels of deformation, high temperatures, and longer austenization tend to return those values to the original ones of the material before its deformation.
It can be concluded, therefore, that even though the
times of light of the waves measured in diferent positions
show a random dispersion, it is feasible to use Poisson’s ratio as well as birefringence, both measured by ultrasound, as a simple and nondestructive method to follow up the anisotropy changes in rolled plates due to cold rolling and to post rolling heat treatments.
5. Acknowledgements
The authors acknowledge with thanks the inancial support provided by the Dirección de Investigaciones Cientíicas y
6. References
1. Rose JL. Ultrasonic Waves in Solid Media. Cambridge: Cambridge University Press; 1999. p. 27-33, 272-285.
2. Dieter GE. Mechanical Metallurgy. London: McGraw-Hill; 1988. p. 26-60.
3. Bray DE, Stanley RK. Elastic Wave Propagation. In: Bray DE, Stanley RK. Nondestructive Evaluation. A Tool in Design, Manufacturing, and Service. Boca Raton: CRC Press; 1996. p. 53-59.
4. Schneider E. Ultrasonic Techniques. In: Hauk V. Structural and Residual Stress Analysis by Nondestructive Methods: Evaluation, Application, Assessment. Amsterdam: Elsevier; 1997. p. 523-563.
5. Spies M, Schneider E. Nondestructive Analysis of Textures
in Rolled Sheets by Ultrasonic Techniques. Textures and Microstructures. 1990;12(4):219-231.
6. Sayers CM. Ultrasonic Determination of Texture and Residual Stress in Polycrystalline Metals. In: Alippi A, Mayer WG, eds.
Ultrasonic Methods in Evaluation of Inhomogeneous Materials. Nato Science Series E: Applied Sciences, No 126. Dordrecht: Springer; 1987. p. 367-379.
7. Delsanto PP, Mignogna RB, Clark AV Jr. Ultrasonic texture