Texture, Microstructure and Mechanical Properties of 6111 Aluminum Alloy Subject to
Rolling Deformation
Lixin Zhanga, Yihan Wanga, Xiaohui Yanga, Kai Lia, Song Nia*, Yong Dua, Min Songa
Received: June 04, 2017; Accepted: July 03, 2017
The mechanical properties, texture and microstructural evolution of a 6111 aluminum alloy during hot rolling and cold rolling deformation were systematically investigated in this article. The results
show that cold rolling and hot rolling have signiicant efects on the tensile behaviors of the alloy. The
shear texture and recrystallization texture mainly formed during the hot rolling deformation process,
while the rolling texture mainly formed during the cold rolling deformation. The grain reinement mechanisms depend signiicantly on the rolling process. Movement of shear zone and recrystallization are the main grain reinement mechanisms during the hot rolling process, while dislocations tangling is the main grain reinement mechanism during the cold rolling process. The recrystallization textures and shear textures afect the anisotropy in elongation but the rolling textures afect signiicantly the
anisotropy in yield strength.
Keywords: Al-Mg-Si alloy, texture, rolling, mechanical properties
* e-mail: [email protected]
1. Introduction
Aluminum alloys have been widely used in aviation, medical and automobile industries due to their high strength
to weight ratio, excellent corrosion and fatigue resistances, and good forming properties1-5. Since 6xxx aluminum alloys
(Al-Mg-Si-Cu series) show good bake hardening temper, 6xxx aluminum alloys are well suitable for automotive skin and other structure members in machinery6. The fabrication
process of a typical 6xxx alloy mainly consists of casting, scalping, homogenization, hot rolling, intermediate annealing, cold rolling, solution treatment, pre-aging, natural aging,
forming, painting and paint baking2,7. During the rolling
process, an ingot sheet will be deformed to the inal shape and size, accompanied by the generation of textures. Normally,
plastic deformation, such as rolling, extrusion and drawing, will form a strong texture, particularly at room temperature8-12.
For face centered cubic (f.c.c.) structured metals and alloys, the textures formed during rolling can be usually divided into
three main types: recrystallization texture, shear texture and rolling texture. One of the most accurate methods to measure
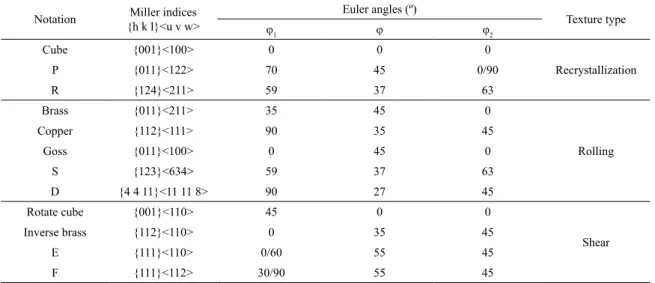
the texture is orientation density function (ODF), which could be obtained by the pole igure calculation of several diferent crystal surfaces. The diferent textures correspond to speciic Euler angles (φ1, φ, φ2) in ODF. Table 1 shows
the main textures and their corresponding Euler angles and Miller indices7,12-15.
Diferent processing parameters can generate various textures of the alloys, with diferent mechanical properties
and microstructures. For example, Wang et al.7 reported that
diferent heating rates during solution treatment resulted in the formation of diferent textures, and thus afected the mechanical properties and microstructures of Al-0.8Mg-0.9Si-0.5Cu-0.2Fe-0.1Mn alloy. The alloy after solution
treatment with fast heating rate shows a strong anisotropy
and Cube texture, thus weakens the mechanical properties.
While the alloy after solution treatment with slow heating
rate shows much weaker anisotropy and a combined texture of Cube, P, R, Goss and Brass components, with improved
mechanical properties. The grains of the fast heated alloy are almost equiaxed grains, while the slowly heated alloy comprises of elongated grains.
The textures of the materials can have a great inluence
on the mechanical performance. For example, Zhao et al.16
reported that the Goss-grains present a signiicant crack delection efect in the toughness testing, while Brass-grains, S-grains and Copper-grains have little inluence on the crack propagation in the toughness testing. Goss/Brass volume fraction ratio has great inluence on the fracture toughness
of the alloy, and the higher the ratio, the higher the fracture toughness of the materials16.
Most previous studies about the effect of texture
evolution on the mechanical properties of aluminum alloys are concentrated on just one single pass of the rolling, either hot rolling or cold rolling11,17-21. It should be noted that
multi-pass rolling deformation, including both cold rolling and hot rolling, are required for 6111 aluminum alloys to be used as automotive skin and other structural members in machinery,
and the texture evolution during each rolling pass might
the mechanical properties after each pass during the whole rolling process. In this paper, a 6111 aluminum alloy was
fabricated by ingot metallurgy, followed by hot rolling and cold rolling processes. The texture evolution and its efect on
the mechanical properties were systematically investigated.
2. Experimental
The alloy was fabricated by a medium frequency induction
furnace, using 99.9% pure aluminum, 99.9% pure magnesium,
99.9% pure iron, 99.9% pure nickel and master alloys of Al-50 wt.%Cu, Al-20 wt.%Si and Al-9 wt.% Mn. The ingot was casted in graphite crucible and then cooled down in
water cooled copper mould, and the dimension of the ingot is 100mm×100mm×60mm. The chemical composition of
ingot is determined by optical direct-reading spectrometer ARL-4460 after mechanical grinding and polishing. Table 2 shows the chemical composition of the fabricated alloy.
The surface oxide of the ingot was taken off by mechanical lapping and followed by homogenization
heat treatment under a vacuum condition for 20 hours at
555℃. After homogenization treatment, the ingot was cut
into 5 sheets with a dimension of 100mm×100mm×10mm
(length×width×height). The length, width and height of the sheets were used as the rolling direction (RD), the transverse direction (TD) and the normal direction (ND) during the subsequent rolling process, respectively. All the rolling passes were undertaken at a speed of 0.2 m s-1 under nominally dry
condition. The sheets was pre-heated in a mule furnace at 450℃ for 1 hour before rolling and followed by hot rolling
process. Then the sheets were hot rolled to 7 mm with the
rolling reduction of 30% (HR30) after the irst rolling pass.
During the second rolling pass the sheets were hot rolled to 5 mm with the accumulated rolling reduction of 50%
(HR50). After two passes of hot rolling deformation, the
sheets were natural cooled down to the room temperature. The cold rolling process was at room temperature with 1 mm reduction for each pass. After 2 passes of the cold rolling deformation, the height of the sheets was 3 mm with
the accumulated rolling reduction being 70% (HR+CR70). Finally, the sheets were rolled into 1 mm thick sheet, with the total rolling reduction of 90% (HR+CR90).
The microstructures and crystallographic texture of all
the samples were tested on the RD-TD sections. Bulk texture measurements were obtained from three incomplete pole igures {220}, {200}, {111} using a PANNalytical X’Pert-PRO MRD goniometer with a Cu tube operating at 40kV. Before texture measurements the samples were machined and carefully mechanically polished to obtain mirror-like
surfaces. All the texture measurements were performed on
10×8(RD×TD) mm2 surfaces of the rolling samples. The
microstructures of the samples were examined by electron backscattering difraction (EBSD) in a FEI Quanta FEG 250 ield emission scanning electron microscope (SEM). The samples for EBSD observations were electrolytic polished in a solution of 30 vol.% HNO3 methanol under a
temperature of -30℃ and an applied voltage of 14V. Dog-bone-shaped samples for mechanical properties testing
with 8 mm gauge length were machined and mechanically
polished. The mechanical properties of the diferent rolling
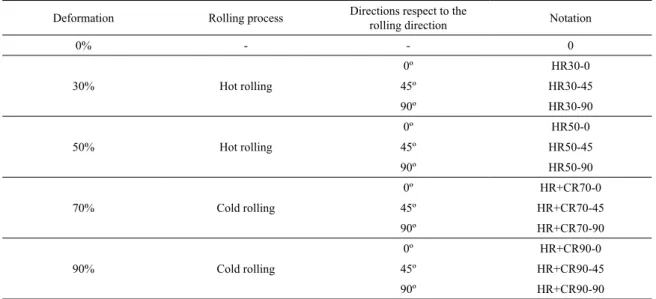
deformed samples were investigated at room temperature along the three directions of 0º, 45º and 90º with respect to the rolling direction. Deformation information and notation
of the samples were shown in Table 3. Mechanical properties Table 1. Miller indices and Euler angles of f.c.c. rolling and shear orientations.
Notation {h k l}<u v w>Miller indices Euler angles (º) Texture type
φ1 φ φ2
Cube {001}<100> 0 0 0
Recrystallization
P {011}<122> 70 45 0/90
R {124}<211> 59 37 63
Brass {011}<211> 35 45 0
Rolling
Copper {112}<111> 90 35 45
Goss {011}<100> 0 45 0
S {123}<634> 59 37 63
D {4 4 11}<11 11 8> 90 27 45
Rotate cube {001}<110> 45 0 0
Shear
Inverse brass {112}<110> 0 35 45
E {111}<110> 0/60 55 45
F {111}<112> 30/90 55 45
Table 2. Composition of the tested alloy (mass fraction, %).
Element Al Mg Si Cu Mn Fe Ni
were performed using an Instron-3369 universal testing machine with a strain rate of 1.5×10⁻⁵ s-1.
3. Results
3.1. Mechanical properties
Figure 1 shows the engineering stress-engineering strain
curves of the HR30, HR50, HR+CR70 and HR+CR90
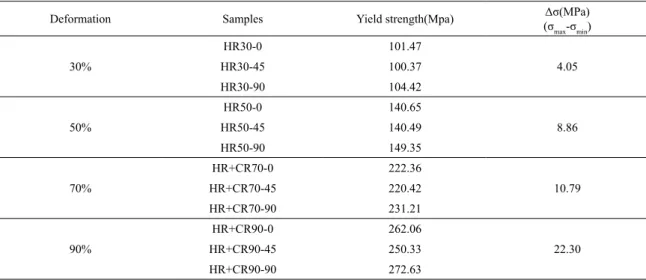
specimens along three directions of 0º, 45º, 90º with respect to the rolling direction, respectively. In order to clearly see the changes of anisotropy in mechanical properties during hot rolling and cold rolling deformation, the yield strength and
Δσ (The diference between the maximum yield stress and the minimum yield stress) of samples were listed in table 4. It can be seen from Figure 1a that the mechanical properties of the HR30 specimens along three diferent directions are almost the same, with the yield strength being about 100 MPa. With increasing the hot rolling deformation to 50%, the mechanical properties (particularly the elongation) of the HR50 specimens start to show diference along three directions, as shown in Figure 1b. The HR50-90 specimen has the highest yield strength but the lowest elongation, and the HR50-0 specimen shows the highest elongation but the
lowest yield strength. The variation of anisotropy of the yield
strength is very small, but the anisotropy of elongation shows signiicant diference during hot rolling deformation. After cold rolling deformation the yield strength of HR+CR70 along three directions shows signiicant diference, as shown in Figure 1c, and the Δσ is 10.79MPa as shown in table 4. The mechanical properties of HR+CR90 along three directions are
shown in Figure 1d. With the rolling deformation increasing
to 90%, the diference between the maximum yield strength and the minimum yield strength become larger with the Δσ being 22.30MPa as shown in table 4, and the anisotropy of
elongation along three directions shows similar trend to that
of HR+CR70. The HR+CR90-90 sample has the highest yield strength of about 272.63 MPa, while the HR+CR90-0 sample has the best elongation of about 10.04%. Obviously, the cold rolling deformation has signiicant inluence on
the mechanical properties of the alloy, especially for the anisotropy of the yield strength.
The mechanical properties of the specimens after diferent
rolling deformation along three directions were shown in
Figure 2. It can be seen that evolution trend of the mechanical
properties along three directions shows similar feature, with the strength increasing and elongation is decreasing with the rolling reduction. During the hot rolling deformation the yield strength of the alloy increase slightly with the increasing
of the hot rolling deformation but plastic loss is not much. But during cold rolling the yield of the alloy have a marked increase and plastic also decrease signiicantly. During tensile deformation, the hot rolled specimens show typical work
hardening after yielding, while the cold rolled specimens
shows typical softening after yielding. This diferent is
mainly due to the recovery during tensile deformation after cold rolling deformation.
3.2. Texture evolution
Bulk texture evolution of the alloy was measured using X-ray difraction. The main texture types for f.c.c. structured materials are shown in Table 1 and Figure 3a shows a schematic of the ideal positions of the prominent orientations for φ2=0º,
45º, 65º ODFs sections, respectively. The symbols with various colors in the igure indicate the location of standard
texture components in the 2D ODF. The main recrystallization
texture shown here is Cube {011}<211>. The main rolling texture components consist of Brass {011}<111>, Copper {112}<111>, Goss {011}<100>, S {123}<634> and D {4 4 Table 3. Deformation information and number of the samples.
Deformation Rolling process Directions respect to the
rolling direction Notation
0% - - 0
30% Hot rolling
0º HR30-0
45º HR30-45
90º HR30-90
50% Hot rolling
0º HR50-0
45º HR50-45
90º HR50-90
70% Cold rolling
0º HR+CR70-0
45º HR+CR70-45
90º HR+CR70-90
90% Cold rolling
0º HR+CR90-0
45º HR+CR90-45
Figure 1. Engineering stress-engineering strain curves of the samples (a) HR30, (b) HR50, (c) HR+CR70, (d) HR+CR90 along three
directions of 0º, 45º and 90º with respect to the rolling direction.
Table 4. Statistics of mechanical properties of samples.
Deformation Samples Yield strength(Mpa) (σΔσ(MPa)
max-σmin)
30%
HR30-0 101.47
4.05
HR30-45 100.37
HR30-90 104.42
50%
HR50-0 140.65
8.86
HR50-45 140.49
HR50-90 149.35
70%
HR+CR70-0 222.36
10.79
HR+CR70-45 220.42
HR+CR70-90 231.21
90%
HR+CR90-0 262.06
22.30
HR+CR90-45 250.33
HR+CR90-90 272.63
11}<11 11 8>. The main shear texture components consist of Rotate cube {001}<110>, Inverse brass {112}<110>, E {111}<110> and F {111}<112> (Table 1). Figure 3b-f shows the φ2=0º, 45º, 65º ODFs sections of the samples
0, HR30, HR50, HR+CR70 and HR+CR90, respectively. The ODFs with diferent rolling deformation have diferent
values corresponding to diferent angles of φ and φ1 , with
the φ2 being ixed as 0º, 45º, 65º. The crystal orientation of
sample 0 is random after homogenizing treatment, so the
ODFs of sample 0 as shown in Figure 3b show no obvious
show some textures in the ODFs, as shown in Figure 3c. The texture shown here are mainly shear texture and the intensity of the shear texture is not very strong, except for
texture E{111}<110>. The ODFs of the sample HR50 is
shown in Figure 3d. With increasing the hot rolling degree, the intensity of the shear texture and recrystallization texture
get stronger. After the irst cold rolling process, the intensity of the texture in ODFs of HR+CR70 sample has obvious
variation, as shown in Figure 3e. All the intensity of shear
textures becomes weaker, but all the intensity of rolling texture becomes stronger. With increasing the cold rolling deformation degree, the intensity of rolling textures become Figure 2. Engineering stress-engineering strain curves along three directions of (a) 0º, (b) 45º, (c) 90º with diferent rolling deformation.
Figure 3. (a) standard ODFs and ODFs of the samples (b) 0, (c) HR30, (d) HR50, (e) HR+CR70 and (f) HR+CR90.
stronger and the texture S{123}<634> is the strongest, as
shown in Figure 3f.
The volume fraction of diferent texture components are calculated from bulk texture analysis of the specimens.
Trends of all the textures are shown in Figure 4a. The sample after homogenization treatment shows random orientation,
without obvious texture. The evolution of the texture obviously
divided into two groups. The groups of the shear textures and
the recrystallization textures represented by dotted line and black line are dominant during the hot rolling deformation.
During the cold rolling deformation, the group of the rolling
textures represented by thin lines becomes stronger, and the shear textures and recrystallization textures become weaker. Figures 4b-4d shows the evolutions of the recrystallization texture, shear texture and rolling texture, respectively. Figure 4b shows the evolution of Cube texture. The volume fraction of Cube texture increases with increasing the hot rolling
deformation degree. During the cold rolling deformation, the
volume fraction of Cube texture decreases rapidly. Figure 4c shows the evolution of the shear textures. E texture and F
texture are constantly strengthened with increasing the hot
rolling deformation degree. Rotated cube texture and Inverse brass texture reach the maximum volume fractions for the sample HR30 and these textures become slightly weaker for
Rolling texture is very weak during hot rolling deformation. Most of the grains come up to a certain orientation to form strong rolling texture because of the severe grain rotation during cold rolling process. All the rolling textures become
stronger with increasing the cold rolling deformation, and S texture mainly formed at large cold rolling deformation stage.
3.3. Microstructures
Figure 5 shows the EBSD images of the samples 0, HR30, HR50, HR+CR70 and HR+CR90. The grains of the
sample 0 are almost equiaxed with random orientation and
the grain size is of ~350 μm, as shown in Figure 5a. After
30% hot rolling deformation the specimen starts to show
small misorientation inside the grains, as shown in Figure 5b.
The slight color transition inside the grains shown in Figure
5b represents a tiny orientation diference within the grains.
These misorientations are less than 15o and not large enough
to form a high angle grain boundary. Shearing deformation
and recrystallization led to the formation of a lot of small
grain bands inside the original grains (arrowed in Figure 5b).
With increasing the hot rolling deformation degree the grains
get further reinement, as shown in Figure 5c. Because of the
interaction of shear zone, dislocations and recrystallization
make some areas inside the grains break and reine, as shown in the circles in Figure 5c. After the irst pass cold
rolling deformation, the original grains are elongated along the rolling direction, as shown in Figure 5d. The original
grains were seriously broken and reined to smaller equiaxed grains, and the orientation of the broken grains is not all uniform during the irst pass cold rolling deformation. The broken small grains show similar orientation to the original
grains. With increasing the rolling deformation to 90%, the
grains formed banded structure along the ND after cold
rolling process, as shown in Figure 5e. The original grains
disappear completely and the orientation of the reined
grains is uniform.
Rolling process is not only to make the alloy sheet be deformed to the inal shape but also to reine the grains. Grains are reined by the interaction of dislocations during
deformation21. Usually the dislocation slip and the deformation
of the alloy are uneven. To coordinate the deformation,
geometrically necessary dislocations (GND) are generated and play an important role as a kind of coordination dislocations. Figure 4. The variations in the volume fraction of (a) all the textures, (b) recrystallization texture, (c) shear texture and (d) rolling texture
Figure 5. EBSD maps of the samples (a) 0, (b) HR30, (c) HR50, (d) HR+CR70 and (e) HR+CR90.
Many early works has explored the GND during deformation by EBSD22,23. The density of GND with diferent deformation
samples from EBSD is shown in Figure 6. During hot rolling deformation the density of the GND has no obvious increase with the density mainly between (0-10)×1012 m-2
and (10-20)×1012 m-2, as shown in Figure 6a and 6b. The
density of GND increases obviously mainly between (10-20)×1012 m-2 and(20-30)×1012 m-2 of HR+CR70. With the
increasing of the cold rolling deformation the density of
GND keep increasing. For the HR+CR90, the density of GND is mainly between (20-30)×1012 m-2 and (30-40)×1012
m2. In the process of hot rolling, the increase of density of
GND is not obvious, but in the process of cold rolling, the density of GND obviously increases with the increase of
rolling deformation.
4. Discussion
The experimental results have revealed that the rolling
deformation has signiicant inluence on the texture evolution
of 6111 aluminum alloy. During hot rolling deformation the recrystallization textures and shear textures dominate the microstructures, while the rolling texture dominates the microstructures during the cold rolling deformation.
The dislocations formed by rolling deformation provide
nucleation sites for the recrystallization. In addition,
the hot rolling temperature (>450℃) is higher than the recrystallization temperature (350~420℃) of 6111 aluminum alloy. High temperature and deformation are contributed to the recrystallization of the alloy so the volume fraction of Cube
texture constantly increases during the hot rolling process.
However, the volume fraction of Inverse brass texture and Rotate cube texture do not keep increasing with increasing the hot rolling deformation degree. It could be inferred that the formation of shear texture will be afected by the rolling
temperature and deformation degree during the hot rolling
process. Rotate cube texture and Inverse brass texture are mainly formed at low hot rolling deformation degree, and E
texture and F texture are enhanced with increasing the hot rolling deformation degree. During cold deformation, all
the rolling textures become stronger with increase the cold
rolling deformation degree, and S texture is mainly formed at large cold rolling deformation stage.
Defects nucleated during shear deformation could provide
nucleation sites for recrystallization. The combination of shear deformation and recrystallization make grains reinement
occurs at some regions inside the original grains. While cold
rolling deformation makes the original grains completely break into many equiaxed grains. During cold rolling process,
the temperature is not high enough for recrystallization
of the dislocations. The rearrangement of the dislocations
during deformation form many subgrains by generating small angle grain boundaries in the grains. And with increasing the deformation degree the small angle grain boundaries further transform into large angle grain boundaries. Then the banded structure was replaced by the small equiaxed grains. The inluence of grains reinement during the cold rolling process is more obvious than that during the hot
rolling process.
The density of geometrically necessary dislocations shown in Figure 6 proves that the pile-up of the dislocations is not severe during the hot rolling deformation since the density of the geometrically necessary dislocation changes little. During cold rolling deformation the increase of the density of the geometrically necessary dislocations with the cold rolling deformation degree proves that the pile-up of
the dislocations become more and more seriously.
Shear textures and recrystallization textures are mainly
formed during the hot rolling process, but rolling textures
are mainly formed during the cold rolling process. The
textures make the alloy have anisotropy in the mechanical
properties. The results from the tensile tests show that the
shear texture and recrystallization texture mainly inluence
the anisotropy of elongation along three directions of 0º,
45º and 90º with respect to the rolling direction, but have less inluence on the anisotropy of the yield strength. On
the contrary, the rolling texture mainly has inluence on the anisotropy of the yield strength along three directions, but has less inluence on the anisotropy of elongation.
5. Conclusion
This article conducted a detailed study of the mechanical properties, texture and microstructural evolution of a 6111
aluminum alloy subject to rolling deformation, with the following conclusions be drawn:
(1) During the hot rolling deformation, the main textures are shear texture and recrystallization texture. Diferent shear textures formed at diferent hot rolling deformation stage, with Rotate cube {001}<110> and Inverse brass {112}<110>
mainly forming at low deformation stage and other shear textures increasing with the hot rolling deformation degree. On the other hand, rolling texture dominates the cold rolling deformation, with S texture mainly forming at large rolling deformation stage during cold rolling deformation.
(2) The grain reinement mainly depends on shear
deformation and recrystallization during the hot rolling deformation process, and mainly depends on dislocations tangling during cold rolling deformation process.
(3) Diferent types of textures formed during the hot rolling and cold rolling processes have signiicant efects on
texture and shear texture make the alloy show anisotropy in elongation, and the rolling texture make the alloy show
anisotropy in the yield strength.
6. Acknowledgement
The inancial support from National Natural Science Foundation of China (51501230) is appreciated.
7. References
1. Burger GB, Gupta AK, Jefrey PW, Loyd DJ. Microstructural
control of aluminum sheet used in automotive applications.
Materials Characterization. 1995;35(1):23-39.
2. Engler O, Hirsch J. Texture control by thermomechanical
processing of AA6xxx Al-Mg-Si sheet alloys for automotive
applications—a review. Materials Science and Engineering: A. 2002;336(1-2):249-262.
3. Ghosh M, Miroux A, Kestens LAI. Correlating r-value and
through thickness texture in Al-Mg-Si alloy sheets. Journal of Alloys and Compounds. 2015;619:585-591.
4. Miller WS, Zhuang L, Bottema J, Wittebrood AJ, De Smet P,
Haszler A, et al. Recent development in aluminium alloys for the automotive industry. Materials Science and Engineering: A. 2000;280(1):37-49.
5. Hirsch J, Al-Samman T. Superior light metals by texture engineering: Optimized aluminum and magnesium alloys for automotive applications. Acta Materialia. 2013;61(3):818-843.
6. Engler O, Schäfer C, Myhr OR. Efect of natural ageing and
pre-straining on strength and anisotropy in aluminium alloy AA 6016. Materials Science and Engineering: A. 2015;639:65-74.
7. Wang X, Guo M, Cao L, Luo J, Zhang J, Zhuang L. Efect of
heating rate on mechanical property, microstructure and texture
evolution of Al-Mg-Si-Cu alloy during solution treatment.
Materials Science and Engineering: A. 2015;621:8-17.
8. Guo F, Zhang D, Fan X, Jiang L, Yu D, Pan F. Deformation behavior of AZ31 Mg alloys sheet during large strain hot rolling
process: A study on microstructure and texture evolutions of an intermediate-rolled sheet. Journal of Alloys and Compounds. 2016;663:140-147.
9. Zhang LX, Chen WZ, Zhang WC, Wang W, Wang E. Microstructure and mechanical properties of thin ZK61 magnesium alloy sheets by extrusion and multi-pass rolling with lowered temperature.
Journal of Materials Processing Technology. 2016;237:65-74.
10. Gatti JR, Bhattacharjee PP. Annealing textures of severely cold and warm-rolled Al-2.5 wt.%Mg alloy. Journal of Alloys and Compounds. 2014;615:950-961.
11. Chen Y, Tian N, Zhao G, Liu C, Zuo L. Evolution of {001} <110> orientation and related lattice rotation of Al alloy 6111
during rolling. Transactions of Nonferrous Metals Society of China. 2007;17(3):523-530.
12. Lapovok R, Timokhina I, McKenzie PWJ, O’Donnell R. Processing and properties of ultraine-grain aluminium alloy
6111 sheet. Journal of Materials Processing Technology.
2008;200(1-3):441-450.
13. Su L, Lu C, Gazder AA, Saleh AA, Deng G, Tieu K, et al.
Shear texture gradient in AA6061 aluminum alloy processed
by accumulative roll bonding with high roll roughness. Journal of Alloys and Compounds.2014;594:12-22.
14. Barnwal VK, Raghavan R, Tewari A, Narasimhan K, Mishra SK. Efect of microstructure and texture on forming behaviour
of AA-6061 aluminium alloy sheet. Materials Science and Engineering: A. 2017;679:56-65.
15. Yang X, Wang D, Wu Z, Yi J, Ni S, Du Y, et al. A coupled EBSD/TEM study of the microstructural evolution of multi-axial compressed pure Al and Al-Mg alloy. Materials Science and Engineering: A. 2016;658:16-27.
16. Zhao Q, Liu Z, Huang T, Xia P, Li F. Enhanced fracture toughness in an annealed Al-Cu-Mg alloy by increasing Goss/Brass texture
ratio. Materials Characterization. 2016;119:47-54.
17. Wang JS, Hsieh CC, Lin CM, Kuo CW, Wu W. Texture Evolution and Residual Stress Relaxation in a Cold-Rolled Al-Mg-Si-Cu Alloy Using Vibratory Stress Relief Technique. Metallurgical and Materials Transactions A. 2013;44(2):806-818.
18. Wang X, Guo M, Zhang Y, Xing H, Li Y, Luo J, et al. The
dependence of microstructure, texture evolution and mechanical
properties of Al-Mg-Si-Cu alloy sheet on inal cold rolling
deformation. Journal of Alloys and Compounds. 2016;657:906-916.
19. Quadir MZ, Al-Buhamad O, Bassman L, Ferry M. Development of a recovered/recrystallized multilayered microstructure in Al alloys by accumulative roll bonding. Acta Materialia.
2007;55(16):5438-5448.
20. Yang H. Key factors for warm rolled bond of 611l-aluminium
strip. Transactions of Nonferrous Metals Society of China. 2006;16:84-90.
21. Yang X, Ni S, Song M. Partial dislocation emission in a superine grained Al-Mg alloy subject to multi-axial compression.
Materials Science and Engineering: A. 2015;641:189-193.
22. Ruggles TJ, Fullwood DT, Kysar JW. Resolving geometrically
necessary dislocation density onto individual dislocation
types using EBSD-based continuum dislocation microscopy.
International Journal of Plasticity. 2016;76:231-243.
23. Wallis D, Hansen LN, Britton TB, Wilkinson AJ. Geometrically necessary dislocation densities in olivine obtained using high-angular resolution electron backscatter difraction.