Facial Synthesis of Carrageenan/Reduced Graphene Oxide/Ag Composite as Eicient SERS
Platform
Yuhong Zhenga*, Aiwu Wangb, Zhong Wanga, Li Fua, Feng Penga
Received: April 8, 2016; Revised: September 17, 2016; Accepted: October 20, 2016
In this paper, we reported the preparation of carrageenan/reduced graphene oxide/Ag composite (CA-RGO-Ag) by a wet chemical method at room temperature using carrageenan, graphene oxide and silver nitrate as starting materials. As-prepared composite was characterized by UV-vis spectroscopy, Raman spectroscopy, FTIR, SEM, EDX and XRD. Results showed that the reduction of graphene oxide (GO) and silver nitrate was achieved simultaneously by addition of NaBH4. Surface-enhanced Raman scattering study showed that the obtained composite give an intensive and enhanced Raman scattering when Rhodamine B was used as a probing molecule.
Keywords: Composite, Ag NPs, SERS, Graphene, Carrageenan, Adenine
* e-mail: yuhongzhengcas@gmail.com
1. Introduction
Surface enhanced Raman scattering (SERS) is a powerful analytical tool that can provide ultrasensitive detection of chemical and biological molecules down to the single
molecular level, which has been used in various ields of
chemistry, material science and biophysics1. There are two
SERS mechanisms that are generally accepted: electromagnetic mechanism (EM) and chemical mechanism (CM)2-4. EM is
based on the enhancement of the local electromagnetic ield
while the CM is based on charge transfer between absorbed molecules and substrate surface. Up to now, many surfaces have been successfully investigated as SERS active substrates such as Ag, Au, Cu, Na, Li, Pd, Pt, the best performances for detection purposes have been recorded in the case of Ag and Au nanoparticles5-16.
Graphene, a two-dimensional monolayer sheet of hexagonal carbon atoms, has attracted great attention because of its unique structure and exceptional physiochemical properties17-20. It has previously been reported to play a role
as a Raman enhancement substrate because target molecules
can easily form a uniied orientation on it due to the latness
of the graphene surface21,22. Moreover, the interconnected
sp2 network of graphene gives it the ability to undergo π−π
stacking with aromatic molecules23,24. However, most of
the graphene used for preparing SERS substrate are in its reduced form from graphene oxide (GO) prepared by the oxidation of graphite. The reduced graphene oxide (RGO) is prone to irreversible spontaneous agglomeration, which highly limits its applications and performances25,26. Therefore,
surface functionalization is considered as an efective way
to solve this problem27-31. In this report, we prepared an
enhanced sensitivity for SERS detection using carrageenan functionalized RGO-Ag (CA-RGO-Ag) composite. The prepared composite was characterized by a series of techniques and its SERS property was evaluated by the detection of Rhodamine B (RhB) and adenine.
2. Experimental
2.1 Materials
Synthetic graphite (average particle diameter <20 μm), Rhodamine B (RhB), adenine, silver nitrate (AgNO3), k-carrageenan and sodium borohydrid (NaBH4) were purchased from Sigma-Aldrich. All other chemicals used were analytical
grade reagents without further puriication. Milli-Q water (18.2 MΩ cm) was used throughout the experiments.
2.2 Synthesis of CG/RGO/Ag composite
Graphene oxide was prepared using modiied Hummer’s
method32,33. In a typical procedure, 125 ml of concentrated
sulfuric acid was taken into a lask illed with graphite
powder (5 g) followed by the addition of KMnO4 (17.5 g) slowly at 0 °C. The mixture was stirred for 3 h at 35 °C and then diluted by water at 0 °C. After that, H2O2 (30 vol.% in water) was added into mixture until the bubbling of the gas was completed. The graphene oxide (GO) powder was collected by centrifugation of the solution and subsequently dried under vacuum at 80°C for 24 h.
To synthesize CG/RGO/Ag composite, 0.5 mg carrageenan was dissolved into 50 mL water by 30 min sonication to form a brown solution. 10 mL GO dispersion (1 mg/mL) was
a Institute of Botany, Jiangsu Province and Chinese Academy of Sciences, Nanjing Botanical Garden, Memorial Sun Yat-Sen, Nanjing 210014, China
added into carrageenan solution for 1 h stirring. After that, a certain amount of AgNO3 solution (50 mM) was added into the mixture for another hour stirring. Then, 1 mL NaBH4 solution (0.5 M) was added to the above mixture dropwise. The color of the mixture turned from brown to black. After 30 min stirring, the composite was centrifuged, washed and dried at 80°C for 24 h. (denoted as CG/RGO/Ag-1, CG/RGO/ Ag-2, CG/RGO/Ag-3, CG/RGO/Ag-4, CG/RGO/Ag-5 and CG/RGO/Ag-6 for the weight ratios of GO and AgNO3 set as 1:5, 1:10, 1:20, 1:30, 1:40 and 1:50, respectively). CG/RGO and RGO/Ag sample also synthesized using a similar method except addition of AgNO3 and carrageenan, respectively.
2.3 Characterizations
Surface morphology of samples were analyzed by scanning electron microscope (SEM, S-4700, HITACHI). FTIR spectra were obtained using a Nicolet 8700 FTIR spectrometer
(Thermo Scientiic Instrument). X-ray difraction patterns were collected from 10° to 60° in 2θ by a XRD with Cu Kα radiation (D8-Advanced, Bruker). Raman analysis was
carried out at room temperature using a Raman spectroscope (Renishaw InVia, UK) with a 514 nm laser light. The optical characterizations were obtained by UV-vis spectrophotometer in the wavelength range from 200 to 500 nm.
2.4. SERS study
For SERS study, 20 μL of CA-RGO-Ag dispersion
was dropped onto the glass substrate and dried at room
temperature. Then, 20 μL of 1.0 × 10─4 M ethanol solution
was dropped onto the CA-RGO-Ag ilms and dried at room
temperature, and SERS spectra were recorded, respectively.
3. Results and Discussion
UV-vis spectroscopy was used for conirming the formation
of Ag nanoparticles (NPs) and reduction of GO. Figure 1A displays the UV-vis spectra of GO and CA-RGO-Ag composite. It can be seen that the spectrum of GO exhibits two characteristic absorption peaks at 227 nm and 315 nm,
corresponding to π─π* transitions of aromatic C─C bonds and n─π* transitions of C=O bonds, respectively34. However,
the peak at 227 nm of GO dispersion gradually red-shifts to 262 nm and the shoulder absorption peak at 316 nm disappear in the spectrum of CA-RGO-Ag-6, which indicates the GO has been reduced by NaBH4. Furthermore, a new broad absorption peak at 425 nm is observed in the spectrum of CA-RGO-Ag-6, which could assign to the surface plasmon resonance absorption band of Ag nanoparticles, suggesting the successful formation of Ag NPs.
Figure 1B displays the FTIR spectra of GO and CA-RGO-Ag-6. As expected, the spectrum of GO exhibits signals at 3432, 1638, 1156 and 1038 cm─1 corresponding to the
─OH vibration stretching, carboxyl C=O, epoxy C─O and alkoxy C─O, respectively35. It can be seen that these peaks
show a relatively lower intensity or even vanished in the
spectrum of CA-RGO-Ag-6, further conirm the reduction of
GO. Moreover, the spectrum of CA-RGO-Ag-6 also shows peaks at 1225, 915 and 852 cm─1, which could be assigned as the characteristic peaks of carrageenan, suggesting the successful surface functionalization of carrageenan36,37.
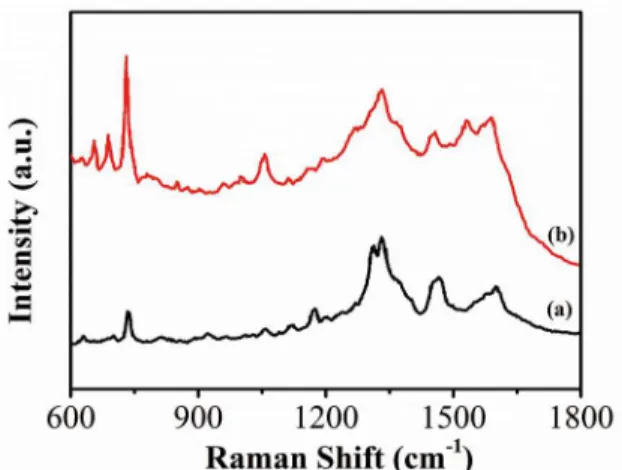
Raman spectroscopy was also used for determining the structural changes of the as-prepared samples. The Raman spectra of graphite, GO and CA-RGO-Ag-6 are shown in Figure 2. As expected, a prominent peak at 1580 cm─1 is
observed in graphite sample, which corresponds to the
irst-order scattering of the E2g. The spectrum of GO displays two characteristic main peaks for D band at 1330 cm─1 and G bands at 1585 cm─1. The G band is attributed to all sp2 carbon
forms and provides information on the in-plane vibration of sp2 bonded carbon atoms while the D band suggests the
presence of sp3 defects38. The intensity ratio between D
band and G band (ID/IG) increases from 0.91 in GO to 1.1 in CA-RGO-Ag-6 is due to the decrease of average size of sp2 domains by reduction of GO39.
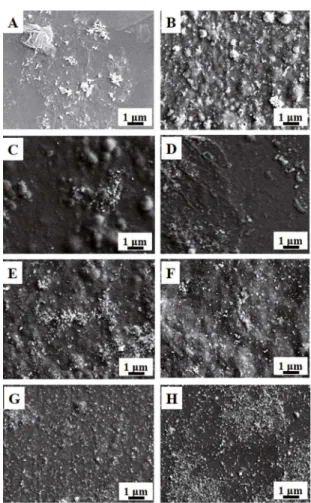
The morphology of as-prepared samples were examined by SEM. Figure 3A-H shows the top-view SEM images of RGO-Ag, CA-Ag, CA-RGO-Ag-1, CA-RGO-Ag-2, RGO-Ag-3, RGO-Ag-4, RGO-Ag-5 and CA-RGO-Ag-6. It can be observed that the RGO-Ag (Figure
3A) exhibits a completely diferent morphology compared
with carrageenan involved samples. The Ag NPs show an aggregated cluster form and touch on the RGO sheet surface. Compared with CA-RGO-Ag samples, the Ag NPs formed in the CA-Ag sample (Figure 3B) exhibits a much larger size. For CA-RGO-Ag samples, the RGO sheets are embedded into carrageenan gel. On the surface, we could observe a uniform distribution of single Ag nanoparticles when a higher AgNO3 content was introduced during the preparation. The average size of the Ag NPs can be calculated to be 22 nm (for CA-RGO-Ag-5) based on 100 individual Ag NP size measurements. EDX analysis has been used to obtain elements information about CA-RGO-Ag-6 (Figure 4). The spectrum presents the only existence of C, O (belong to RGO), S (belongs to carrageenan) and Ag (belongs to Ag NPs), indicating the successful formation of composite with high purity.
The powder X-ray difraction of the samples are shown
in Figure 5. It is clear that the XRD pattern has peaks at 25.29°, which correspond to (002) crystal planes of graphite, indicating the presence of layered RGO sheets structure.
Other difraction peaks at 30.1°, 34.4°, 48.2°, 57.1°, 69.9°
and 76.5° correspond to the (111), (200), (220), (311), (400) and (222) lattice planes of the Ag NPs, respectively.
RhB was chosen as the model molecule to examine the performance of CA-RGO-Ag SERS substrates. Figure 6
Figure 1: (A) UV-vis and (B) FTIR spectra of GO and CA-RGO-Ag-6.
Figure 2: Raman spectra of graphite, GO and CA-RGO-Ag-6.
Figure 3: SEM images of (A) RGO-Ag, (B) CA-Ag, (C) CA-RGO-Ag-1, (D) CA-RGO-Ag-2, (E) CA-RGO-Ag-3, (F) CA-RGO-Ag-4, (G) CA-RGO-Ag-5 and (H) CA-RGO-Ag-6.
RGO-Ag and CA-RGO-Ag-3 substrates. It can be found that the 10─4 M RhB molecules alone (a) almost have no Raman signals. However, the spectra collected from RGO-Ag and CA-RGO-Ag-3 substrates all show distinct peaks at 624
(C─C─C ring in plane bend), 760 (C─H out of plane bend), 829 (C─C), 938 (C─H stretch), 1076 (β (CH)), 1191 (C─H in plane bend), 1277, 1362, 1502 (Arom C─H stretch), 1567, 1650 (Arom C─C stretch) and 1596 cm─1 (C─H stretch)40-42.
Compared SERS signals on RGO-Ag (b) with the ones on CA-RGO-Ag-2 (c), it can be found the SERS signal on CA-RGO-Ag-3 is stronger than the one on RGO-Ag, which could attract to both electromagnetic and chemical factors. As observed in the SEM characterizations, the introduction
of carrageenan efectively prevents the formation of large
cluster Ag NPs on the RGO sheets. The uniform distributed small Ag NPs play the role of electromagnetic hot spots that
have intense local electromagnetic ields, resulting in highly eicient Raman scattering43. On the other hand, the carrageenan
surface functionalization could prevent the aggregation of RGO sheets, which could adsorb and concentrate the target molecules and magnify the SERS signal44.
In order to optimize the performance, the SERS spectra
were collected from the CA-RGO-Ag substrate with diferent composition. Figure 7 shows a set of the SERS spectra of 1×10─4
Figure 4: EDX spectrum of CA-RGO-Ag-6.
Figure 5: XRD pattern of CA/RGO/Ag-6.
Figure 6: SERS spectra of (a) 10─4 M RhB molecules on glass reference surface, (b) 10─4 M RhB adsorbed on the RGO-Ag and (c) CA-RGO-Ag-3 substrates.
all the spectra, the SERS spectrum collected from CA-RGO-Ag-5 shows the highest enhancement performance, which could ascribe to the uniformity of Ag NPs distribution and optimized Ag NPs size adjusted by the interaction between Ag+ and GO during the preparation process. Therefore, the
Figure 7: SERS spectra of 10─4 M RhB molecules on (a) CA-RGO-Ag-1, (b) CA-RGO-Ag-2, (c) CA-RGO-Ag-3. (d) CA-RGO-Ag-4, (e) CA-RGO-Ag-6 and (f) CA-RGO-Ag-5 substrates.
Figure 8: SERS spectra of 10─4 M adenine on (a) RGO-Ag and (b) CA-RGO-Ag-5 substrate.
weight ratio of GO and AgNO3 for fabricating CA-RGO-Ag SERS substrate was set as 1: 40.
The practical application of CA-RGO-Ag SERS substrate was tested by detection of adenine, a kind of nucleotide based for DNA sequencing. The SERS spectra of adenine
(1 × 10─4 M) on the RGO-Ag and CA-RGO-Ag-5 are shown
in Figure 8. It can be found that four characteristic peaks are pronounced at 730, 1332, 1444 and 1587 cm─1, which are corresponded to the purine ring breathing mode, the C-N stretching mode, C-N in plane stretching mode and sciss NH2, respectively45,46. Moreover, three peaks at 655, 687 and
1054 cm─1were also observed when using CA-RGO-Ag-5 as SERS substrate, indicating the proposed substrate exhibits an excellent SERS activity towards detection of adenine.
4. Conclusion
activity of the CA-RGO-Ag substrate was optimized by varying the weight ratio of AgNO3 and GO in the preparation process. The improved activity can be attributed to the uniform distributed small Ag NPs, which provides intense local
electromagnetic ields, resulting in highly eicient Raman
scattering. On the other hand, the carrageenan functionalized RGO sheets adsorb and concentrate the target molecules and magnify the SERS signal.
5. References
1. Tripp RA, Dluhy RA, Zhao Y. Novel nanostructures for SERS biosensing. Nanotoday. 2008;3(3-4):31-37.
2. Lombardi JR, Birke RL. A Uniied View of Surface-Enhanced Raman
Scattering. Accounts of Chemical Research. 2009;42(6):734-742.
3. Schwartzberg AM, Grant CD, Wolcott A, Talley CE, Huser TR, Bogomolni R, et al. Unique Gold Nanoparticle Aggregates as a Highly Active Surface-Enhanced Raman Scattering Substrate. The Journal of Physical Chemistry B. 2004;108(50):19191-19197.
4. Yoon I, Kang T, Choi W, Kim J, Yoo Y, Joo SW, et al. Single
Nanowire on a Film as an Eicient SERS-Active Platform.
Journal of the American Chemical Society. 2008;131(2):758-762.
5. Stiuiuc R, Iacovita C, Lucaciu C, Stiuiuc G, Dutu A, Braescu
C, et al. SERS-active silver colloids prepared by reduction of silver nitrate with short-chain polyethylene glycol. Nanoscale Research Letters. 2013;8:47.
6. Otsuka H, Nagasaki Y, Kataoka K. PEGylated nanoparticles for biological and pharmaceutical applications. Advanced Drug Delivery Reviews. 2003;55(3):403-419.
7. Hameed A, Khan I, Azam A, Naz SS, Khan A, Saleem M, et al. Stability and enzyme inhibition activities of Au nanoparticles using an aqueous extract of clove as a reducing and stabilizing agent.
Journal of the Chemical Society of Pakistan. 2014;36(3):542-547.
8. Piergies N, Kim Y, Proniewicz E. Potential-dependant SERS interaction of ortho-substituted N-benzylamino(boronphenyl) methylphosphonic acid with Ag, Au, and Cu electrode surfaces.
Vibrational Spectroscopy. 2016;83:94-100.
9. Guo M, Zhao Y, Zhang F, Xu L, Yang H, Song X, et al. Reduced graphene oxide-stabilized copper nanocrystals with enhanced catalytic activity and SERS properties. RSC Advances. 2016;6(56):50587-50594.
10. Li R, Yang G, Yang J, Han J, Liu J, Huang M. Determination
of melamine in milk using surface plasma efect of aggregated
Au@SiO2 nanoparticles by SERS technique. Food Control. 2016;68:14-19.
11. Guo TL, Li JG, Sun X, Sakka Y. Improved galvanic replacement growth of Ag microstructures on Cu micro-grid for enhanced SERS detection of organic molecules. Materials Science and Engineering: C. 2016;61:97-104.
12. Kang T, Jeong S, Kang H, Kim J, Kim HM, Kyeong S, et al. Fabrication of Ag nanoaggregates/SiO2 yolk–shell nanoprobes for surface-enhanced Raman scattering. Journal of Industrial & Engineering Chemistry. 2015;32:34-38.
13. Šubr M, Petr M, Peksa V, Kylián O, Hanuš J, Procházka M. Ag Nanorod Arrays for SERS: Aspects of Spectral Reproducibility, Surface Contamination, and Spectral Sensitivity. Journal of
Nanomaterials. 2015;2015:729231.
14. Cui L, Chen S, Zhang K. Efect of toxicity of Ag nanoparticles on
SERS spectral variance of bacteria. Spectrochimica Acta Part A: Molecular and Biomolecular Spectroscopy. 2015;137:1061-1066.
15. Khlebtsov BN, Liu Z, Ye J, Khlebtsov NG. Au@Ag core/shell cuboids and dumbbells: Optical properties and SERS response.
Journal of Quantitative Spectroscopy & Radiative Transfer. 2015;167:64-75.
16. Lai W, Zhou J, Liu Y, Jia Z, Xie S, Petti L, et al. 4MBA-labeled Ag-nanorod aggregates coated with SiO2: synthesis, SERS activity, and biosensing applications. Analytical Methods. 2015;7(20):8832-8838.
17. Xu Y, Liu Z, Zhang X, Wang Y, Tian J, Huang Y, et al. A Graphene Hybrid Material Covalently Functionalized with Porphyrin: Synthesis and Optical Limiting Property. Advanced Materials. 2009;21(12):1275-1279.
18. Wang D, Choi D, Li J, Yang Z, Nie Z, Kou R, et al. Self-Assembled TiO2–Graphene Hybrid Nanostructures for Enhanced Li-Ion Insertion. ACS Nano. 2009;3(4):907-914.
19. Yoo E, Kim J, Hosono E, Zhou H, Kudo T, Honma I. Large Reversible Li Storage of Graphene Nanosheet Families for Use in Rechargeable Lithium Ion Batteries. Nano Letters. 2008;8(8):2277-2282.
20. Ma XY, Chen MF, Chao MY. Voltammetric Determination
of Sudan II in Food Samples at Graphene Modiied Glassy Carbon Electrode Based on the Enhancement Efect of Sodium
Dodecyl Sulfate. Journal of the Chemical Society of Pakistan. 2013;35(1):30-36.
21. Ling X, Xie L, Fang Y, Xu H, Zhang H, Kong J, et al. Can Graphene be used as a Substrate for Raman Enhancement?
Nano Letters. 2009;10(2):553-561.
22. Jung N, Crowther AC, Kim N, Kim P, Brus L. Raman Enhancement on Graphene: Adsorbed and Intercalated Molecular Species.
ACS Nano. 2010;4(11):7005-7013.
23. Wojcik A, Kamat PV. Reduced Graphene Oxide and Porphyrin.
An Interactive Afair in 2-D. ACS Nano. 2010;4(11):6697-6706.
24. Emery JD, Wang QH, Zarrouati M, Fenter P, Hersam MC,
Bedzyk MJ. Structural analysis of PTCDA monolayers on epitaxial graphene with ultra-high vacuum scanning tunneling
microscopy and high-resolution X-ray relectivity. Surface
Science. 2011;605(17-18):1685-1693.
25. Wang G, Shen X, Wang B, Yao J, Park J. Synthesis and characterisation of hydrophilic and organophilic graphene nanosheets. Carbon. 2009;47(5):1359-1364.
26. Kochnev AS, Ovid’ko IA, Semenov BN. Tensile strength of
graphene containing 5-8-5 defects. Reviews on Advanced Materials Science. 2014;37(1-2):105-110.
28. Liu S, Bao H, Li L. Thermoreversible gelation and scaling laws
for graphene oxide-illed κ-carrageenan hydrogels. European
Polymer Journal. 2016;79:150-162.
29. Wang J, Ouyang Z, Ren Z, Li J, Zhang P, Wei G, et al.
Self-assembled peptide nanoibers on graphene oxide as a novel
nanohybrid for biomimetic mineralization of hydroxyapatite.
Carbon. 2015;89:20-30.
30. Zhu D, Nakamura H, Zhu H, Xu C, Matsuo M. Microibers from interpolymer complexation of κ-carrageenan and oligomers
of polyaniline for glucose detection. Synthetic Metals. 2015;202:133-139.
31. Song F, Li X, Wang Q, Liao L, Zhang C. Nanocomposite
Hydrogels and Their Applications in Drug Delivery and Tissue Engineering. Journal of Biomedical Nanotechnology. 2015;11(1):40-52.
32. Park S, An J, Piner RD, Jung I, Yang D, Velamakanni A, et al.
Aqueous Suspension and Characterization of Chemically Modiied
Graphene Sheets. Chemistry of Materials. 2008;20(21):6592-6594.
33. Hummers WS Jr., Ofeman RE. Preparation of Graphitic Oxide.
Journal of the American Chemical Society. 1958;80(6):1339.
34. Paredes JI, Villar-Rodil S, Mart́nez-Alonso A, Tasćn JMD. Graphene Oxide Dispersions in Organic Solvents. Langmuir. 2008;24(19):10560-10564.
35. Liu Z, Robinson JT, Sun X, Dai H. PEGylated Nanographene Oxide for Delivery of Water-Insoluble Cancer Drugs. Journal of the American Chemical Society. 2008;130(33):10876-10877.
36. Zuo PP, Zhang YL, Feng HF, Xia W, Zhang WQ, Wang MZ.
Fabrication and Properties of Graphene Oxide-reinforced Carrageenan Film. Chemical Journal of Chinese Universities. 2013;34(3):692-697.
37. Sun YJ, Wang CJ, Geng TF, Wang ZF, Huang LJ. Analysis of
κ-Carrageenan Oligosaccharides by LC-ESI-MS/MSn with
3-Amino-9-ethylcarbazole Derivatization. Acta Chimica Sinica. 2011;69(14):1697-1704.
38. Yang D, Velamakanni A, Bozoklu G, Park S, Stoller M, Piner
RD, et al. Chemical analysis of graphene oxide ilms after heat
and chemical treatments by X-ray photoelectron and Micro-Raman spectroscopy. Carbon. 2009;47(1):145-152.
39. Li X, Wang Q, Zhao Y, Wu W, Chen J, Meng H. Green synthesis
and photo-catalytic performances for ZnO-reduced graphene oxide nanocomposites. Journal of Colloid and Interface Science. 2013;411:69-75.
40. Jung GB, Kim JH, Burm JS, Park HK. Fabrication of chitosan-silver nanoparticle hybrid 3D porous structure as a SERS substrate for biomedical applications. Applied Surface Science. 2013;273:179-183.
41. Yu X, Cai H, Zhang W, Li X, Pan N, Luo Y, et al. Tuning Chemical Enhancement of SERS by Controlling the Chemical Reduction of Graphene Oxide Nanosheets. ACS Nano. 2011;5(2):952-958.
42. Jung GB, Bae YM, Lee YJ, Ryu SH, Park HK. Nanoplasmonic Au nanodot arrays as an SERS substrate for biomedical applications.
Applied Surface Science. 2013;282:161-164.
43. Inoue M, Ohtaka K. Surface enhanced raman-scattering by metal
spheres. 1. Cluster efect. Journal of the Physical Society of
Japan. 1983;52(11):3853-3864.
44. Ren W, Fang Y, Wang E. A Binary Functional Substrate for Enrichment and Ultrasensitive SERS Spectroscopic Detection of Folic Acid Using Graphene Oxide/Ag Nanoparticle Hybrids.
ACS Nano. 2011;5(8):6425-6433.
45. Zhao H, Fu H, Zhao T, Wang L, Tan T. Fabrication of small-sized silver NPs/graphene sheets for high-quality surface-enhanced Raman scattering. Journal of Colloid and Interface Science. 2012;375(1):30-34.