Article
Printed in Brazil - ©2017 Sociedade Brasileira de Química0103 - 5053 $6.00+0.00*e-mail: [email protected], [email protected]
Graphene Oxide/Zinc Oxide (GO/ZnO) Nanocomposite as a Superior Photocatalyst
for Degradation of Methylene Blue (MB)-Process Modeling by Response Surface
Methodology (RSM)
Seyed A. Hosseini* and Shabnam Babaei
Department of Applied Chemistry, Faculty of Chemistry, Urmia University, Urmia, Iran
The photocatalytic performance of graphene oxide/zinc oxide (GO/ZnO) nanocomposite was investigated for degradation of methylene blue (MB) from wastewater and was compared with that of zinc oxide (ZnO), graphene oxide (GO) and carbon nanotube/zinc oxide (CNT/ZnO). The properties of the GO/ZnO nanocomposite were characterized by X-ray diffraction (XRD), Fourier transform infrared (FTIR), scanning electron microscopy (SEM) and transmission electron microscopy (TEM). The SEM and TEM results revealed the nanostructure of the composite. The photocatalytic process was modeled by response surface methodology (RSM), considering four independent factors. The significance of the model was approved by analysis of variance (ANOVA) (determination coefficient R2 = 0.95, R2
adj = 0.91). The optimum conditions of the process were
found to be at photocatalyst dosage, initial pH, H2O2 concentration and irradiation time of 2.1 g L-1,
4.5, 3.5 × 10⁻⁴ mol L-1 and 140 min, respectively. The removal of MB over GO/ZnO was 99% under
the optimum conditions and was superior than that over GO and CNT/ZnO. According to Pareto analysis of the modeling, the irradiation time and photocatalyst dosage were the most effective factors on the decolorization efficiency of methylene blue, respectively.
Keywords: photocatalyst, nanocomposite, graphene oxide, response surface methodology, dye removal
Introduction
The presence of organic dye in aqueous environments can cause detrimental effects on aquatic life and
subsequently human health.1 Photocatalysis, one of
advanced oxidation processes (AOPs), is an efficient technique for water and air purification due to its several
advantages.2 Zinc oxide (ZnO), with a large band gap
(3.37 eV), is one of the most popular photocatalysts due to its chemical stability, non-toxicity nature and high photocatalytic activity in the removal of pollutants in
water or air.3 Despite its great potential, the photocatalytic
efficiency of ZnO has been often low because of the fast recombination of the photogenerated electron-hole pairs and the limited photoresponding range. Therefore, various strategies, including structural design, noble metal loading, ion doping, and the coupling of semiconductors, have been proposed to extend the light absorption range
or suppress the electron-hole recombination of ZnO.4
Carbonaceous materials are of tremendous interest due to
their unique pore structure, electronic properties, adsorptive capacity and acidity. These materials include activated
carbon, carbon nanotubes and graphene.5 In comparison
to carbon nanotubes (CNTs), graphene has the perfect sp2
hybrid carbon nanostructure and the high specific surface area, which can be easily obtained from natural graphite via a facile chemical oxidation-exfoliation-reduction
procedure at a low cost.6 One of the most well-developed
applications of graphene based materials is the removal of pollutants from water through technologies such as
adsorption and photocatalytic degradation.7 It is expected
that the combination of ZnO with graphene may be ideal to have superior photocatalytic performance because of the conjugated structure of graphene which facilitates
the charge separation in the photocatalysis process.5
Meanwhile, graphene oxide (GO) is receiving increasing attention because it possesses the similar properties to graphene as well as the special surface structures with the introduced hydroxyl and carboxyl groups for the synthesis
of GO-containing nanocomposites.8
wastewater and air, using photocatalytic methods, which imply the importance of the mentioned method
in removing pollutants.8-14 There are various reports15-18
on the application of ZnO and TiO2 nanoparticles as
photocatalysts for the degradation of dyes using response surface methodology. Furthermore, in some of the articles, the photocatalytic degradation of methylene blue (MB) by ZnO/graphene, ZnO nanoparticles NPs/rGO and ZnO/rGO
composites have been investigated.5,19,20
In this work, GO/ZnO nanocomposite was synthesized and photocatalytic process of MB removal from wastewater under UV irradiation by GO/ZnO nanocomposite was investigated. The response surface methodology (RSM) was employed to assess individual and interactive effects of the four main independent parameters (photocatalyst
dosage, initial pH, H2O2 concentration and irradiation
time) on the removal efficiency of MB. Box-Behnken design was used for optimization of photocatalytic process. The nanocomposite was characterized by X-ray diffraction (XRD), Fourier transform infrared (FTIR), scanning electron microscopy (SEM) and transmission electron microscopy (TEM).
Experimental
Materials
All reagents, except multi walled carbon nanotubes, were purchased from Merck Co. (Germany) and used as received. Graphite powder was obtained from the brain of old batteries to recycling of waste.
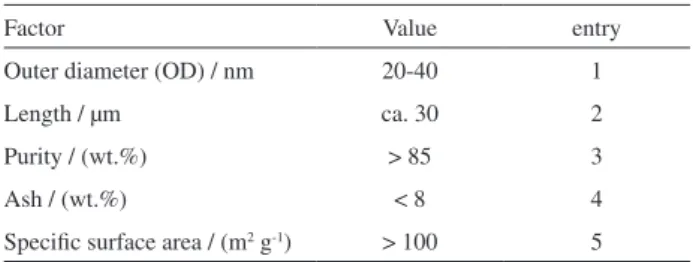
Carbon nanotube (CNT) was obtained from Chengdu Organic Chemicals Co. (China). Table 1 presents the characteristic data of CNT.
Synthesis of GO
GO was synthesized using natural graphite by the
modified Hummers method.21 In a typical synthesis, 2 g
of graphite powder was added into 46 mL of 98% H2SO4
under continuous stirring for 1 h at 0 oC in an ice bath. At
the given intervals, 1 g of NaNO3 and 6 g of KMnO4 were
added slowly to the above solution within 2 h. Afterwards,
the solution was stirred for 2 h at 25 oC before diluting with
280 mL distilled water. Then, 6 mL of hydrogen peroxide
was added to remove KMnO4 excess. The observed color
of the mixture was a dark yellow. The resulting product was filtered, then the mixture was washed with distilled water
until the pH became 7 and dried at 60 oC under vacuum.
The GO was then dispersed in distilled water to make
concentration of 1 g L-1 and exfoliated by ultrasonication
for 3 h to obtain GO nanosheets.
Synthesis of ZnO
In order to synthesis of ZnO nanoparticles, sodium hydroxide solution was added dropwise to the aqueous solution of zinc sulfate in a molar ratio of 1:2 and left stirring for 12 h. ZnO nanoparticles were formed and precipitated at the bottom of the solution. The obtained precipitate was filtered and washed thoroughly with distilled water. The precipitate was dried in an oven at
100 oC.22 The white powder obtained from the above
method was calcined at 300 °C for 2 h.
Synthesis of GO/ZnO
GO was dissolved into ethanol and kept under ultrasonication for 2 h and it was denoted as GO solution. The as-prepared ZnO nanoparticles were dissolved into the mixture of methanol and chloroform and kept under ultrasonication for 2 h and denoted as ZnO solution. Usually the ratio of methanol over chloroform is about 8-9. The volumetric ratio of the two solvents could be adjusted to dissolve all the ZnO nanoparticles to obtain clear solution. The GO solution and the ZnO solution were mixed and kept under constant stirring for 24 h. The collected precipitate was obtained by centrifugation and washed with methanol for several times. The product was freeze dried overnight
and denoted as GO-ZnO nanocomposites.23
Determination of pHPZC of the adsorbents
The point of zero charge (pHPZC values) is the point
at which the net charge on the adsorbent surface is zero.
The pHPZC values of GO and GO/ZnO was determined by
pH drift method.24 Briefly, several solutions containing
0.01 mol L-1 NaCl were supplied. The initial pH (pH
i) of the
solutions was adjusted to a value between 2 and 11 using
0.1 mol L-1 HCl or NaOH. 0.02 g adsorbent was added
to the solution. The electrolyte solution with adsorbent was equilibrated for 24 hours. After equilibrium, the final
pH (pHf) was recorded. The pHf was plotted against the
Table 1. Characteristic properties of CNT
Factor Value entry
Outer diameter (OD) / nm 20-40 1
Length / µm ca. 30 2
Purity / (wt.%) > 85 3
Ash / (wt.%) < 8 4
initial pH (pHi) values. The pH at which pHi crossovered
the (pHf) was referred to as the pHPZC. The pHPZC of GO
and GO/ZnO was determined 7.5 and 8.2, respectively.
Photocatalysis experiments
Photocatalytic activities of the synthesized GO/ZnO nanocomposite were evaluated by the degradation of MB under UV irradiation (by a 15 W UV lamp, Philips, Netherlands). As approved in literature, the initial concentration of dye exhibits an inverse relationship with removal efficiency of dye. So we did not consider it as a factor in our study. Therefore, in all experiment the concentration of dye was considered 10 ppm. In each experiment, the special amount of photocatalyst was poured into 100 mL MB (10 ppm).The suspension was initially stirred in the dark for 30 min to ensure adsorption equilibrium before exposing it to UV irradiation for different times. Then the suspension was exposed to UV illumination. At given times during the process, 3 mL of the solutions were taken and centrifuged to remove the particles. The concentration of the MB solutions was
determined at λ
max = 664 nm by a PG instrument T80+
spectrophotometer. The properties of MB used in this research are presented in Table 2.
Experimental design, statistical analysis and optimization by response surface methodology (RSM)
Response surface methodology (RSM) is a set of mathematical and statistical tools for designing experiments, modeling, evaluating the effects of the factors and researching the optimal values of factors to predict target responses. To reduce the number of experiments, arranging the experiments with various combinations of independent variables and optimization study of the photocatalytic process Box-Behnken design under response surface methodology (RSM) was employed.
The use of Box-Behnken design is popular in industrial research because it is an economical design and requires only three levels (–1, 0, 1) for each factor. This design is useful in avoiding experiments that would be performed under extreme conditions, for which unsatisfactory results
might occur.25 The number of experiments required (N)is
given by:
N = 2k (k − 1) + C0 (1)
where kis the number of variables and C0 is the number of
central points (here is 3).
In this study, four independent variables were
considered: photocatalyst dosage (g L-1) (X
1), pH (X2),
H2O2 concentration (× 10-4 mol L-1) (X3) and irradiation
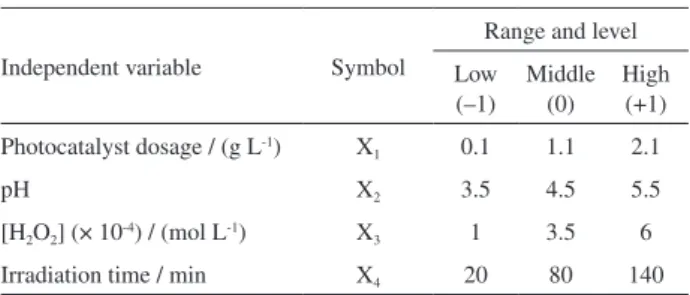
time (min) (X4). Table 3 presents the ranges and levels
of independent variables. The ranges of the independent variables were determined by considering the literature. All experiments for modeling were run based on the experimental design matrix (Table 4).
In the RSM, a second order polynomial equation is usually applied to correlate the dependent and independent variables:
Y = b0 + biXi + biiXi2 + bijXiXj + ε (2)
where Yi is the response, b0 is the constant, bi is the slope or
linear effect of the input factor, bii is the quadratic effect, bij
is the two-way linear by linear interaction effect, Xi and Xj
are the independent parameters and ε is the random error.
Equation 2 expresses the relationship between the predicted
response and the independent variables in coded values.25
Results and Discussion
Characterization
Figure 1 shows the FTIR spectra of the GO, ZnO and GO/ZnO nanocomposites. In the FTIR spectrum of
the GO sample, the main absorption band at 3430 cm-1
is assigned to the O–H group stretching vibrations. The
Table 2. Characteristics of methylene blue (MB) dye
Chemical structure
Type of dye cationic
Symbol MB
Molecular formula C16H18N3SCI
Molecular weight / (g mol-1) 319.85
Maximum absorption
wavelength / nm 664
Table 3. Independent variables and their coded levels and actual values
Independent variable Symbol
Range and level
Low (–1)
Middle (0)
High (+1)
Photocatalyst dosage / (g L-1) X
1 0.1 1.1 2.1
pH X2 3.5 4.5 5.5
[H2O2] (× 10-4) / (mol L-1) X3 1 3.5 6
absorption peak at 1627 cm-1 can be assigned to C=O
stretching of carboxylic and/or carbonyl moiety functional
groups. The peaks at 1054.10 and 918.51 cm-1 are assigned
to the stretching of C–OH and C–O, respectively. The
peaks around 2924.24 and 2855.15 cm-1 can be assigned
to the asymmetric and symmetric vibrations of C–H,
respectively. The broad peak at 3420.24 cm-1 in the
FTIR spectrum of the GO/ZnO nanocomposite might be attributed to the O–H stretching vibration of the C–OH groups and water. In addition, the strong absorption
band in the range of < 500 cm-1 is corresponding to the
vibrations of Zn–O bonds.
The XRD patterns of ZnO nanoparticles and GO/ZnO nanocomposite are shown in Figures 2a and 2b, respectively.
In the XRD pattern of the ZnO nanoparticles (Figure 2a), the peaks at 32, 34,6, 36.4, 47.8, 56.8, 63, 68.3, 69.53 and 77.5 correspond to (110), (002), (101), (102), (110), (103), (112), (201) and (202) crystalline planes of ZnO,
respectively.5,8,20 The main peaks of the XRD pattern of
GO/ZnO nanocomposite are shown in Figure 2b. The diffraction peaks of GO/ZnO nanocomposite are similar to those of ZnO nanoparticles and the main peaks of ZnO are observed in the XRD pattern of the nanocomposite.
The peak around 2θ = 10-15° is assigned to graphene oxide
nanosheet. The GO peak in the nanocomposite suggests that the nanocomposite sheets restacked.
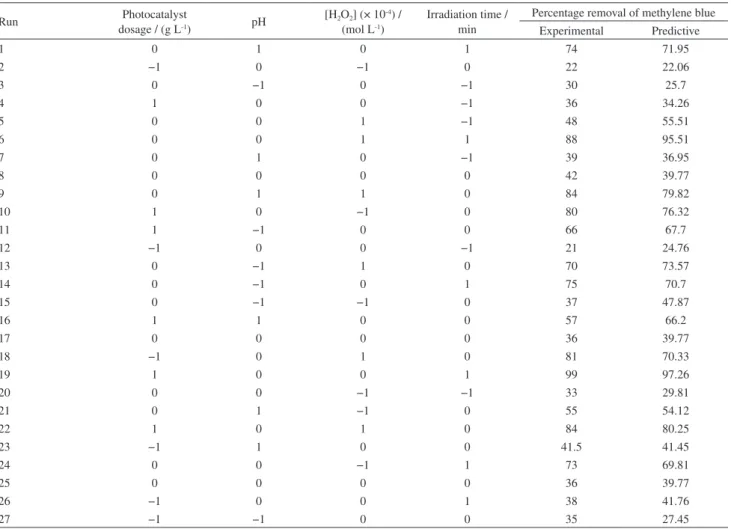
Table 4. Box-Behnken design with predictive values and their experimental results
Run Photocatalyst
dosage / (g L-1) pH
[H2O2] (× 10-4) /
(mol L-1)
Irradiation time / min
Percentage removal of methylene blue Experimental Predictive
1 0 1 0 1 74 71.95
2 −1 0 −1 0 22 22.06
3 0 −1 0 −1 30 25.7
4 1 0 0 −1 36 34.26
5 0 0 1 −1 48 55.51
6 0 0 1 1 88 95.51
7 0 1 0 −1 39 36.95
8 0 0 0 0 42 39.77
9 0 1 1 0 84 79.82
10 1 0 −1 0 80 76.32
11 1 −1 0 0 66 67.7
12 −1 0 0 −1 21 24.76
13 0 −1 1 0 70 73.57
14 0 −1 0 1 75 70.7
15 0 −1 −1 0 37 47.87
16 1 1 0 0 57 66.2
17 0 0 0 0 36 39.77
18 −1 0 1 0 81 70.33
19 1 0 0 1 99 97.26
20 0 0 −1 −1 33 29.81
21 0 1 −1 0 55 54.12
22 1 0 1 0 84 80.25
23 −1 1 0 0 41.5 41.45
24 0 0 −1 1 73 69.81
25 0 0 0 0 36 39.77
26 −1 0 0 1 38 41.76
27 −1 −1 0 0 35 27.45
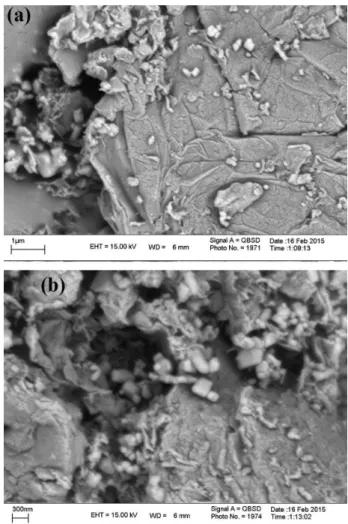
To investigate the surface morphology and particle size of GO/ZnO composite, SEM images were taken and presented in Figure 3. Figure 3a shows the particles of ZnO have been dispersed on graphene oxide sheets. It is observed that some ZnO particles have been agglomerated. Figure 3b shows the particle size of ZnO dispersed on graphene sheet. The diameter of ZnO particles is less than 100 nm and the diameter of the two particles are determined 82.04 and 98.21 nm.
The representative TEM images of GO and GO/ZnO composite are shown in Figures 4a and 4b, respectively. A large graphene oxide sheet with dimension of nanometers has been found to be situated on the top of the grid (Figure 4a), where it shows transparent and rippled silk wave appearances. The wrinkles and folded parts are attributed to graphene oxide. In the case of the TEM image of GO/ZnO (Figure 4b), the small spots dispersed on the graphene oxide flake is attributed to the ZnO nanoparticles. So, both images approve the nanosheet of GO and nanoparticles on ZnO in the composite.
From the different models evaluated, the following quadratic response surface model (equation 3) could best fit the experimental results among different evaluated models:
Y = 44.12 + 16.10X1 + 3.12X2 + 12.79X3 + 20X4 +
3.19X12 + 4.77X22 + 16.01X32 – 3.87X1X2 – 11.34X1X3 +
11.50X1X4 (3)
The sign of independent factors is positive in the model, indicating that all the independent factors have a synergistic effect on the response.
Photocatalytic efficiencies of MB removal (Y) have been predicted by equation 3 and presented in Table 4. These results indicated good agreements between the experimental and predicted values of decolorization efficiency.
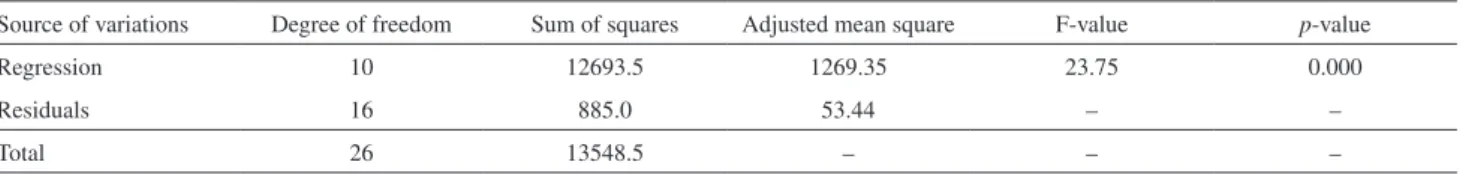
The suitability of a model is evaluated by analysis of variance (ANOVA). The results of ANOVA for the model is presented in Table 5.
The significance of the model was evaluated by the
determination coefficient (R2). Figure 5 shows the plot
of the model predicted responses versus response. It is
observed that the R2 value means an acceptable agreement
between the experimental and predicted values of the fitted
data (R2 = 0.95). The closer the R2 (value = 1), the stronger
Figure 2. XRD plot for (a) ZnO and (b) GO/ZnO nanocomposite.
the model is and the better it predicts the response.26
Adjusted R2 (R2
adj) is also a measure of the goodness of a fit,
but it is more suitable for comparing models with different
numbers of independent variables.27 The adjusted R2 was
0.91 for the model. The difference of R2
adj and R2pred value
was less than 0.2 (20%), indicating the significance of the model. In addition, the Fisher’s F-test was used to verify the statistical significance of the model.
The greater the F-value is from unity, the more certain it is that the factors explain adequately the variation in the data about its mean, and the estimated factor effects are
real. The probability p-value is relatively low, indicating
the significance of the model.26 In this study, a very high
F-value (Fmodel = 23.75, much greater than unity) and a
very low probability value (pmodel = 0.000) confirms highly
significant of the model (see Table 5).
On the other hand, the significance of the regression
coefficient of the model terms was investigated by p-value
and t-value.
The p-values were used as a tool to check the significance
of each of the coefficients, which in turn, are necessary to understand the pattern of the mutual interactions between
the test variables.28 The larger the magnitude of the t-value
and the smaller the p-value, the more significant the
corresponding coefficient.15 The p-value and t-value of the
each coefficient are presented in Table 6.
The coefficients of the linear effect of catalyst dosage,
H2O2 concentration and irradiation time with p-value of
zero were significant, whereas the coefficient of pH is
not at a confidence level of 95% (p-value ≤ 0.05). In the
case of quadratic effects of (Xi2), just the coefficient of
CH2O2-CH2O2 (X32) was significant at the confidence level
of 95% and the term X42 was removed from the model.
In the case of binary terms, the interactions of X1X3
and X1X4 were significant at a confidence level of 95%
(p-value ≤ 0.05).
The Pareto analysis gives more significant information to interpret the results. In fact, this analysis calculates the percentage effect (relative importance) of each factor on
the response, according to the following relation:16
(i ≠ 0) (4)
Pareto analysis graphic analyses are summarized in Figure 6. As can be seen in this figure, the order of relative
Figure 4. TEM images of (a) GO and (b) GO/ZnO nanocomposite.
Figure 5. Comparison of predicted response of degradation with experimental response.
Table 5. Analysis of variance (ANOVA) for decolorization of MB by the photocatalytic process
Source of variations Degree of freedom Sum of squares Adjusted mean square F-value p-value
Regression 10 12693.5 1269.35 23.75 0.000
Residuals 16 885.0 53.44 – –
importance of variables in photocatalytic decolorization
efficiency is as follows: irradiation time (X4) > photocatalyst
dosage (X1) > H2O2 concentration (X3) > pH (X4).
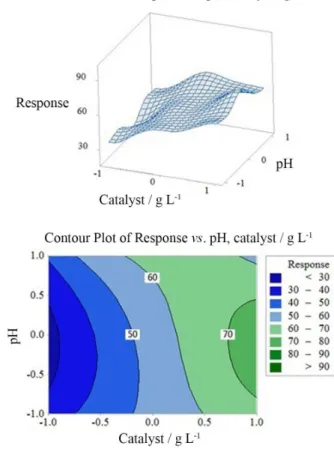
In order to achieve better understanding of the interactions between factors and to determine the optimum level of each factor for maximum response 3D surface plot and 2D contour plots were used. Figures 7a and 7b shows the surface plot and contour plot for combined interaction of catalyst dosage and pH, respectively.
From these figures, it was found that pH has negative
effects when being coupled with adsorbent dosage (X1).
This was evidenced from the positive terms in equation 3 and also the convex response surfaces that indicate well-defined optimum variables. Maximum response results
in high level of X1 and medium level of X2 (pH = 4.5).
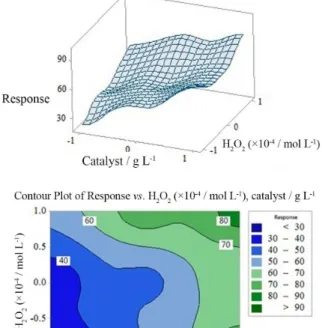
The interaction of catalyst dosage (X1) and X3
(H2O2 concentration) on the response has been investigated
by surface plot and contour plot as shown in Figure 8. It is observed that the increasing of catalyst dosage and
H2O2 concentration increased the response of the model
and maximum MB removal occurs at both high levels of both factors.
Regarding the effect of irradiation time and catalyst dosage on the removal of MB efficiency, as can be seen in Figure 9, the removal of MB efficiency increases by the increasing of the irradiation time and catalyst dosage, respectively.
Furthermore, the developed model predicted the optimum conditions to get high efficiency for decolorization. The conditions are presented in Table 7. For these conditions, the model predicted the efficiency of 97.3%, whereas the experimental test in optimum conditions resulted 99% removal of MB, implying that this model is useful to optimize the decolorization conditions and to obtain the best conditions by the modeled formula. In addition to GO/ZnO nanocomposite, the photocatalytic performance of ZnO, GO, CNT and CNT/ZnO were tested and the results of MB degradation on these materials are presented in Table 8. It is resulted that other photocatalysts show high activity under optimum catalyst. GO exhibits photocatalytic activity, but carbon nanotube is not a photocatalyst. It is resulted that the most portion of photocatalytic behavior is due to ZnO.
Table 6. Estimated regression coefficients and corresponding t- and p-values from the data of Box-Behnken design experiments
Coefficient Standard error t-value p-value
b0 372 7.97 0
b1 293 3.02 0.008
b2 27 1.55 0.141
b3 54.2 5.19 0
b4 272 7.19 0
b11 3.17 1.01 0.329
b22 2.96 1.61 0.126
b33 19.5 5.12 0
b12 3.65 –1.06 0.305
b13 11.4 –2.48 0.025
b14 219 3.15 0.006
Figure 6. Pareto graphical analysis.
Figure 9. The surface plots and contour plots of the decolorization efficiency (CR%) as the function of catalyst dosage and irradiation time.
Figure 8. The surface plots and contour plots of the decolorization efficiency (CR%) as the function of catalyst dosage and H2O2
concentration.
Table 8. The removal percent of MB over different photocatalysts under optimum conditions
Photocatalyst Methylene blue degradation / %
GO/ZnO nanocomposite 99
ZnO 98.85
GO 56.25
CNT 0
CNT/ZnO 98
GO: grapheme oxide; CNT: carbon nanotubes.
Table 7. Optimum values of the parameters for 99% decolorization efficiency by the process
Parameter Optimum value
Photocatalyst dosage (X1) / (g L-1) 2.1
Initial pH (X2) 4.5
[H2O2] (× 10-4) / (mol L-1) 3.5
Irradiation time (X4) / min 140
Conclusions
The GO/ZnO was successfully synthesized and its performance for photocatalytic degradation of methylene blue was evaluated. A second order model was successfully developed for the photocatalytic process where predicted the process by BBD of the RSM. Analysis of variance
showed a high coefficient of determination (R2 = 0.95),
thus ensuring a satisfactory adjustment of the second-order regression model with the experimental data. The optimum condition for the removal of methylene blue was resulted
at a photocatalyst dosage of 2.1 g L-1, initial pH of 4.5, the
H2O2 concentration of 3.5 × 10⁻⁴ mol L-1 and irradiation time
of 140 min. Irradiation time and photocatalyst dosage were determined as the most effective factors based on the Pareto analysis, respectively. Under optimum conditions, the other photocatalyst such as ZnO and CNT/ZnO exhibited higher activity in MB decolorization. The study revealed that ZnO/ GO could be a promising photocatalyst for decolorization processes.
Acknowledgments
Special thanks to Iranian Nanotechnology Initiative Council for financial supports. The authors wish to thank Prof Ahmad Reza Abbasian, for TEM analysis.
References
2. Jantawasu, P.; Sreethawong, T.; Chavadej, S.; Chem. Eng. J.
2009, 155,223.
3. Liu, Y.; Hu, Y.; Zhou, M.; Qian, H.; Hu, X.; Appl. Catal., B
2012, 125,425.
4. Chen, D.; Wang, D.; Ge, Q.; Ping, G.; Fan, M.; Qin, L.; Bai, L.; Lv, C.; Shu, K.; Thin Solid Films2015, 574,1.
5. Ahmad, M.; Ahmed, E.; Hong, Z. L.; Xu, J. F.; Khalid, N. R.; Elhissi, A.; Ahmed, W.; Appl. Surf. Sci.2013, 274,273. 6. Aia, L.; Zhang, C.; Chena, Z.; J. Hazard. Mater.2011, 192,
1515.
7. Bai, S.; Shen, X.; Zhong, X.; Liu, Y.; Zhu, G.; Xu, X.; Chen, K.; Carbon2012, 50,2337.
8. Li, B.; Liu, T.; Wang, Y.; Wang, Z.; J. Colloid Interface Sci.
2012,377,114.
9. Abdullah, A. H.; Jia, H.; Moey, M.; Yusof, N. A.; J. Environ. Sci.2012,24,1694.
10. Hayat, K.; Gondal, M. A.; Khaled, M. M.; Ahmed, S.; Shemsi, A. M.; Appl. Catal., A2011, 393,122.
11. Rodriguez, L. P.; Cuevas, S. M.; Oller, I.; Agüera, A.; Puma, G. L.; Malato, S.; J. Hazard. Mater.2012, 211-212,131. 12. Baransi, K.; Dubowski, Y.; Sabbah, I.; Water Res.2012, 46,
789.
13. Vildozo, D.; Ferronato, C.; Sleiman, M.; Chovelon, J. M.; Appl. Catal., B2010, 94,303.
14. Zhang, W.; Zhang, Q.; Dong, F.; Ind. Eng. Chem. Res.2013, 52,6740.
15. Asl, S. K.; Sadrnezhaad, S. K.; Rad, M. K.; Uner, D.; Turk. J. Chem.2012, 36,121.
16. Khataee, A. R.; Fathinia, M.; Aber, S.; Zarei, M.; J. Hazard. Mater.2010, 181, 886.
17. Ray, S.; Lalman, J. A.; Biswas, N.; Chem. Eng. J.2009, 150, 15.
18. Tzikalos, N.; Belessi, V.; Lambropoulou, D.; Environ. Sci. Pollut. Res.2013, 20,2305.
19. Azarang, M.; Shuhaimi, A.; Yousefi, R.; Golsheikh, A. M.; Sookhakian, M.; Ceram. Int.2014, 40,10217.
20. Lv, T.; Pan, L.; Liu, X.; Lu, T.; Zhu, G.; Sun, Z.; J. Alloys Compd.
2011, 509, 10086.
21. Hummers, W. S.; Offeman, R. E.;J. Am. Chem. Soc.1958,80, 1339.
22. Kumar, S. S.; Venkateswarlu, P.; Rao, V. R.; Rao, G. N.; Int. Nano Lett.2013, 3,30.
23. Wang, Y.; Liu, J.; Liu, L.; Sun, D. D.; J. Nanosci. Nanotechnol.
2012, 12,3896.
24. Rahman, M. M.; Adil, M.; Yusof, A. M.; Kamaruzzaman, Y. B.; Ansary, R. H.; Materials 2014, 7, 3634.
25. Cobas, M.; Sanromán, M. A.; Pazos, M.; Bioresour. Technol.
2014, 160,166.
26. Liu, H. L.; Chiou, Y. R.; Chem. Eng. J.2005, 112, 173. 27. Khataee, A. R.; Zarei, M.; Desalination2011, 278, 117. 28. Khataee, A. R.; Zarei, M.; Fathinia, M.; Jafari, M. K.;
Desalination2011, 268,126.
Submitted: March 17, 2016