POLITICAL FACTORS AND THE EFFICIENCY OF
MUNICIPAL EXPENDITURE IN BRAZIL
Ronaldo Seroa da Motta*
Ajax Moreira
Resumo
Este estudo analisa como fatores políticos e institucionais afetam a efi-ciência do gasto municipal no provimento do bem estar para a população ao longo da década dos noventa. O modelo adota a abordagem da fron-teira de produção estocástica, condicionada por variáveis relacionadas ao custo da provisão dos serviços e os incentivos que afetam a eficiência mu-nicipal. O resultado indica que não podemos rejeitar: 1) economias de escala; 2) o efeito da margem de voto no município e do tipo de mandato (primeiro ou segundo) do governador eleito, indicando uma forma de cli-entelismo; e que 3) a política local e a existência de comitê setoriais não afetam o nível da eficiência do gasto, o que sugere assimetria de informa-ção entre os políticos e os eleitores.
Keywords:economia política, eficiencia serviço publico, fronteira estocás-tica, econometria espacial
Abstract
This study analyses how political and institutional factors affected the
performance of municipalities in improving social welfare in Brazil in the period from 1990 to 2000. The model adopts a stochastic production fron-tier, conditioned by variables related to the provision costs of services and those that can affect municipal efficiency. The results indicated that we
can not reject:1) economies of scale; 2) the effect of vote margin in the
municipality and the type (first or second) of mandate of elected gover-nor, which indicates a form of patronage; and 3) that local politics and the existence of sectorial boards did not affect the level of efficiency for
municipal spending, suggesting an asymmetry of information between politics and voters.
Keywords:political economy, public service eficiency, stochastic frontier
JEL classification:D72, H11, H83
*At the Research Institute of Applied Economics (IPEA). Address: Av. Pres. Antonio Cra-los 51, 17 anadra, Rio de Janeiro, 20020-010, RJ, Brazil. Email: [email protected] and [email protected]
1
Introduction
A social planner should use municipal funds to maximize the quality of life of local residents. In other words, local tax revenues and transfers from the state and federal level should finance the responsibilities of the municipality1 to supply basic education, health care and other public services. Elected lead-ers, though, often have other objectives besides benefiting their constituen-cies. Municipal management can be affected by local conditions and by the
electoral dispute for local offices or the local votes for state and federal
of-fices. Our objective is to investigate whether the electoral dispute and insti-tutional characteristics affect the provision of municipal services. This
moti-vates efforts to estimate the efficiency of municipal management in
transform-ing public funds into services for the population, and explains the sources of this difference.
In this article we propose a measure for the spending inefficiency of
Brazil-ian municipalities during the 1990s and relate this measure to institutional characteristics and electoral dispute, which can alter the conditions and in-centives for the supply of public services. To do this we use the stochastic production frontier model, which distinguishes inefficiency and its
determi-nants, and an approach to mitigate the bias due to unobservable factors. It should be clear that in this approach the inefficiency measure is constructed
by comparisons among municipalities. Therefore, this is only a relative mea-sure of inefficiency. The non-experimental nature of the data utilized and
the possibility that the institutional characteristics and the electoral dispute are determined together with social conditions and public spending limit the scope of our results2.
There is an extensive body of literature examining the effect of political
and institutional conditions on public expenditure. The initial normative eco-nomic literature on public spending, as inAtkinson & Stiglitz(1980), summa-rized the social planner’s problem into the allocation of resources that max-imize social welfare and affect the distributive impact.3 Later, median voter
models were developed, in which expenditures are electorally decided and decline with the tax contribution of the median voter in total spending. These models resulted in an extensive body of empirical literature, as summarized inCutler et al.(1993). In contrast, models that describe strategies to capture spending by interest groups, as summarized in Peltzam (1993), focus on per-ceived benefits.4 In countries where the median voter receives less income than the median voter, spending would be higher and more aimed at social problems (Meltzer & Richard 1981). This, however, does not ensure that pub-lic spending will be more efficiently utilized and result in reduced inequality,
1In Brazil, the local administrative unit is the municipality, which is roughly the same as a
county, except that it has a single administration, under a mayor and municipal council. Urban municipalities correspond basically to single cities, while rural ones can take in several small towns or villages. The Constitution provides a mechanism for parts of municipalities to split off
and form separate units.
2With non experimental data it is hard to select valid instruments that permit identifying
causality relations.
3. In the first case, we consider the unweighted sum of the utilities, and in the second,
dis-tributive weights can be used.
4Strömberg (2006) develops a median voter model with focus on the benefits of interest
since imperfections in the political market affect this process of transforming
voter preferences into results.
The literature on the provision of public services uses the theory of in-dustrial organization when the monopoly power that governments have on public spending is politically contested, and thus examines the entry and exit barriers that determine the quality and quantity of services and the extrac-tion of rent. Examples of this approach areLake & Baum(2001) andKeefer & Khemani(2005). The political market is open to competition in democracies, since in this case there is no regulatory barrier to entry. However, the exis-tence of sunk costs (campaign and reputation-building costs) creates barriers that reduce competition. Similarly, the distribution of the costs of voter par-ticipation is crucial for core or swing voters to exercise their influence. With a small percentage of voters at low cost, the monopolist rent of the state tends to be captured by these voters.
More recently, the principal-agent model has been considered to explain how competitive the political market is in converting voter preferences into results of public expenditures (for example,Dixit(1996),Dixit(2002);Burgess & Metcalfe (1999)). Voters’ difficulty in observing politicians’ performance
generates information asymmetry for voters that reduces political competi-tion, and therefore also reduces the incentives politicians have to offer
non-excluding public services.
The asymmetry between politicians and voters is explained as the result of the difficulty of measuring performance - sometimes with multiple
dimen-sions, sometimes with indistinct dimendimen-sions,- and inefficiencies in the
pub-lic service productive chain. Although the voter is the principal, additional agency costs can occur. With the presence of multiple principals between the political decision and the enactment of the service, for example, distinct ob-jectives among the spending overseer, doctor and patient of the public health service may exist. Since each principal wants to induce greater effort from
the agent, the incentives to efficiency that the agents perceive end up being
low and distorting.5 In the literature, incentives have been proposed so that agents’ efforts maximize the combined payoffof the multiple principals, and
thus avoid inefficiencies above the normal agency costs (seeBesley & Ghatak
(2003))6, which vary from payment for performance (merit or product) to the freedom of choice of users and to transparency instruments.
This literature lists factors that condition the allocation and efficiency of
spending, from the viewpoint of the median voter. In this study, we use those variables to evaluate the varying level of inefficiency of Brazilian
municipal-ities in using the technology of converting public resources into services and seek to explain this heterogeneity.
Empirical literature exists measuring the efficiency of public expenditures
in relation to various social and institutional indicators. For example,Afonso et al.(2005) andAfonso & Aubyn(2005) use nonparametric models and an-alyze the resulting ranking econometrically regarding income, institutional factors (government transparency, property rights regime and quality of the bureaucracy), trust in politicians and trade openness. They find evidence that only income and institutional variables are significant. Estache et al.(2007),
5There are externalities, then, that increase the agency cost.
6Which range from payment for performance (merit or output) to transparency instruments
using parametric models, also make international comparisons of sectorial spending on energy, transportation and education, models that include qual-ity of bureaucracy and level of corruption as variables. The results by income class indicate that average efficiency diminishes with income and that
institu-tional variables are not significant. Needless to say, such results must be taken with caution due to the well-known econometric problems of cross-country comparisons regarding fixed effects on parameter estimation.
Following a political economy approach,Alston et al.(2007) analyzes the performance of state governments in Brazil, using public expenditures, wealth of politicians and campaign spending as performance measures regressed against political and social control variables. The results of specifications with the interaction among the variables indicate that in nearly all cases political competition and social control are substitutes.
Our study will compare the efficiency of conversion of public expenditures
into public services among municipalities and investigate the determinants of these efficiency levels, by examining municipalities that have the same general
institutional environment. In doing so, we consider direct measures of the quality of life of the population to evaluate government output and propose an approach to mitigate the effect of unobserved variables for non-panel data.
Section2discusses the adopted methodology, Section3describes the indi-cators and Section4presents the empirical results. The conclusion is the last section.
2
Methodologies
The transformation of spending into the public services that condition the state of public education and health, henceforth, just “state” is a complex and lengthy process that depends on the initial state, the volume of expenditures and the efficiency with which these are made. This efficiency of spending, in
turn, depends on the relation between the benefit and cost of the effort to
in-crease administrative effectiveness. Hence, the heterogeneity of this eff
ective-ness among municipal governments can be explained both by the incentives that public administrators perceive to try to be more efficient and by local
supply conditions, which alter the marginal cost of this effort. The
availabil-ity of data delimits the interpretation of the results. We measure the social conditions at the start and end of the decade, and consider the real per capita expenditures made during the decade. Therefore, the inefficiency measure
refers to a municipal characteristic that is in some form shared by all three municipal governments in this period7. This approach has the advantage of considering the ultimate purpose of public spending, and the disadvantage of indirectly measuring the performance of government management. This mu-nicipal characteristic can perhaps be rationalized by arguing that the public bureaucracy is fairly stable, as are the population/voters.
The state of the population is the result of multiple actions of the munic-ipal government, some of which can affect the result although not directly
related to the provision of services. We assess the combined performance of the administration of each municipality (combined in the sense that we are
7Municipal elections (for mayor and city council) are held every four years, offset with
considering the activities and also all the governments in the 1990s). Since the allocation of resources among functions is an endogenous process, we specified the production function as having multiple interdependent outputs generated by a single input, represented by total budget spending. With this specification it is useful to define the model as a production possibility fron-tier that determines per capita spending (g), given the measure of the stateS
and given a level of municipal inefficiency (u), in the formg,S,x,z,u.8
This relation is conditioned by 2 types of variables: 1) related to the cost of supplying services and that are not under control of the mayor (x); and 2) that affect efficiency (z).
2.1 Model
The factors affecting the cost of service considered are the population’s
demo-graphic conditions, the municipality’s degree of fragmentation and favouritism in receiving transfers from the state9. Favouritism of state governments can provide additional funds not observed in the public accounts (in a form of patronage) and reduce the mayor’s cost of attaining the same level of service to the people. The demographic conditions, concentration of population in the urban area, its age profile and the size of municipalities alter the supply cost, due to the scale returns, access cost and type of service demanded.
The incentive to efficient municipal administration depends on the degree
of political competition, the population’s interest in participating in decisions and the mayor’s profile. In municipalities with greater political competition for mayor or councilors, the mayor’s effort,coeteris paribus, tends to be greater
and might explain a greater level of efficiency. When a greater portion of
revenues come from transfers, on the other hand, there can be an incentive to moral hazard by leaders, and hence inefficiency.
A better-informed electorate can heighten demand for efficient
govern-ment. The characteristics of municipal administration that affect the cost of
providing services can, however, give more or less transparency to perfor-mance when there are sectorial advisory boards – education and health – or outsourced government services and computerized processes. We consider as factors that condition efficiency those that directly affect the electoral
perfor-mance of the mayor or depend on his or her direct action.
However, public services have a cost to maintain the level of the social indicators (S) and an additional cost to promote their improvement (see the list of S in the appendix). With the available information it was not possi-ble to identify these two processes. This suggests that the specification of the technology is ambiguous. If the most important element is to maintain a particular service, the most suitable specification is the state measured by the average value (S1 +S0); if the most important element is to promote im-provement, the best specification is the variation (S1−S0); and if the two are equally important, the unrestricted specification is most suitable (S1,S0).
The result of supplying municipal services, measured by social indicators, depends on implementing permanent policies that have long maturation hori-zons. In line with this, we considered average budget spending per inhabitant
8Or efficiency if signal is changed.
9For the sake of simplicity, we consider only the effect of the competition by the state
during the analyzed period and the population state at its start and end, ob-tained from the 1991 and 2000 Demographic Censuses.
As mentioned before, the proposed model assumes that the municipal ad-ministration “produces” the population’s stateS, making a per capita expen-diture g (measured in logarithms), with the cost-conditioning factors mea-sured byx, and the efficiency incentives measured byz. We assume it is
im-possible to identify the relation between spending on the various municipal service provision units and their results, so that it is only possible to mea-sure the relation between the production possibility surface,Sβ, and the log of total per capita spending,g.
This Sβ−g relation is then explained by two groups of observed condi-tional variables: 1) the cost of supply (x); and 2) the efficiency (z) of
manage-ment; and two stochastic terms: 1) the distance from the production frontier (u), which is identified with the asymmetric form of its distribution; and 2) a random term. The asymmetry is induced by the existence of a frontier that increases the chance that the agents are near it. Naturally, it is an empiri-cal question to verify whether the unobserved component is asymmetric, and thus whether this model can be estimated with the data sample under study. This model is known in the literature as the stochastic frontier production model (seeCoelli(1996)).
The determinants of management efficiency (z) can be incorporated into
the model according to two descriptions for the form of inserting thex vari-ables in the model, described with the models indicated below. Model (a) assumesxandzare correlated and the frontier is homogeneous. For model (b)zis independent and the frontier is heterogeneous, varying with (δz). The equations below describe these cases.
Homogeneous:
g=Sβ−xγ+δz−u+e, e∼N(0, σ2), u∼E(δ0) (1)
Heterogeneous:
g=Sβ−xγ−u+e, e∼N(0, σ2), u∼E(δz) (2)
2.2 Mitigating the bias of unobservable factors
The bias due to unobservable or omitted variables is a critical question in identifying a variable’s effect in empirical tests. It may be that relevant
un-observable quantities are related to the variables of interest, leading to undue attribution of explanatory power and mistaken conclusions. This question is hard to resolve, precisely because it involves unobservable factors. The usual approach in the literature to mitigate this bias is to use a fixed-effects model,
which can be estimated when panel data is available. The characteristics of the problem addressed here - long maturation of social processes and the dis-crepancy between the dates of elections and of census data collection10– only permit one observation per municipality at this moment, making the usual approach impossible. Instead of the fixed-effects model, which eliminates the
bias of omitted variables that are stable in time, we propose this approach that eliminates the bias of omitted variables that are stable in space.
10The spending data are annual, but the social indicators are only available for the census
In the modely|x, when there is a unobserved variablezcorrelated withx, andydepends onxandz, the effect ofzis attributed tox. This is a difficult
question that is mitigated by formulating hypotheses about the characteristics of the omitted variables. A usual approach with panel data is to suppose thatz is constant for each (m) or has a temporal trend or is steady such that (∆z
m= 0) or (∆Zm=uzm), in which case the model estimated with fixed effect
in the spatial dimension (m) eliminates the effect ofzwhenuzis independent
of y. Variables of this type generally vary smoothly in time, for example, geographic and climatale or some economic and social conditions.
In this work the social conditions are only observed in 1991 and 2000 and are correlated with the flow of annual expenditures, which makes a temporal identification with ∆z
m impossible. In this case, the effect of the variable z
can be eliminated whenzhas a spatial trend. The spatial trend is the smooth variation of a quantity over space, either because the physical medium does not jump or because economic and social processes propagate to neighbouring regions. Below we present the rationale behind these two approaches.
y=βx+γz+e. (3)
Temporal Hypothesis: ifzdoes not depends on time (∆z= 0) or has a temporal
trend (∆z=z−z−1=uz,uz∼N(0, σ2),uz⊥y), then the operator∆eliminates
the effect ofz.
∆y=β∆x+γ∆z+∆e=β∆x+e∗ (4)
Spatial Hypothesis: ifzhas a spatial trend (∆wz=z−W z=uw,uw∼N(0, σ2),
uw⊥y), then the operator (∆w) eliminates the effect ofz. WhereWis a
neigh-bourhood matrix11andW zis the local mean ofz
∆wy=β∆wx+γ∆wz+∆we=β∆wx+e∗ (5)
The two constructions have advantages and limitations; in both cases the hypothesis of independence cannot be tested sincez is not observed, but in the case of the temporal difference, the robustness of this hypothesis can be
evaluated when one has samples with more than two observations in time. In contrast, the spatial difference assumes spatial trends capture the selection
bias of non-observables, a hypothesis that tends to be more realistic when the units are smaller and more mutually homogenous.
In the two cases, the model with the transformed variable generates the unobserved terms of the stochastic frontier model, distance from the frontier and random term (u,e) also transformed. Thus, the asymmetric term of the model with the transformed variables is the deviation of the distance from the frontier. In the case of the temporal difference, if inefficiency is an
id-iosyncratic property of the unit, the transformed model eliminates this effect,
which means that in this case the error loses the asymmetry property. In con-trast, in the case of spatial difference, if the inefficiency is idiosyncratic and
thus does not present a spatial trend, the asymmetric term is preserved. In this case, the asymmetric term measures the deviation of the distance in re-lation to the mean distance of the neighbours and it becomes an empirical question to verify whether the asymmetry property is preserved.
3
ELectoral and institutional indicators
The direct investments and expenditures of the state and federal governments benefit the people of the municipalities. These outlays, made according to the interest of the governor, benefit different municipalities differently,
improv-ing the population’s state. These outlays are not computed in the municipal budget, and for this reason they can be seen as reducing – for the municipality – the production cost. The interest is represented by the electoral performance in the municipality by the then- candidates for governor, - state government – whose performance is measured by the margin of victory over the runner-up candidate12. This type of spending (a form of patronage) directly by the state government, is not discriminated spatially by municipality in the state budget, which impedes its direct measurement13.
The elected executive or administration that wishes to run for re-election has different incentives for patronage measures than one with no possibility
of another mandate. A dummy variable identified the governor re-elected in the 1998 election.
The inhabitants of municipalities have the option of redefining their polit-ical map by breaking away from the existing one and forming a new munici-pality. This was a particularly intense process in the 1990s. Constitutionally mandated transfers are approximately defined per inhabitant, so the fragmen-tation of a municipality does not change the joint revenue of the old and new units – transfers and the local tax base remain the same14– nor does the pop-ulation served differ. Nevertheless, the fixed costs of the local executive and
legislative apparatus increase with the multiplication of municipalities. Thus, the number of them contained within a comparable minimum area can be used as an indication of these costs. Although this fragmentation into smaller units can put government in closer touch with citizens, its overall effect is an
empirical question.
An important part of local budgets comes from constitutional transfers from the state and federal governments. The transfer between governments makes the relation between the public that pays taxes and that part of the pub-lic which receives the corresponding benefits more indirect, which in princi-ple generates less social control over the manager.
The incentive for the mayor to manage local affairs better depends on the
degree of institutional and social control, other institutional questions and the electoral benefit of the mayor. Institutional control can be related to the mayor’s political party and can be exercised through sectorial munici-pal boards. These incentives were considered through five types of variables: the existence of sector boards; modernization of the public administration; a dummy for reelection of the mayor; degree of competition for mayor mandate; and the political party of the elected mayor.
12normalized by the number of inhabitants
13This kind of relation exists for federal level too. Due to the Real Plan, votes for state and
federal level were aligned, and the correlations between margins of governor and president for the 1994 and 1998 elections (88%, 75%) make it difficult to identify separate effects. Therefore,
we consider only governor’s race margins and interpret the results as the effect of governor and
president.
14The taxing powers of levels of government are constitutionally defined in Brazil. Municipal
The existence of sectorial boards drawn from the target public makes man-agement more transparent and participative and is an indicator of its quality. The modernization of public administration is related to two important trans-forming mechanisms: outsourcing and the computerization of services. Both are associated with the contracting of private services, seeking greater effi
-ciency. These are complex processes, which we measured in simplified form through the number of functions in a municipality subject to each of these mechanisms.
In a system with perfect information, the re-election of the mayor is recog-nition of his or her good administration, and thus should be related to his or her efficiency. In the Brazilian electoral system, and given the average level
of voters’ education, this does not necessarily occur. Re-election of a mayor in 1996, for which we have data, refers to a term that started in 1992, and the second term ends in 2000. This covers most of our study period. We ex-pect that municipalities where the mayor was re-elected were more efficient.
The re-election for mayor mandate was only possible after 1994, therefore re-election for mayor was possible only for the 1996 election.
The intensity of the political dispute is an element that shapes the admin-istration of public affairs and can act as an incentive to better management
or to patronage, in both cases a determinant of the efficiency with which
ser-vices are provided. This intensity is represented by a vote concentration in-dex, considering the 16 parties receiving the most votes, in national terms, and measured by the sum of the squares of the party shares in the municipal elections (Herfindahl-Hirschman Index).
The electoral system in Brazil generates a lot of political parties. These characteristics at the federal level have been studied in the literature, such asKinzo(1993) andRodrigues(2002). But these characteristics are not nec-essarily the same at the municipal level, where politics is focused more on local questions (Schmtt 2000). The party effect was considered through four
dummy variables, one for each of the largest parties – PMDB, PSDB, PFL15 and PT – which are the parties of 60% of the mayors, representing 55% of the population.
Besides these variables we also consider variables with the shape of munic-ipality as control variables, the rate of urbanization, the age range (younger than 10 and older than 65), gender and the Gini coefficient and spatial
densi-tiy of population.
4
Results
In this section we first discuss the treatment of the data, then analyze the performance of the specifications adopted, and finally examine the estimates.
4.1 Treatment of the data
The data set comes from a combination of four sources:a) the annual spend-ing accounts of the municipalities, produced by the Finance Ministry (avail-able in its Finbra system); b) the indicators that are included in the Human
15Since the data were gathered for this study, the PFL has changed its name to the “Democrats”
Development Index (HDI), mainly derived from the 1991 and 2001 Demo-graphic Census, conducted by the Brazilian Institute of Geography and Statis-tics (Instituto Brasileiro de Geografia e Estatística, IBGE); c) the electoral data made available by the Superior Electoral Tribunal (Tribunal Superior Eleitoral, TSE); andd) data from the Municipal Survey (Munic), also conducted by the IBGE. A detailed description of the data is presented in the Appendix.
The number of municipalities increased from 266 in 1990 to 567 in 2000, which made the population coverage of many municipalities variable over the period. The IBGE has defined the concept of “minimum comparable area” (Área mínima comparável, or AMC), which is a redefinition, stable for a cer-tain period, of the concept of the municipality. The use of this concept has the advantage of permitting analysis of the set, but hinders interpretation be-cause these entities are not political decision-making units. In this case, these entities should be viewed as being a “federation” of municipalities that gen-erates the resources of the participating municipalities, whose results reflect an average of the grouped region. For this reason, we estimated the model with a version that organizes the base with AMCs and another that excludes municipalities that were grouped in AMCs.
The source of information on public spending is the Brazilian Finances database, made available by the National Treasury Secretariat (Finbra-STN), part of the Finance Ministry, for the years 1989 and 1999. The public spend-ing per municipality is the average amount per municipality of total budget spending, deflated for the period, since data is missing for some municipali-ties in some years. The deflator adopted for the 1995-1999 period is the INPC (National Consumer Price Index) and that for the previous period is such that the total average spending in each year is equal to the total spending in 1994. It is difficult to measure public expenditures in a period of high
infla-tion16, because the distribution during the year is not known and varies by municipality. This makes use of a price deflator inadequate. We decided to deflate our spending series by the National Consumer Price Index (INPC) for the period from 1995 on and adjusted17for the period 1989-1995 to make the
total spending of all municipalities constant. To test how much this limita-tion influences the results, we estimated the model in two versions: one with the average per capita spending for the complete period (1989-1999); and the other only for the period after monetary stabilization (1995-1999). O finbra foi também utilizado para calcular a proporção das receitas municipais que são transferências dos estados ou da federação.
The social indicator is derived from the calculations of the HDI for 1991 and 2000. We chose all the indicators that measure social conditions that fall under local responsibility, namely 3 health indicators, 18 educational ones (basic through secondary) and 3 indicators of the supply of public services in general.
16Brazil suffered from very high and variable inflation during the study period (peaking as
high as 80% per month at times), punctuated by brief stable intervals, until the middle of 1994, when stability was finally achieved. Since then average inflation has been at single-digit yearly levels.
17. The spending is supplied in annual budgetary terms, so we do not know when the money
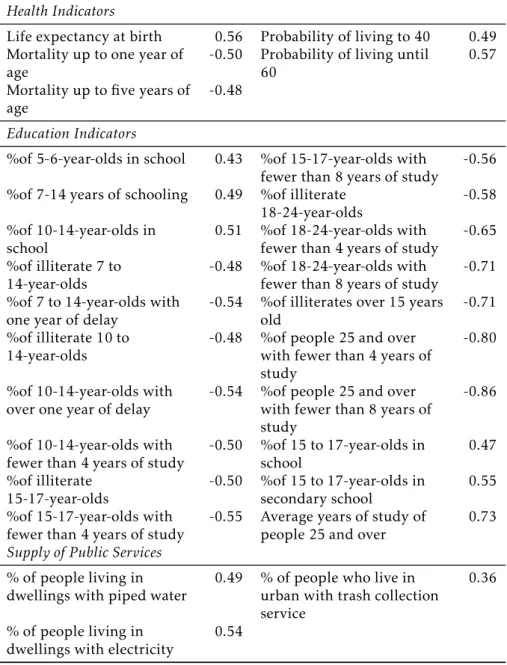
Table 1: Correlation between Social Indicators (S) and social index (Sβ)
Health Indicators
Life expectancy at birth 0.56 Probability of living to 40 0.49 Mortality up to one year of
age
-0.50 Probability of living until 60
0.57
Mortality up to five years of age
-0.48
Education Indicators
%of 5-6-year-olds in school 0.43 %of 15-17-year-olds with fewer than 8 years of study
-0.56
%of 7-14 years of schooling 0.49 %of illiterate 18-24-year-olds
-0.58
%of 10-14-year-olds in school
0.51 %of 18-24-year-olds with fewer than 4 years of study
-0.65
%of illiterate 7 to 14-year-olds
-0.48 %of 18-24-year-olds with fewer than 8 years of study
-0.71
%of 7 to 14-year-olds with one year of delay
-0.54 %of illiterates over 15 years old
-0.71
%of illiterate 10 to 14-year-olds
-0.48 %of people 25 and over with fewer than 4 years of study
-0.80
%of 10-14-year-olds with over one year of delay
-0.54 %of people 25 and over with fewer than 8 years of study
-0.86
%of 10-14-year-olds with fewer than 4 years of study
-0.50 %of 15 to 17-year-olds in school
0.47
%of illiterate 15-17-year-olds
-0.50 %of 15 to 17-year-olds in secondary school
0.55
%of 15-17-year-olds with fewer than 4 years of study
-0.55 Average years of study of people 25 and over
0.73
Supply of Public Services
% of people living in dwellings with piped water
0.49 % of people who live in urban with trash collection service
0.36
% of people living in dwellings with electricity
0.54
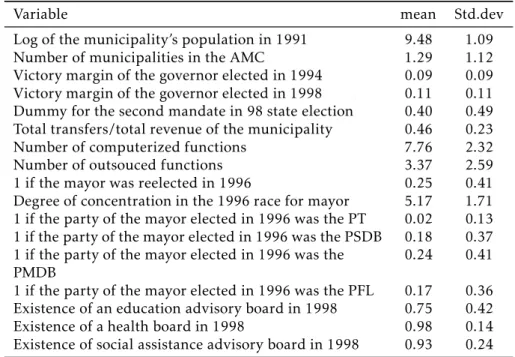
Table 2: Descriptive Statistics of (x,z) variables
Variable mean Std.dev
Log of the municipality’s population in 1991 9.48 1.09 Number of municipalities in the AMC 1.29 1.12 Victory margin of the governor elected in 1994 0.09 0.09 Victory margin of the governor elected in 1998 0.11 0.11 Dummy for the second mandate in 98 state election 0.40 0.49 Total transfers/total revenue of the municipality 0.46 0.23 Number of computerized functions 7.76 2.32 Number of outsouced functions 3.37 2.59 1 if the mayor was reelected in 1996 0.25 0.41 Degree of concentration in the 1996 race for mayor 5.17 1.71 1 if the party of the mayor elected in 1996 was the PT 0.02 0.13 1 if the party of the mayor elected in 1996 was the PSDB 0.18 0.37 1 if the party of the mayor elected in 1996 was the
PMDB
0.24 0.41
1 if the party of the mayor elected in 1996 was the PFL 0.17 0.36 Existence of an education advisory board in 1998 0.75 0.42 Existence of a health board in 1998 0.98 0.14 Existence of social assistance advisory board in 1998 0.93 0.24
Source: authors calculation
Table2shows the list of the indicators utilized, and as an example, the correlation between the quantitySβestimated in one of the models and each of the social indicators, and shows that the correlation is positive with each of the indicators whose increase indicates an improvement in conditions, and negative with the rest. The quantitySβis a linear combination ofS, and can be interpreted as a synthetic indicator of the social conditions.
The source of electoral variables is the TSE files and consider votes for gov-ernor in the 1994 and 1998 elections, votes for mayor in the 1996 election, and identification of governor and mayors in the second mandate. The variables are:
• Margin of victory over the runner-up candidate measured by the diff
er-ence in each municipality between the votes of the elected governor and the votes of the runner-up candidate for the 1994 and 1998 elections;
• Dummy indicating whether the governor was re-elected in 1998
• Degree of concentration of the votes received by the parties: sum of the squares of the party shares in the local election in 1996;
• Dummies indicating the mayor’s party;
• Dummy indicating whether the mayor was re-elected in 1996
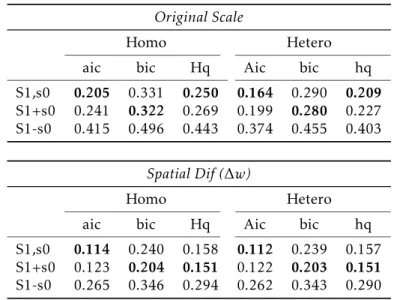
Table 3: Inforamtion Criteria
Original Scale
Homo Hetero
aic bic Hq Aic bic hq S1,s0 0.205 0.331 0.250 0.164 0.290 0.209
S1+s0 0.241 0.322 0.269 0.199 0.280 0.227 S1-s0 0.415 0.496 0.443 0.374 0.455 0.403
Spatial Dif (∆w)
Homo Hetero
aic bic Hq Aic bic hq S1,s0 0.114 0.240 0.158 0.112 0.239 0.157 S1+s0 0.123 0.204 0.151 0.122 0.203 0.151
S1-s0 0.265 0.346 0.294 0.262 0.343 0.290
4.2 Specifications
The estimate of the inefficiency of municipal management and the effect of the
explanatory variables depends on three questions: 1) the form of insertion of the efficiency determinants, equations (1) and (2); 2) the form of the
alloca-tion funcalloca-tion of the social indicators: variaalloca-tion, level or unrestricted form; 3) the choice of the information set – the effect of considering only the
non-fragmented municipalities – and the measure of public spending; and finally 4)the results can be obtained with or without correction for omitted variables. This makes a total of 36 models.
To simplify matters, we present the performance criteria for the case us-ing the expenditures over the entire decade and without restriction to non-fragmented municipalities. This gives us 12 models with the same dependent variable. This means that we can choose the specification that most closely ad-heres to the data using the standard information criteria in the econometrics literature, namely: AIC, BIC and HQ18. Table3present these results.
In the model estimated with the variables in the original scale, the best specification according to the criteria (aic,hq) is the heterogeneous model with the social variables in unrestricted form (s1,s0). In the case of the variables transformed with the operator (∆w), the best model, according to the criteria
(bic, hq) is the heterogeneous model with the social variables in level (s1 +s0). In all cases, the algorithm estimated an asymmetric term identified with a variance significantly different than zero, which indicates that the
unobserv-able component that measures the distance from the frontier does not have a spatial trend. In this case with the variables transformed by the operator (∆w), this component corresponds to the deviation of the distance from the
frontier and the results indicate that the asymmetry property is preserved for this transformation.
18. Respectively, Akaike’s information criterion, Bayesian information criterion and the
4.3 Estimates
The estimates are presented for the coefficients of the variables that explain
the cost of supplying the service and the determinants of inefficiency. For both
cases the table shows the results of the three information sets: spending in the entire decade (c90), spending in the second five years (c95), and spending in the decade limited to the non-fragmented AMCs (c89x), this is combined with the (c90,c95) cases for the model with the variables transformed by the operator (∆w)19 that mitigate the effect of non observed variables.
The results obtained with the best model for data in original scale and transformed by the operator (∆w) are organized in tables 4 and 5 according
to the type of determinant. To evaluate the robustness of these results we estimated the model g|S, x, z using OLS and robust standard errors, and ob-tained, qualitatively, the same results. To simplify matters, we omitted the coefficients of the social indicators and control variables and coefficients not
significant at the 10% level.
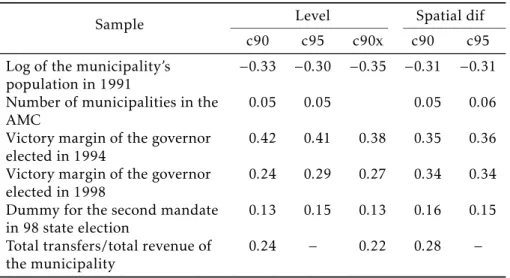
Table4shows that all coefficients are significant (1%) for all versions
es-timated, except the coefficient related to federal transfers, which is not
sig-nificant for the c95 case. The results are almost the same for all versions, despite the criticism of the low quality of data before 1995 and of the effect of
aggregation of municipalities in AMC.
An increase of scale and a decrease in fragmentation reduce the spend-ing required to obtain the same amount of social result. The governors have the option of allocating in discretionary form a fraction of the public expen-ditures under their control, and thus can do so as a way to satisfy collective interests or according to electoral logic. These expenditures are not observed, but we can observe the result of this action in terms of votes. The results show a patronage relationship between the governor candidate and his or her base constituencies for governor candidate in 1994 and 1998. This evidence indicates that the greater the loss margin of the elected governor in the mu-nicipality, the lower that municipality’s spending, which can indicate the ex-istence of focused and direct expenditures of the state government in the area of education and health.
In the 1994 election there was no possibility of re-election, so all the can-didates were new entrants, unlike the 1998 election. The dummy variable in-dicates the municipalities located in states where the governor was re-elected. The result shows that the governor’s re-election implies higher spending for the same social state, suggesting that a second-term governor exercises less cronyism than a first-term one, who stil has a chance of re-election.
For the first information set, spending over the whole decade (c90, c90x de-c90), the higher proportion of municipal revenue received as transfers im-plies increased spending for the same social result. These resources come from the state or federal treasury and are monitored by the respective audit tribunals. The fact that this variable is significant when we consider the entire decade but not for the end of the decade can be related to the more efficient
monitoring of these expenditures at the end of the decade.
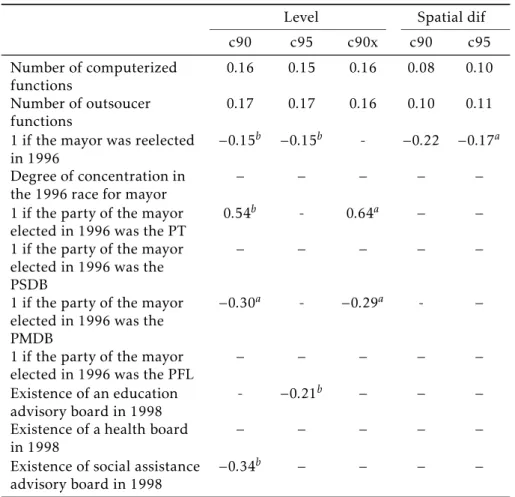
Table5shows that the significance of the coefficients depends on the
ver-sion. Only the effect of the number of computerized and outsourced functions
is significant at the 1% level for all the cases studied. This is an unexpected
Table 4: Effect on Spending
Sample Level Spatial dif c90 c95 c90x c90 c95 Log of the municipality’s
population in 1991
−0.33 −0.30 −0.35 −0.31 −0.31
Number of municipalities in the AMC
0.05 0.05 0.05 0.06
Victory margin of the governor elected in 1994
0.42 0.41 0.38 0.35 0.36
Victory margin of the governor elected in 1998
0.24 0.29 0.27 0.34 0.34
Dummy for the second mandate in 98 state election
0.13 0.15 0.13 0.16 0.15
Total transfers/total revenue of the municipality
0.24 − 0.22 0.28 −
Coefficient Significant for 1%
aCoefficient Significant for 5%
aCoefficient Significant for 10%
result. The inefficiency increases when the number of computerized and
out-sourced functions is higher. In other words, more computerized and dele-gated management does not generate productive gains or increase the level of transparency and control enough to make it more efficient. Thus words, these
gains do not offset the cost incurred to adopt these practices.
The effect of the dummy variable for a reelected mayor is significant for
most of the cases, indicating a correlation with the reduction of inefficiency.
The other variables are related to local politics. The degree of concentration of voters in the race for mayor and political party of the elected mayor and the relations with the existence of citizens’ boards are not significant for the spatial difference regression. These effects are not robust. This suggests that
these variables are not related to better management, implying an asymmetry of information in the local political market.
5
Conclusion
The quality of life represented by the population’s state of health and educa-tion – largely atributes of municipal responsibility – can be characterized by social indicators obtained from census data, and are multiple-interdependent attributes. Municipal administration can be viewed as a productive unit that uses a technology that associates expenditures with welfare and is represented by a production possibility frontier. The distance of each municipality from this frontier is a measure of the inefficiency of its administration.
The transformation of spending into public services that conditions the state of education and health is a complex and slow process, which depends on the volume of expenditures, the conditioning factors of the production cost and the inefficiency with which these expenditures are made. This
inef-ficiency, in turn, depends on the relation between the benefit obtained by the manager and the cost of his or her effort. Therefore, the heterogeneity of the
Table 5: Explaining Inefficiency
Level Spatial dif c90 c95 c90x c90 c95 Number of computerized
functions
0.16 0.15 0.16 0.08 0.10
Number of outsoucer functions
0.17 0.17 0.16 0.10 0.11
1 if the mayor was reelected in 1996
−0.15b −0.15b - −0.22 −0.17a
Degree of concentration in the 1996 race for mayor
− − − − −
1 if the party of the mayor elected in 1996 was the PT
0.54b - 0.64a − −
1 if the party of the mayor elected in 1996 was the PSDB
− − − − −
1 if the party of the mayor elected in 1996 was the PMDB
−0.30a - −0.29a - −
1 if the party of the mayor elected in 1996 was the PFL
− − − − −
Existence of an education advisory board in 1998
- −0.21b − − −
Existence of a health board in 1998
− − − − −
Existence of social assistance advisory board in 1998
−0.34b − − − −
Coefficient Significant for 1% aCoefficient Significant for 5% aCoefficient Significant for 10%
public administrator perceives to endeavour to be more efficient and by the
local supply conditions that alter the marginal cost of this effort.
This study related the observed production cost of municipal service with measures of the final aim of this service in order to obtain a substantive mea-sure of the efficiency of municipal public service and to evaluate whether
po-litical patronage and other popo-litical economy measures affect this result.
The model adopted estimates a production possibility frontier that relates a measure of the state of the population, to the per capita spending in condi-tional form to the cost of supplying the service and the incentives for efficient
spending. In order to mitigate the effect of omitted variables the model uses
spatial trend differences.
We estimated various specifications for this model using different
mea-sures of spending, ways to measure the effect on the population’s state, and
criteria to identify inefficiency an approach that mitigates the effect of omitted
the dismemberment of municipalities increased this spending and that there is an indication that governors reward their municipal voters with higher dis-cretionary spending; 3) the margin of votes for a governor race has an effect on
allocation of state spend between municipalities; 4) the efficiency is decreased
by greater computerization or outsourcing of services; and finally 5) the ex-istence of local advisory boards and political competition in the mayoral race did not affect the level of efficiency of local management.
In sum, the size of the spending needed to attain a certain level of qual-ity is associated with some characteristics of municipalities, scale, municipal fragmentation and patronage of an elected governor. The fact that the local political variables were not significant, on the other hand, evidences the exis-tence of information asymmetry in the local electoral process.
Although the results are suggestive for the understanding of municipal political economies, they must be taken with caution because with this type of data we can only measure non-causal effects, and because the observed
political and institutional variables only covered the last half of the decade under study a limitation that could only be corrected with a broader data set.
Bibliography
Afonso, A. & Aubyn, M. S. (2005), ‘Non parametric approaches to education and health efficiency in oecd countries’,Journal of Applied Economics8, 227–
246.
Afonso, A., Schuknecht, L. & Tanzi, V. (2005), ‘Public sector esfficiency: an
international comparison’,Public Choice123, 321–347.
Alston, L., Melo, M., Meuller, B. & Pereira, C. (2007), The choices governors made: political institutions and economic performance at the sub-national level in brazil., Technical report, IPEA.
Atkinson, A. B. & Stiglitz, J. E. (1980),Lectures on Public Economics, McGraw Hill.
Besley, T. & Ghatak, M. (2003), Incentives, choices and accountability in the provision of public services, Technical report, Institute for Fisical Studies.
Burgess, S. & Metcalfe, P. (1999), The use of incentive schemes in the public and private sectors: evidence from british establishments, Technical report, CMPO.
Coelli, T. A. (1996), A guide to deap version 2.1, Technical report, University of New England-Armindale.
Cutler, D. M., Elmendorf, D. W. & Zeckhauser, R. J. (1993), ‘Demographic influences on local public education expenditure: a review of econometric evidence.’,Public Finance48, 178–198.
Dixit, A. K. (1996),The making of economic policy: a transaction-cost politics perspective, MIT Press.
Estache, A., Gonzalez, M. & Trujillo, L. (2007), Government expenditures on education, health, and infrastructure: a naive look at levels, outcomes, and efficiency., Technical report, World Bank Policy Research.
Keefer, P. & Khemani, S. (2005), ‘Democracy, public expenditures, and the poor: understanding political incentives for providing public services’,The World Bank Research Observer20, 1–27.
Kinzo, M. D. G. (1993), Radiografia do quadro partidário brasileiro., Techni-cal report, Fundação Konrad Adenauer.
Lake, D. A. & Baum, M. A. (2001), ‘The invisible hand of democracy: political control and the provision of public services’, Comparative Political Studies
34, 587–621.
Lütkepohl, H. (1991),Introduction to multiple time series analysis, Springer-Verlag.
Meltzer, A. & Richard, S. (1981), ‘A rational theory of the size of government’,
Journal of Political Economy89, 914–927.
Rodrigues, L. M. (2002),Partidos, ideologias e composição social: eum estudo
das bancadas partidárias na Câmara dos Deputados, Editora Edusp.
Schmtt, R. (2000),Partidos políticos no Brasil (1945-2000), Editora Zahar.