S
C
I
E
N
T
I
F
I
C
-T
E
C
H
N
I
C
A
L
Natural rubber latex: determination and
interpretation of flow curves
Harrison Lourenço Corrêa
1,2*
, Ana Maria Furtado de Sousa
1and Cristina Russi Guimarães Furtado
11
Departamento de Processos Químicos, Instituto de Química,
Universidade do Estado do Rio de Janeiro - UERJ, Rio de Janeiro, RJ, Brazil
2
Departamento de Engenharia Química, Instituto de Tecnologia,
Universidade Federal Rural do Rio de Janeiro - UFRRJ, Seropédica, RJ, Brazil
*[email protected]Abstract
As consumers become more demanding, the importance grows of guaranteeing the quality of products. The employment of reliable testing techniques that assure the origin and characteristics of the inputs used by industry is a key factor in this respect. In the rubber processing industry, the most commonly used characterization tests include determination of the total solids and dry rubber content, mechanical stability, odor, color and presence of volatile compounds, among others. For the most part, these tests are suficient for the latex transformation industry. However, in situations where there is a need to know the behavior of latex in reaction to the mechanical forces of machines (mixers, pumps, etc.), other tests must be used. Rheological tests to determine viscoelastic data by means of plotting low curves combined with the application of theoretical models can provide important details for characterization of different types of latex. This article presents the protocol employed by the Rheology and Image Laboratory of Rio de Janeiro State University (UERJ) for the rheological study of Brazilian latex. The samples analyzed came from the state of São Paulo.
Keywords: latex, natural rubber, rheology.
1. Introduction
Natural rubber latex (NRL) for industrial purposes is sold in concentrated form, with high dry rubber content (DRC), of 30 to 60%, depending on the productive process. Because it is a material resulting from plant physiology, natural latex needs a series of analyses to monitor and control its quality. The testing protocols serve to ascertain the concentrations of certain components (levels of minerals, thiols, proteins, lipids, carbohydrates, etc.). The results of these tests are important indicators of rubber tree productivity[1]. Once the latex is extracted from the tree, these parameters must be adjusted to the processing needs of each industry. Therefore, it is necessary to employ preliminary processing stages, including concentration and addition of preservation agents (generally ammonia), before sending the material to the factory. Although ammonium hydroxide is the preferred preservation agent due to its low cost, others can be used to prevent coagulation of NRL, such as sodium sulfide, formalin and zinc oxide[2]. Many articles have studied the components of natural latex, including some addressing the diagnostic techniques[3-6]. The results presented are important to the extractive and productive segments of the rubber sector. Other lines of research into latex involve rheology. This entails, for example, measuring the viscosity of the raw material (60% concentrated) in function of temperature variation, or more specifically, in function of shear rate[7]. These studies provide data on the material’s behavior when submitted to industrial processing conditions (agitation, pumping, evaporation, etc.) that are useful for manufacture of latex articles.
Although the diagnosis of the components of natural latex is consolidated, there is a lack of data in this material’s rheology. Determination of the best processing conditions requires data on how latex behaves as a Newtonian fluid, obtained from flow curves as well as application of mathematical models able to describe the flow behavior under various conditions. This article makes a contribution in this respect.
2. Materials and Methods
We used NRL samples supplied by the company Colitex, located in the state of São Paulo, Brazil. These samples varied as to content of stabilizer added, and are called here low concentration (LC), 0.2% of NH4OH (w/w) and ‘normal’ concentration (NC), with concentration higher than 0.6% of NH4OH (w/w). Table 1 presents the properties of the NRL samples.
For the purpose of proposing a scientific method that can correlate the behavior of natural rubber latex to the needs of processing industries, we evaluated the flow curves for different samples obtained from industrial suppliers. For this, we employed an Anton Paar model MCR-301 coaxial cylinder rheometer equipped with a Peltier temperature control system. The latex samples were shaken manually for 10 seconds before being transferred to the measurement reservoir.
(10-100 s–1 and 10-1000 s–1), so as to determine the limits of Newtonian behavior.
The temperatures of these assays were previously programmed at 25, 30 and 40 °C, based on the probable temperatures reached during the packing and transport of the raw material, according to the rheological testing conditions shown in Table 2.
3. Results and Discussion
3.1 Flow curvesThe samples were assigned alphanumeric codes in the form ‘XXX-FCXX’, where the first letter of the first group represents the origin of the sample (first letter of the company’s
name) and the next two indicate the stabilizer concentration (LC – low concentration, 0.2% w/w; NC – concentration higher than 0.6% w/w), and the second group identifies the test (FC – flow curve) and temperature (25 / 30 / 40 °C).
To assess the repeatability of the tests, the samples were submitted to three runs (1, 2, 3), under the same conditions (temperature and shear range). Figures 1, 2 and 3 show the stress behavior (σ) in function of shear rate (ẏ) at the three temperatures, as well as the evolution of viscosity (η) in relation to shear rate.
From the overlap of all three curves generated by the tests (runs 1, 2, 3), it can be perceived that the method applied combined with careful preparation of the samples (agitation, conditioning, weighing and transfer) and equipment calibration produced repeatable results for the conditions employed.
Analysis of the curves (b) of Figures 1-3 shows that regardless of the temperature, the samples behaved as Newtonian fluids at low shear rates. The viscosity of the natural latex rubber samples declined with increasing shear rate because of the pseudoplastic behavior.
Figures 4, 5 and 6, showing the flow curves of the samples with concentration of NH4OH higher than 0.6% (w/w), indicate similar behavior: a decrease in viscosity with rising shear rate, defined limit of the Newtonian fluid region and repeatability of the results.
3.2 Application of the models to the experimental data
Predicting the behavior of fluids when subjected to mechanical forces is always useful to determine the best processing parameters, especially in the case of polymer materials. In this respect, the use of mathematical models able to reproduce the observed phenomenon is essential to the productive sector to enable adjustment of the data Table 1. Properties of the NRL samples.
Properties LC Sample NC Sample
Total solids content (%)
59 61
Dry rubber content (%)
60 60
NH4OH (%, w/w) 0.2 >0.6
pH 10 11
Color White White
Odor Slightly sweet Slightly sweet
Film color No gray or blue No gray or blue
Table 2. Rheological testing conditions for determination of the flow curves.
Parameters Parameters applied in the tests
Total testing time (s) 930
Testing temperatures (°C) 25 / 30 / 40
Shear ranges (s–1) 10 to 100 / 10 to 1000
Figure 1. Flow curves (25 °C) for the natural latex sample supplied by Colitex (0.2% NH4OH, w/w): (a) strain versus shear rate;
(b) viscosity versus shear rate.
Figure 2. Flow curves (30 °C) for the natural latex sample supplied by Colitex (0.2% NH4OH, w/w): (a) strain versus shear rate;
obtained from laboratory tests to the real processing conditions (industrial scale).
Analysis of Figures 1b-6b allows concluding that the samples investigated behaved as non-Newtonian fluids. More
specifically, they behaved as pseudoplastic (shear thinning) fluids, since the viscosity decreased with increasing shear rate. However, a more attentive observer might question the non-Newtonian behavior of the samples, since the curves of
Figure 3. Flow curves (40 °C) for the natural latex sample supplied by Colitex (0.2% NH4OH, w/w): (a) strain versus shear rate;
(b) viscosity versus shear rate.
Figure 4. Flow curves (25 °C) for the natural latex sample supplied by Colitex (>0.6% NH4OH, w/w): (a) strain versus shear rate;
(b) viscosity versus shear rate.
Figure 5. Flow curves (30 °C) for the natural latex sample supplied by Colitex (>0.6% NH4OH, w/w): (a) strain versus shear rate;
(b) viscosity versus shear rate.
Figure 6. Flow curves (40 °C) for the natural latex sample supplied by Colitex (>0.6% NH4OH, w/w): (a) strain versus shear rate;
σ x ẏ (Figures 1a-6a) at first were linear (suggesting ideal, and hence Newtonian, behavior). In this case, the shear rate range used (0 to 100 s–1) might have been too low to reveal the non-Newtonian domain of the latexes. However, the tests carried out up to higher rates (10 to 1000 s–1) confirmed the behavior originally noted: linear σ x ẏ curves, suggesting
probable Newtonian behavior, as can be seen in Figure 7a. At high shear rate, the sample yet keeps the non-Newtonian behavior, as noted by Figure 7b.
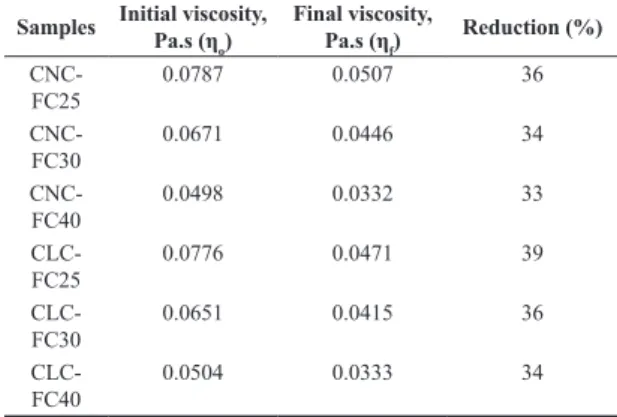
Table 3 shows the initial and final viscosity values obtained after applying shear rates between 10 and 100 s–1.
For all the temperatures analyzed, the application of shear stresses in the range of 10 to 100 s–1 on the NRL samples caused a reduction of over 30% in the initial viscosity, independent of the preservative concentration.
Table 4 shows the mean viscosities of the NRL samples (ηm) at each temperature.
An increase of 15 °C in the testing temperature promoted reductions in viscosity of 36% and 32% for samples CNC and CLC, respectively, near the reduction attained by the application of mechanical force.
The non-ideal behavior of the samples can be confirmed by the rheological models applied to the experimental data and their respective correlation coefficients.
3.2.1 Model applied to Newtonian fluids
As seen previously, in fluids with ideal behavior the fluid’s resistance to deformation is directly proportional to the shear rate applied, according to Equation 1[8].
y σ =
η (1)
From the previous discussion, the dispersion of the experimental data can suggest ideal behavior of the latex samples. Figures 8-13 show the empirical data fitted to the model of Equation 1 (red line).
The curves fitted according to Equation 1 show decreasing viscosity (which is predicable) of the latex samples with 0.2% of NH4OH as stabilizer, with correlation coefficients (R2) between 0.9568 and 0.9694. These coefficients, which can vary from 0 to 1, are essential to verify the concordance between the empirical data and the behavior proposed by the model. The nearer the coefficient is to 1, the better the fit[9], so that more accurate predictions of y can be made from the known values of x[10].
3.2.2 Model applied to non-Newtonian fluids (power law)
Within a determined shear rate range, some fluids can present very distinct regions in the graph of η x ẏ.
For the typical rheogram (curve obtained by plotting shear rate x viscosity)[11], there is a model able to represent the curve in the entire region. This model is called the Cross model, in homage to the noted rheologist Malcolm Cross[8], is expressed by Equation 2.
0
1 1 ( .y) o
m
K
∞
− =
− +
η η
η η (2)
Where K is the time dimension and m is a dimensionless constant, associated with the pseudoplastic nature of the fluid. The nearer to 1 this constant is, the more pseudoplastic the material will be, while the nearer it is to 0, the more Newtonian the fluid’s behavior will be.
Table 4. Mean viscosities obtained at temperatures of 25, 30 and 40 °C.
Samples Mean viscosity (Pa.s)
CNC-FC25 0.0629
CNC-FC30 0.0543
CNC-FC40 0.0401
CLC-FC25 0.0603
CLC-FC30 0.0520
CLC-FC40 0.0408
Table 3. Initial (ηo) and final viscosity (ηf) corresponding to shear rates of 10 s–1 and 100 s–1, respectively, for different NRL samples
at temperatures of 25, 30 and 40 °C.
Samples Initial viscosity, Pa.s (η
o)
Final viscosity,
Pa.s (ηf)
Reduction (%)
CNC-FC25
0.0787 0.0507 36
CNC-FC30
0.0671 0.0446 34
CNC-FC40
0.0498 0.0332 33
CLC-FC25
0.0776 0.0471 39
CLC-FC30
0.0651 0.0415 36
CLC-FC40
0.0504 0.0333 34
Figure 7. Flow curves (40 °C) for the natural latex sample supplied by Colitex (>0.6% NH4OH, w/w): (a) stress versus shear rate
Figure 13. Flow curve (40 °C) for the natural latex sample supplied by Colitex (>0.6% NH4OH, w/w) fitted to Equations 1 (linear)
and 3 (power). However, by making some assumptions, such as:
ηo >> η∞, K.ẏ >> 1 and small η∞ (which can be verified from Figures 1b-6b), Equation 2 can be developed as follows:
0 0
1 .
y
m m
K
− =
η
η η (2.1)
0 0
1 .
y
m m
K
= +
η
η η (2.2)
0
1 1
. 1 .
y
m m
K
= +
η η (2.3)
By replacing the variables K and m with the variables k and n, the Ostwald-de Waele equation is obtained (Equation 3), also called the power law[8,11-13].
1 .yk n−
=
η (3)
Or
.yk n
=
σ (4)
Where k is the flow consistency index and n is the power law index (or flow behavior index). In this case, as
m approaches (n-1), the new index will indicate more nearly Newtonian behavior the closer the value of n is to 1[8,11,12].
From this standpoint, based on the assumption that the fluid is non-Newtonian and hence, with the experimental data arranged according to the tendency described by the power law, Figures 8-10 and Figures 11-13 show the respective adjustments by the model described in Equation 3 (green line) for the samples with 0.2% of NH4OH and concentration higher than 0.6% for the same stabilizer, respectively.
The correlation coefficients of the curves plotted according to the Ostwald-de Waele model for the latex samples with low preservative concentration, at all three temperatures analyzed, are very near 1 (0.999), showing that the power law is able to adequately represent the experimental data. The coefficients of m, greater than 0.7, reinforce the non-Newtonian behavior of the samples analyzed[8]. Figure 8. Flow curve (25 °C) for the natural latex sample supplied
by Colitex (0.2% NH4OH, w/w) fitted to Equations 1 (linear) and
3 (power).
Figure 9. Flow curve (30 °C) for the natural latex sample supplied by Colitex (0.2% NH4OH, w/w) fitted to Equations 1 (linear) and
3 (power).
Figure 10. Flow curve (40 °C) for the natural latex sample supplied by Colitex (0.2% NH4OH, w/w) fitted to Equations 1 (linear) and
3 (power).
Figure 11. Flow curve (25 °C) for the natural latex sample supplied by Colitex (>0.6% NH4OH, w/w) fitted to Equations 1 (linear)
and 3 (power).
Figure 12. Flow curve (30 °C) for the natural latex sample supplied by Colitex (>0.6% NH4OH, w/w) fitted to Equations 1 (linear)
Just as for the samples with low preservative concentration (0.2% of NH4OH, w/w), the experimental data obtained from the rheological tests for the latex samples containing a NH4OH concentration >0.6% (w/w) better fit the Ostwald-de Waele model. In comparison with the fits provided by the Newtonian model, the power law allowed more precise convergence of the experimental data, with correlation coefficients of 0.999. The values of m obtained (greater than 0.8) reaffirm the non-ideal behavior of the samples analyzed.
The application of the Ostwald-de Waele model (power law) to the empirical data and their subsequent convergence allows inferring that reduced viscosity of the samples with rising shear rate indicates non-ideal behavior, already starting at shear rates between 0 and 100 s–1.
4. Conclusions
The results presented here show that the application of thermal or mechanical energy is sufficient to reduce the viscosities to similar levels, by around 35%. In this case, increases in temperature of 15 °C resulted in viscosities near those observed when the samples were submitted to shear stresses of 100 s–1.
Mathematical modeling is an essential tool for analysis and discussion of the rheological behavior of natural rubber latex, allowing a more precise investigation of its pseudoplastic behavior based on flow curves. The increase in temperature promoted a reduction of the average viscosity of the latex samples, and when this was analyzed employing shear stress and shear rate data, the power law best represented the behavior, even for shear rates between 0 and 100 s–1.
It was observed that the shear rate around 60 s–1 is the limit between the Newtonian and non-Newtonian behavior at all temperatures studied.
5. Acknowledgements
The authors are grateful for Colitex by supply of natural rubber latex.
6. References
1. American Standard Testing for Materials - ASTM. (2010).
ASTM D1076: Standard specification for rubber-concentrated, ammonia preserved, creamed and centrifuged natural latex. West Conshohocken.
2. Jawjit, W., Pavasant, P., & Kroeze, C. (2015). Evaluating environmental performance of concentrated latex production in Thailand. Journal of Cleaner Production, 98, 84-91. http:// dx.doi.org/10.1016/j.jclepro.2013.11.016.
3. Siler, D. J., & Cornish, K. (1995). Measurement of protein in natural rubber latex. Analytical Biochemistry, 229(2), 278-281. http://dx.doi.org/10.1006/abio.1995.1413. PMid:7485983. 4. Bonfils, F., Ehabe, E. E., Aymard, C., Vaysse, L., &
Sainte-Beuve, J. (2007). Enhanced solvent extraction of polar lipids associated with rubber particles from Hevea brasiliensis.
Journal of Phytochemical Analysis, 18(2), 103-108. http:// dx.doi.org/10.1002/pca.956. PMid:17439009.
5. Liengprayoon, S., Bonfils, F., Sainte-beuve, J., Sriroth, K., Dubreucq, E., & Vaysse, L. (2008). Development of a new procedure for lipid extraction from hevea brasiliensis natural rubber. European Journal of Lipid Science and Technology,
110(6), 563-569. http://dx.doi.org/10.1002/ejlt.200700287. 6. Sansatsadeekul, J., Sakdapipanich, J., & Rojruthai, P. (2011).
Characterization of associated proteins and phospholipids in natural rubber latex. Journal of Bioscience and Bioengineering,
111(6), 628-634. http://dx.doi.org/10.1016/j.jbiosc.2011.01.013. PMid:21354367.
7. Jatuporn, S. (2006). Rheological properties of natural rubber latex (Master’s thesis). Suranaree University of Technology, Thailand.
8. Barnes, H. (2000). A handbook of elementary rheology. Aberystwyth: Cambrian Printers.
9. D’Urso, P., & Santoro, A. (2006). Goodness of fit and variable selection in the fuzzy multiple linear regression. Fuzzy Sets and Systems, 157(19), 2627-2647. http://dx.doi.org/10.1016/j. fss.2005.03.015.
10. Brown, A. M. (2001). A step-by-step guide to non-linear regression analysis of experimental data using a Microsoft Excel spreadsheet. Computer Methods and Programs in Biomedicine, 65(3), 191-200. http://dx.doi.org/10.1016/ S0169-2607(00)00124-3. PMid:11339981.
11. Perry, R., Green, D., & Maloney, J. (1999). Perry’s chemical engineers’ handbook. United States: McGraw-Hill.
12. Macosko, C. (1994). Rheology, principles, measurements and applications. United States: Wiley-VCH.
13. Sorbie, K., Clifford, P., & Jones, E. (1989). The rheology of pseudoplastic fluids in porous media using network modeling.
Journal of Colloid and Interface Science, 130(2), 508-534. http://dx.doi.org/10.1016/0021-9797(89)90128-8.