Rev Saúde Pública 2005;39(1) www.fsp.usp.br/rsp
INTRODUCTION
The Family Health Program (FHP) is a strategy for reorganizing the healthcare attendance system within the Brazilian National Health System (Sistema Único de Saúde - SUS). It has been described as a tool for promoting equity in the offer of services.5 This
pro-gram started to be disseminated at a national level in 1996. It consists of a method of primary attendance that is implemented, as a priority, for populations at
H ealth services utilization in areas covered by
the family health program (Q ualis) in Sao
Paulo City, Brazil
M oisés Goldbauma, Reinaldo José Gianinia, H illegonda M aria D utilh N ovaesa and Chester
Luiz Galvão Césarb
aDepartamento de Medicina Preventiva. Faculdade de Medicina. Universidade de São Paulo (USP). São
Paulo, SP, Brasil. bDepartamento de Epidemiologia. Faculdade Saúde Pública. USP. São Paulo, SP, Brasil
Correspondence to:
Moisés Goldbaum Av. Dr. Arnaldo, 455 2o andar 01246-903 São Paulo, SP, Brasil E-mail: [email protected]
Keywords
Health services, utilization. Family health. Morbidity. Equity. Data collection. Delivery of health care. Health services coverage. Health services research. Population survey.
Funded by Fundação de Amparo à Pesquisa do Estado de São Paulo (Fapesp - Grant n. 1998/15246-3), and by the STD/ AIDS/MS project (Grant n. 635/99).
Received on 28/5/2004. Approved on 30/7/2004. Abstract
Objective
The Family Health Program (FHP) is a strategy for reorganizing the healthcare attendance system within the Brazilian National Health System. The objective of the study was to assess whether there had been changes in the utilization profile of the healthcare services following implementation of the program, and to identify factors associated with any changes observed.
Methods
Data on service utilization and demand for attendance were analyzed by means of two cluster-based population samples, representing areas covered (n=1865) and not covered (n=2036) by the FHP, in two districts of the municipality of São Paulo. The data formed part of a population survey carried out in 2001. Statistical methods for cluster analysis were used.
Results
In the area covered by the FHP, no statistically different prevalence ratios (PR) according to schooling and income levels were observed for service utilization. In the area not covered by the FHP, service utilization was positively associated with greater schooling and income. Among individuals with illnesses, the demand for attendance in the area covered by the FHP was higher (higher PR) among those with severe physical limitations. In the area not covered, the PR was higher among those with greater schooling and lower among those who were inactive (unemployed or retired).
Conclusions
In the areas studied, for the population covered by the FHP, income and schooling levels did not constitute factors that significantly differentiated the utilization profile of the healthcare services and the demand for attendance. This indicates that the program may be contributing towards greater equity under these conditions.
Rev Saúde Pública 2005;39(1) www.fsp.usp.br/rsp
Utilization of Family Health Program Goldbaum M et al
utilizing healthcare services to the level of quality of life and the level of individuals’ knowledge of health-care and the network of services. Individuals’ capac-ity to self-assess their state of health and also their expectations and needs for attendance, their self-care practices, the existence of alternative networks and the relative degree of autonomy that these have also collaborate in this determination.4 Prominent among
the factors associated with the utilization of health-care services are sex, age, socioeconomic conditions and the morbid condition. In general, healthcare serv-ices are utilized more by women, children and the elderly, the more wealthy and more educated, those who have healthcare plans, and those who present morbid conditions.9
Equity in healthcare, according to Braveman,1
con-sists of the minimization of existing disparities be-tween groups that present differing degrees of social privilege. This implies that need must be considered in healthcare attendance. Part of this inequality in the utilization of healthcare services may be a repre-sentation of iniquity, especially in relation to socio-economic conditions, that does not correspond to inequality in the need for healthcare attendance.13
Culyier3 made a distinction between two forms of
equity: horizontal, which signifies equal attention to equal needs; and vertical, which signifies unequal attention for different needs.
By comparing two samples, one representing a population covered by the FHP and the other not cov-ered by it, the present study had the objective of ana-lyzing differences in the degree of service utilization (preventive or curative) and in the demand for at-tendance among those who report some episode of illness. The study also had the objective of analyzing the distribution of service utilization and demand for attendance, according to some indicators of socio-economic conditions, and sex, age and morbidity (or the respective limitations of activities). For this, it was decided to perform a population-based health survey, since this is one of the best ways for making health diagnoses. This method has the capacity to reveal a more complete picture than an investigation built up from the records of services and institutions.2
M ETH O D S
This study formed part of a larger project with the name “Study of morbidity and utilization of health-care services among the population covered by the Qualis project”.* It was also a component of the na-tional multicenter project “New healthcare attend-the municipality of São Paulo began with attend-the Qualis
program in Itaquera, in 1996, and São Lucas Park, Sapopemba and the Nova Cachoeirinha district, in 1997. It was differentiated from the national program in how it was managed, in establishing working agree-ments with social organizations, and in incorporat-ing other attendance resources for supportincorporat-ing family healthcare teams, such as oral health, mental health and specialized outpatient services.10
There is a pressing need to verify what possibilities the program has for producing an impact in a large metropolis like São Paulo. The impact can be meas-ured through the changes in the utilization profile of the healthcare services among the populations that it covers, and by analyzing whether these changes con-verge with the objectives of the program. The need for verification comes firstly because it has to be taken into consideration that the populations on the pe-riphery of São Paulo may have a variety of other re-sources available for healthcare.11 In this
municipal-ity, there is a high degree of development of health-care attendance, with great complexity of the net-work of services present. The FHP is therefore not the only alternative in the basket of options that these populations have. Secondly, verification is needed because the impact of the FHP has to be distinguished from the trend towards expanding the utilization of services that has been described for the period 1989-1997.12 This effect was the result from the
implemen-tation of SUS, during a period in which the actions followed the traditional model and the FHP was just beginning. During this period, a small reduction in inequality of service provision could be seen.
Several questions need to be considered when evalu-ating a given utilization profile for healthcare serv-ices. The type of service sought, chosen from within a range that includes basic healthcare units, urgent ices, emergency services, specialized outpatient serv-ices or clinics, and public or private hospitals, de-pends on its proximity and the access offered, as well as the social and cultural values associated with such consumption. The reasons for utilization and its fre-quency, the seeking of attendance at the right mo-ment or late, and the preventive, attendance, labora-tory or therapeutic procedures involved are also im-portant aspects to be analyzed.14 The dynamics
es-tablished between the clientele and the service, or between demand and offer, are reflected in the degree of problem-solving powers within the healthcare serv-ice and the degree of user satisfaction.
The literature relates the intensity and manner of
!
Rev Saúde Pública 2005;39(1) www.fsp.usp.br/rsp
Utilization of Family Health Program Goldbaum M et al
ance models: Evaluation of the healthcare program (FHP) in the municipality of São Paulo” which was developed between 1998 and 2002.*
This project was evaluated and approved by the Ethics Committee of Hospital das Clínicas, School of Medicine of the University of São Paulo.
This was a cross-sectional study, for which the data collection was done in two districts attended by the Qualis project (Nova Cachoeirinha and Curuçá dis-tricts) between January and March 2001. It covered a total of approximately 190,697 inhabitants. Sampling by clusters was performed. The population analyzed consisted of residents of the Curuçá and Nova Cachoeirinha districts, divided into four strata: a) 33,949 residents of the part of the Nova
Cachoeirinha district that was within the coverage area of the Qualis project units of the Galvão and Ilza Hutzler districts;
b) 76,638 residents of the Cachoeirinha district, outside of the area of coverage of the Qualis project; c) 27,589 residents of the part of the Curuçá district that was within the coverage area of the Qualis project units of Silva Teles and Santa Rita; d) 52,521 residents of the Curuçá district, outside of
the area of coverage of the Qualis project.
For each stratum, the census sector and the home were adopted as the primary and secondary sampling units, respectively. All those living in the home that was drawn were included in the sample and were in-terviewed. For the strata b and d, 30 census sectors were drawn, with a probability proportional to the size of the district and, within these, 10 homes were drawn. For the strata a and c, the areas were divided into micro-areas that corresponded to the geographi-cal spaces covered by a single community healthcare agent. For each micro-area (out of a total of 30), 10 homes were drawn. This procedure allowed 300 fami-lies to be identified in each stratum.
The present study analyzed the variables sex, age, income, schooling, work situation, pension coverage, healthcare service utilization over the 15 days prior to the interview, demand for attendance among those who reported they had had an episode of illness dur-ing the 15 days prior to the interview, and limitations on activities resulting from this episode (only the earliest episode mentioned was analyzed).
For the statistical analysis, the variables were grouped into the categories described in the Tables.
The schooling level attained by the mother or guard-ian was attributed to children aged less than 15 years. The income classification was based on the mini-mum salary in force at that time (R$151.00). For the work situation and pension coverage, the classifica-tion was based on the informaclassifica-tion relating to the head of the family.
The data from the questionnaires was recorded in Epi-6 and transferred to Stata 7, for the statistical analysis appropriate for clusters.
Proportions appropriate for clusters were estimated, and Pearson’s chi-squared test was utilized with cor-rection using Satterwaite’s approximation and trans-formation into F distribution, as recommended in the Stata 7 program. Through this, it was sought to analyze the differences in the distribution of the “factor” vari-ables, or in other words, the sociodemographic and morbidity variables reported in the two samples. This same method was utilized in univariate analysis of the distribution of the “outcome” variables of serv-ice utilization or demand for attendance, according to the sociodemographic variables and reported mor-bid conditions reported, for each sample. Multivari-ate analysis of the “outcome” variables in each sam-ple, adjusted for the sociodemographic variables and morbid conditions, was performed by means of Poisson’s regression for clusters.6 The prevalence
ra-tio, 95% confidence intervals and significance level of the associations were estimated. In the multivari-ate analysis, the sample in question was first selected (area covered by the FHP, or not covered by it), and then the outcome variable being studied was put into the model along with the potential confounding vari-ables (sex, age, reported morbid conditions and indi-cators of socioeconomic conditions that presented p<0.20 in the univariate analysis).
RESU LTS
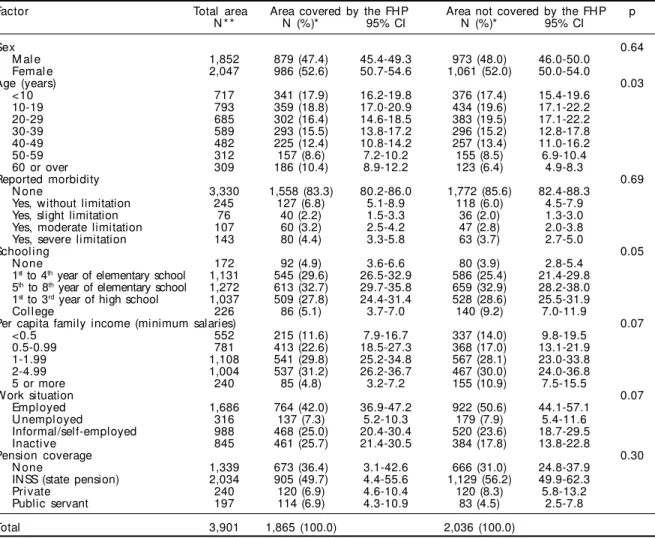
Table 1 describes the distribution of the variables investigated, in the two samples. It can be seen that there were no significant differences between the sam-ples with regard to sex (p=0.64), morbidity/limitation on activities (p=0.69), or pension coverage (p=0.30). There were no significant differences between the sam-ples in relation to schooling (p=0.05), income (p=0.07) or work situation (p=0.07). Nonetheless, it can be seen that the area covered by the FHP presents lower pro-portions of individuals with higher levels of educa-tion (5.1%), individuals with per capita family income of more than five minimum salaries (4.8%) and
" Rev Saúde Pública 2005;39(1) www.fsp.usp.br/rsp
Utilization of Family Health Program Goldbaum M et al
ployed individuals (42.0%), and a higher proportion of inactive individuals (25.7%). These same propor-tions in the area not covered by the FHP were 9.2%, 10.9%, 50.6% and 17.8%, respectively. There was, however, a significant difference in the age distribu-tion (p=0.03), such that the area covered by the FHP had a greater proportion of elderly people (10.4%) than did the area not covered (6.4%). It can also be seen that there was a very low loss of information, which was greatest in relation to income (216/3,901 =5.54%).
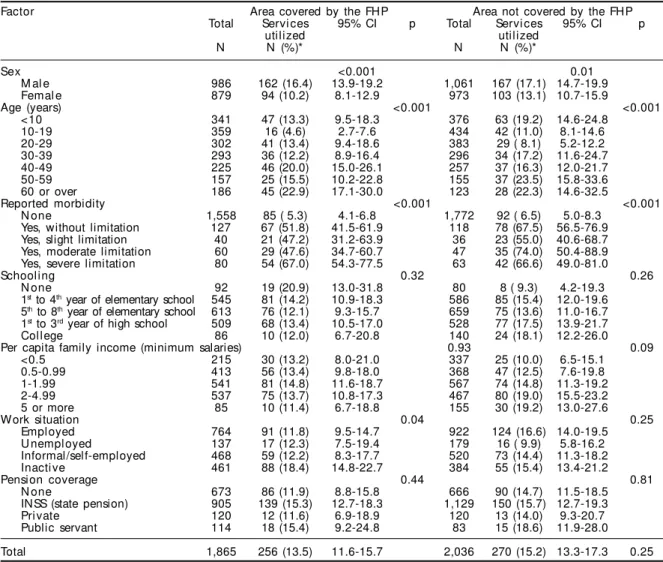
In Table 2, it can be seen that the distribution of service utilization in the area covered by the FHP presented significant differences according to sex (females =16.4% and males =10.2%; p<0.001), age (for example, 10-19 years =4.6% and over 60 years =22.9%; for all categories, p<0.001), morbidity (p<0.001), and work situation (for example, em-ployed individuals =11.8% and inactive individu-als =18.4%; for all categories, p=0.04). In the area covered by the FHP, no significant differences were
observed in relation to schooling (p=0.32), income (p=0.93), or pension coverage (p=0.44). In the area not covered by the FHP, the distribution of service utilization also presented significant differences according to sex (females =17.1% and males =13.1%; p=0.01), age (for example, 20-29 years =8.1% and 50-59 years =23.5%; for all categories, p<0.001) and morbidity (p<0.001). However, no sig-nificant differences were observed in relation to work situation (p=0.25), schooling (p=0.26), income (p=0.09) or pension coverage (p=0.81). Comparing the totals for the areas, the service utilization was not significantly different: 15.2% in the area not covered and 13.5% in the area covered (p=0.25).
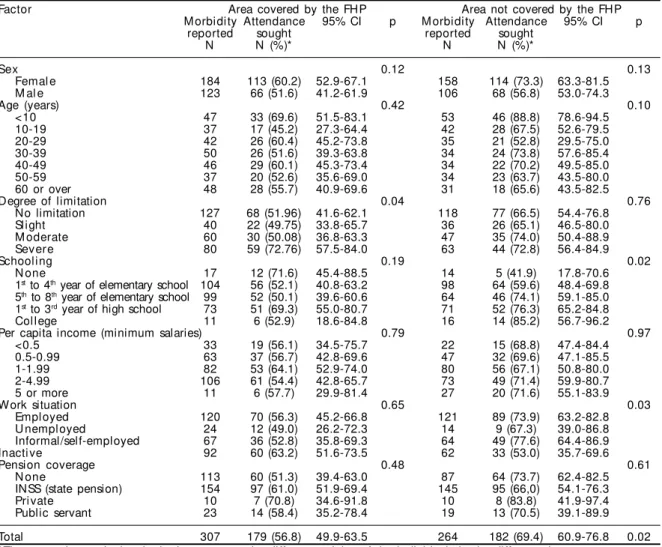
In Table 3, it can be seen that the demand for attend-ance in the area covered by the FHP presented signifi-cant differences in relation to the degree of limitation on activities resulting from morbidity (for example, 49.75% for slight limitation and 72.76% for severe limi-tation; for all categories, p=0.04). In the area covered by
Table 1 - Distribution of sociodemographic variables and reported morbidity according to the coverage of the Family Health Program (Qualis). Vila Nova Cachoeirinha and Vila Curuçá, São Paulo, 2001.
Factor Total area Area covered by the FHP Area not covered by the FHP p
N * * N (%)* 95% CI N (%)* 95% CI
Sex 0.64
M al e 1,852 879 (47.4) 45.4-49.3 973 (48.0) 46.0-50.0
Femal e 2,047 986 (52.6) 50.7-54.6 1,061 (52.0) 50.0-54.0
Age (years) 0.03
<10 717 341 (17.9) 16.2-19.8 376 (17.4) 15.4-19.6
10-19 793 359 (18.8) 17.0-20.9 434 (19.6) 17.1-22.2
20-29 685 302 (16.4) 14.6-18.5 383 (19.5) 17.1-22.2
30-39 589 293 (15.5) 13.8-17.2 296 (15.2) 12.8-17.8
40-49 482 225 (12.4) 10.8-14.2 257 (13.4) 11.0-16.2
50-59 312 157 (8.6) 7.2-10.2 155 (8.5) 6.9-10.4
60 or over 309 186 (10.4) 8.9-12.2 123 (6.4) 4.9-8.3
Reported morbidity 0.69
N one 3,330 1,558 (83.3) 80.2-86.0 1,772 (85.6) 82.4-88.3
Yes, without limitation 245 127 (6.8) 5.1-8.9 118 (6.0) 4.5-7.9
Yes, slight limitation 76 40 (2.2) 1.5-3.3 36 (2.0) 1.3-3.0
Yes, moderate limitation 107 60 (3.2) 2.5-4.2 47 (2.8) 2.0-3.8
Yes, severe limitation 143 80 (4.4) 3.3-5.8 63 (3.7) 2.7-5.0
Schooling 0.05
N one 172 92 (4.9) 3.6-6.6 80 (3.9) 2.8-5.4
1st to 4th year of elementary school 1,131 545 (29.6) 26.5-32.9 586 (25.4) 21.4-29.8 5th to 8th year of elementary school 1,272 613 (32.7) 29.7-35.8 659 (32.9) 28.2-38.0 1st to 3rd year of high school 1,037 509 (27.8) 24.4-31.4 528 (28.6) 25.5-31.9
Col l ege 226 86 (5.1) 3.7-7.0 140 (9.2) 7.0-11.9
Per capita family income (minimum salaries) 0.07
<0.5 552 215 (11.6) 7.9-16.7 337 (14.0) 9.8-19.5
0.5-0.99 781 413 (22.6) 18.5-27.3 368 (17.0) 13.1-21.9
1-1.99 1,108 541 (29.8) 25.2-34.8 567 (28.1) 23.0-33.8
2-4.99 1,004 537 (31.2) 26.2-36.7 467 (30.0) 24.0-36.8
5 or more 240 85 (4.8) 3.2-7.2 155 (10.9) 7.5-15.5
Work situation 0.07
Empl oyed 1,686 764 (42.0) 36.9-47.2 922 (50.6) 44.1-57.1
U nempl oyed 316 137 (7.3) 5.2-10.3 179 (7.9) 5.4-11.6
Informal/self-employed 988 468 (25.0) 20.4-30.4 520 (23.6) 18.7-29.5
Inacti ve 845 461 (25.7) 21.4-30.5 384 (17.8) 13.8-22.8
Pension coverage 0.30
N one 1,339 673 (36.4) 3.1-42.6 666 (31.0) 24.8-37.9
INSS (state pension) 2,034 905 (49.7) 4.4-55.6 1,129 (56.2) 49.9-62.3
Pri vate 240 120 (6.9) 4.6-10.4 120 (8.3) 5.8-13.2
Public servant 197 114 (6.9) 4.3-10.9 83 (4.5) 2.5-7.8
Total 3,901 1,865 (100.0) 2,036 (100.0)
*The proportions calculated take into account the different weights of the individuals in the different clusters
**Numbers of individuals for whom no data was available in relation to sex =2; age =14; schooling =63; income =216; work situation =66; pension coverage =91
#
Rev Saúde Pública 2005;39(1) www.fsp.usp.br/rsp
Utilization of Family Health Program Goldbaum M et al
the FHP, there were no significant differences in the dis-tribution of the demand for attendance, in relation to sex (p=0.12), age (p=0.42), schooling (p=0.19), income (p=0.79), work situation (p=0.65) or pension coverage (p=0.48). In the area not covered by the FHP, significant differences were seen in the distribution of the demand for attendance with regard to schooling (for example, none =41.9% and college-level =85.2%; for all catego-ries, p=0.02) and work situation (for example, inactive individuals =53.0% and informal/self-employed =77.6%; for all categories, p=0.03). On the other hand, no significant differences were seen regarding sex (p=0.13), age (p=0.10), degree of limitation (p=0.76), income (p=0.97) or pension coverage (p=0.61). Com-paring the total for the areas, the demand for attendance was significantly different: 56.8% in the area covered and 69.4% in the area not covered (p=0.02).
Tables 4 and 5 describe the results from the multi-variate analysis, i.e. associations between the vari-ables of outcome and each factor investigated, after
adjustment for potential confounding variables, within each area studied.
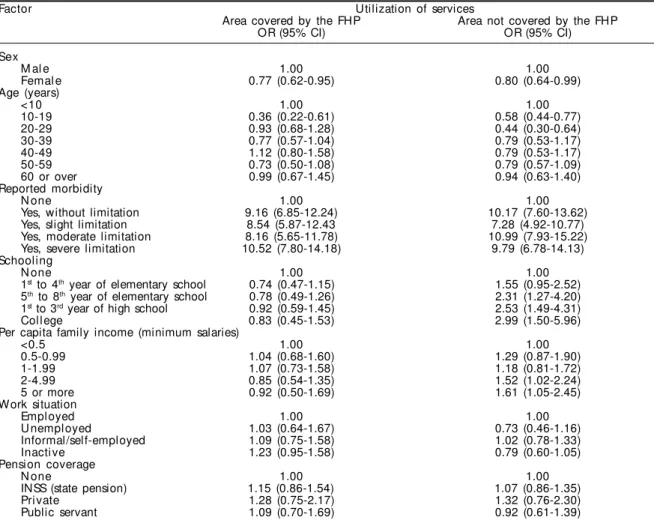
In Table 4, it can be seen in relation to service utili-zation that, in the area covered by the FHP, there were significantly lower prevalence ratios for the male sex (PR=0.77) and for the age range of 10 to 19 years (PR=0.36), and significantly greater prevalence ra-tios for those who presented morbidity with some degree of limitation. No significantly different preva-lence ratios regarding schooling, income, work situa-tion and pension coverage were observed. In the area not covered by the FHP, there was also a lower preva-lence ratio for the male sex (PR=0.80) and a greater prevalence ratio for morbidity with some degree of limitation. It was, however, noted that with regard to age there were lower prevalence ratios for the catego-ries of 10-19 years (PR=0.58) and 20-29 years (PR=0.44). For schooling there were greater preva-lence ratios for the categories of 5th to 8th grade
(PR=2.31), high school (PR=2.53) and college edu-Table 2 - Utilization of healthcare services during the 15 days preceding the interview, according to factors investigated within the Family Health Program (Qualis). Vila Nova Cachoeirinha and Vila Curuçá, São Paulo, 2001.
Factor Area covered by the FHP Area not covered by the FHP
Total Servi ces 95% CI p Total Servi ces 95% CI p
utilized utilized
N N (%)* N N (%)*
Sex <0.001 0.01
M al e 986 162 (16.4) 13.9-19.2 1,061 167 (17.1) 14.7-19.9
Femal e 879 94 (10.2) 8.1-12.9 973 103 (13.1) 10.7-15.9
Age (years) <0.001 <0.001
<10 341 47 (13.3) 9.5-18.3 376 63 (19.2) 14.6-24.8
10-19 359 16 (4.6) 2.7-7.6 434 42 (11.0) 8.1-14.6
20-29 302 41 (13.4) 9.4-18.6 383 29 ( 8.1) 5.2-12.2
30-39 293 36 (12.2) 8.9-16.4 296 34 (17.2) 11.6-24.7
40-49 225 46 (20.0) 15.0-26.1 257 37 (16.3) 12.0-21.7
50-59 157 25 (15.5) 10.2-22.8 155 37 (23.5) 15.8-33.6
60 or over 186 45 (22.9) 17.1-30.0 123 28 (22.3) 14.6-32.5
Reported morbidity <0.001 <0.001
N one 1,558 85 ( 5.3) 4.1-6.8 1,772 92 ( 6.5) 5.0-8.3
Yes, without limitation 127 67 (51.8) 41.5-61.9 118 78 (67.5) 56.5-76.9
Yes, slight limitation 40 21 (47.2) 31.2-63.9 36 23 (55.0) 40.6-68.7
Yes, moderate limitation 60 29 (47.6) 34.7-60.7 47 35 (74.0) 50.4-88.9
Yes, severe limitation 80 54 (67.0) 54.3-77.5 63 42 (66.6) 49.0-81.0
Schooling 0.32 0.26
N one 92 19 (20.9) 13.0-31.8 80 8 ( 9.3) 4.2-19.3
1st to 4th year of elementary school 545 81 (14.2) 10.9-18.3 586 85 (15.4) 12.0-19.6 5th to 8th year of elementary school 613 76 (12.1) 9.3-15.7 659 75 (13.6) 11.0-16.7 1st to 3rd year of high school 509 68 (13.4) 10.5-17.0 528 77 (17.5) 13.9-21.7
Col l ege 86 10 (12.0) 6.7-20.8 140 24 (18.1) 12.2-26.0
Per capita family income (minimum salaries) 0.93 0.09
<0.5 215 30 (13.2) 8.0-21.0 337 25 (10.0) 6.5-15.1
0.5-0.99 413 56 (13.4) 9.8-18.0 368 47 (12.5) 7.6-19.8
1-1.99 541 81 (14.8) 11.6-18.7 567 74 (14.8) 11.3-19.2
2-4.99 537 75 (13.7) 10.8-17.3 467 80 (19.0) 15.5-23.2
5 or more 85 10 (11.4) 6.7-18.8 155 30 (19.2) 13.0-27.6
Work situation 0.04 0.25
Empl oyed 764 91 (11.8) 9.5-14.7 922 124 (16.6) 14.0-19.5
U nempl oyed 137 17 (12.3) 7.5-19.4 179 16 ( 9.9) 5.8-16.2
Informal/self-employed 468 59 (12.2) 8.3-17.7 520 73 (14.4) 11.3-18.2
Inacti ve 461 88 (18.4) 14.8-22.7 384 55 (15.4) 13.4-21.2
Pension coverage 0.44 0.81
N one 673 86 (11.9) 8.8-15.8 666 90 (14.7) 11.5-18.5
INSS (state pension) 905 139 (15.3) 12.7-18.3 1,129 150 (15.7) 12.7-19.3
Pri vate 120 12 (11.6) 6.9-18.9 120 13 (14.0) 9.3-20.7
Public servant 114 18 (15.4) 9.2-24.8 83 15 (18.6) 11.9-28.0
Total 1,865 256 (13.5) 11.6-15.7 2,036 270 (15.2) 13.3-17.3 0.25
$ Rev Saúde Pública 2005;39(1) www.fsp.usp.br/rsp
Utilization of Family Health Program Goldbaum M et al
cation (PR=2.99), with a significant linear trend (p<0.001). For income, there were greater prevalence ratios for the categories of 2-4.99 minimum salaries (PR=1.52) and >5 minimum salaries (PR=1.61), also with a significant linear trend (p=0.036).
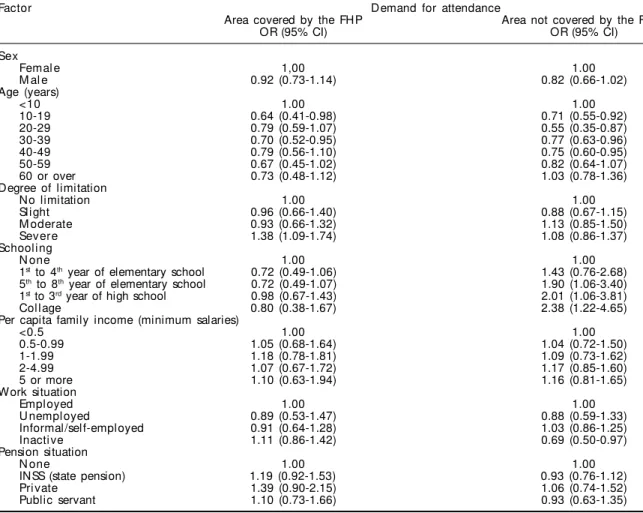
In Table 5, with regard to the demand for attendance among those who reported episodes of illness, it can be seen that, in the area covered by the FHP, there was a significantly lower prevalence ratio for the ages of 10-19 years (PR=0.64), and a greater prevalence ratio for a severe degree of limitation (PR=1.38). No significantly different prevalence ratios were observed for sex, school-ing, income, work situation and pension coverage. In the area not covered by the FHP, significantly lower prevalence ratios were observed for the ages of 10-19 years (PR=0.71), 20-29 years (PR=0.55), 30-39 years (PR=0.77) and 40-49 years (PR=0.75), and also for inac-tive individuals (PR=0.69). Higher prevalence ratios were observed for schooling, in the categories of 5th to
8th grade (PR=1.90), high school (PR=2.01) and college
education (PR=2.38). These latter categories also pre-sented a significant linear trend (p=0.001).
D ISCU SSIO N
Various cross-sectional analyses are possible in examining the question of access to and utilization of healthcare services. The present study gave prior-ity to two fundamental aspects of this: the utilization of services and demand for attendance among those who reported some episode of illness. Both aspects related to the 15 days preceding the interview. The utilization of services was considered to be any pre-ventive or curative motive or type of service pro-vided that would translate the user-provider relation-ship in a broader sense. The demand for attendance, among the individuals who reported some episode of illness, brought into evidence how this relationship was reconciled with specific situations. In such cases, certain needs were established, thereby generating the seeking of healthcare attendance, in which there Table 3 - Demand for attendance during the 15 days preceding the interview, among the individuals who mentioned episodes of illness, according to factors investigated within the Family Health Program (Q ualis). Vila Nova Cachoeirinha and Vila Curuçá, São Paulo, 2001.
Factor Area covered by the FHP Area not covered by the FHP
M orbidity Attendance 95% CI p M orbidity Attendance 95% CI p
reported sought reported sought
N N (%)* N N (%)*
Sex 0.12 0.13
Femal e 184 113 (60.2) 52.9-67.1 158 114 (73.3) 63.3-81.5
M al e 123 66 (51.6) 41.2-61.9 106 68 (56.8) 53.0-74.3
Age (years) 0.42 0.10
<10 47 33 (69.6) 51.5-83.1 53 46 (88.8) 78.6-94.5
10-19 37 17 (45.2) 27.3-64.4 42 28 (67.5) 52.6-79.5
20-29 42 26 (60.4) 45.2-73.8 35 21 (52.8) 29.5-75.0
30-39 50 26 (51.6) 39.3-63.8 34 24 (73.8) 57.6-85.4
40-49 46 29 (60.1) 45.3-73.4 34 22 (70.2) 49.5-85.0
50-59 37 20 (52.6) 35.6-69.0 34 23 (63.7) 43.5-80.0
60 or over 48 28 (55.7) 40.9-69.6 31 18 (65.6) 43.5-82.5
Degree of limitation 0.04 0.76
No limitation 127 68 (51.96) 41.6-62.1 118 77 (66.5) 54.4-76.8
Slight 40 22 (49.75) 33.8-65.7 36 26 (65.1) 46.5-80.0
M oderate 60 30 (50.08) 36.8-63.3 47 35 (74.0) 50.4-88.9
Severe 80 59 (72.76) 57.5-84.0 63 44 (72.8) 56.4-84.9
Schooling 0.19 0.02
N one 17 12 (71.6) 45.4-88.5 14 5 (41.9) 17.8-70.6
1st to 4th year of elementary school 104 56 (52.1) 40.8-63.2 98 64 (59.6) 48.4-69.8 5th to 8th year of elementary school 99 52 (50.1) 39.6-60.6 64 46 (74.1) 59.1-85.0 1st to 3rd year of high school 73 51 (69.3) 55.0-80.7 71 52 (76.3) 65.2-84.8
Col l ege 11 6 (52.9) 18.6-84.8 16 14 (85.2) 56.7-96.2
Per capita income (minimum salaries) 0.79 0.97
<0.5 33 19 (56.1) 34.5-75.7 22 15 (68.8) 47.4-84.4
0.5-0.99 63 37 (56.7) 42.8-69.6 47 32 (69.6) 47.1-85.5
1-1.99 82 53 (64.1) 52.9-74.0 80 56 (67.1) 50.8-80.0
2-4.99 106 61 (54.4) 42.8-65.7 73 49 (71.4) 59.9-80.7
5 or more 11 6 (57.7) 29.9-81.4 27 20 (71.6) 55.1-83.9
Work situation 0.65 0.03
Empl oyed 120 70 (56.3) 45.2-66.8 121 89 (73.9) 63.2-82.8
U nempl oyed 24 12 (49.0) 26.2-72.3 14 9 (67.3) 39.0-86.8
Informal/self-employed 67 36 (52.8) 35.8-69.3 64 49 (77.6) 64.4-86.9
Inacti ve 92 60 (63.2) 51.6-73.5 62 33 (53.0) 35.7-69.6
Pension coverage 0.48 0.61
N one 113 60 (51.3) 39.4-63.0 87 64 (73.7) 62.4-82.5
INSS (state pension) 154 97 (61.0) 51.9-69.4 145 95 (66,0) 54.1-76.3
Pri vate 10 7 (70.8) 34.6-91.8 10 8 (83.8) 41.9-97.4
Public servant 23 14 (58.4) 35.2-78.4 19 13 (70.5) 39.1-89.9
Total 307 179 (56.8) 49.9-63.5 264 182 (69.4) 60.9-76.8 0.02
%
Rev Saúde Pública 2005;39(1) www.fsp.usp.br/rsp
Utilization of Family Health Program Goldbaum M et al
were more intense and specific expectations that needed to be attended to.
In the attendance model implemented through the FHP, the organizing of the attendance and the types of professionals differed from those in the “tradi-tional” basic attendance. This could modify the utili-zation patterns or demand for healthcare services. The actions of community healthcare agents, in particu-lar, in forming the link between the home and the healthcare services, may contribute towards lower demand for services, without this necessarily signi-fying decreased access or lack of attendance. This is because the needs are possibly being attended to through the agent’s intermediation, without the indi-vidual having to go to the healthcare unit.10
The fact that the samples from the areas covered and not covered by the FHP were very similar regarding so-ciodemographic variables, with the sole exception of the age distribution, has very important significance.
The choice of the Curuçá and Nova Cachoeirinha dis-tricts for the original implementation of the FHP was made without significant sociodemographic bias. The areas studied reflect the general characteristics of the districts that they form part of, which occupy the 18th
and 19th places in the ranking of Human Development
Indices for the 31 administrative subdivisions of the city of São Paulo.7 The sampling methodology for the
present study succeeded in obtaining two samples with a high degree of comparability. Thus, the internal valid-ity (comparison between samples) and external validvalid-ity (generalization to the population studied) are strength-ened. Other positive points of the study were the low loss of information and the successful treatment of con-founding effects through the multivariate analysis.
Although the intensity of service utilization reported did not differ between the samples, its distribution ac-cording to the sociodemographic variables presented important differences. According to age, while the area not covered by the FHP presented greater utilization
Table 4 - D istribution of the utilization of healthcare services during the 15 days preceding the interview, according to factors investigated within and coverage of the Family Health Program (Qualis). Vila Nova Cachoeirinha and Vila Curuçá, São Paulo, 2001.*
Factor Utilization of services
Area covered by the FHP Area not covered by the FHP
OR (95% CI) OR (95% CI)
Sex
M al e 1.00 1.00
Femal e 0.77 (0.62-0.95) 0.80 (0.64-0.99)
Age (years)
<10 1.00 1.00
10-19 0.36 (0.22-0.61) 0.58 (0.44-0.77)
20-29 0.93 (0.68-1.28) 0.44 (0.30-0.64)
30-39 0.77 (0.57-1.04) 0.79 (0.53-1.17)
40-49 1.12 (0.80-1.58) 0.79 (0.53-1.17)
50-59 0.73 (0.50-1.08) 0.79 (0.57-1.09)
60 or over 0.99 (0.67-1.45) 0.94 (0.63-1.40)
Reported morbidity
N one 1.00 1.00
Yes, without limitation 9.16 (6.85-12.24) 10.17 (7.60-13.62)
Yes, slight limitation 8.54 (5.87-12.43 7.28 (4.92-10.77)
Yes, moderate limitation 8.16 (5.65-11.78) 10.99 (7.93-15.22)
Yes, severe limitation 10.52 (7.80-14.18) 9.79 (6.78-14.13)
Schooling
N one 1.00 1.00
1st to 4th year of elementary school 0.74 (0.47-1.15) 1.55 (0.95-2.52) 5th to 8th year of elementary school 0.78 (0.49-1.26) 2.31 (1.27-4.20)
1st to 3rd year of high school 0.92 (0.59-1.45) 2.53 (1.49-4.31)
Col l ege 0.83 (0.45-1.53) 2.99 (1.50-5.96)
Per capita family income (minimum salaries)
<0.5 1.00 1.00
0.5-0.99 1.04 (0.68-1.60) 1.29 (0.87-1.90)
1-1.99 1.07 (0.73-1.58) 1.18 (0.81-1.72)
2-4.99 0.85 (0.54-1.35) 1.52 (1.02-2.24)
5 or more 0.92 (0.50-1.69) 1.61 (1.05-2.45)
Work situation
Empl oyed 1.00 1.00
U nempl oyed 1.03 (0.64-1.67) 0.73 (0.46-1.16)
Informal/self-employed 1.09 (0.75-1.58) 1.02 (0.78-1.33)
Inacti ve 1.23 (0.95-1.58) 0.79 (0.60-1.05)
Pension coverage
N one 1.00 1.00
INSS (state pension) 1.15 (0.86-1.54) 1.07 (0.86-1.35)
Pri vate 1.28 (0.75-2.17) 1.32 (0.76-2.30)
Public servant 1.09 (0.70-1.69) 0.92 (0.61-1.39)
& Rev Saúde Pública 2005;39(1) www.fsp.usp.br/rsp
Utilization of Family Health Program Goldbaum M et al
among the youngest and oldest among the population, the area covered by the FHP presented lower utilization only for the 10-19 age group (i.e. adolescents). Accord-ing to schoolAccord-ing and income, while the area not covered by the FHP showed growing utilization among the more privileged categories, the area covered by the FHP did not present any differences between the categories. These results may indicate that one of the impacts of the pro-gram could be service utilization that is less unequal and less dependent on socioeconomic conditions, in the area covered by the FHP.
With regard to the demand for attendance among in-dividuals who reported some episode of illness, two matters need to be considered: the proportion of the demand was greater in the area not covered by the FHP, and the demand distribution according to socioeco-nomic variables differed between the two populations. With the presupposition that there is no repressed mand, it can be supposed that the lower degree of
de-mand may have occurred because of the support from the PSF team, and in particular because of the actions of the community healthcare agents. This is coherent with the observation that, in the area covered by the FHP, the demand was greater among those who reported a severe degree of limitation, a difference that did not occur in the area not covered. Furthermore, the pattern of greater demand was repeated according to age in the area not covered, with greater demand among the youngest and oldest parts of the population, while in the area covered the demand was only lower among adolescents.
According to the indicators of socioeconomic con-ditions, there was growing demand from the catego-ries with more privileged schooling in the area not covered, while such differences did not exist in the area covered. There were also differences according to work situation, with lower demand from inactive individuals in the area not covered, which did not occur in the area covered. Once again, the results seem
Table 5 - Distribution of the demand for attendance, among the individuals who presented episodes of illness during the 15 days preceding the interview, according to factors investigated within and coverage or the Family Health Program (Qualis). Vila Nova Cachoeirinha and Vila Curuçá, São Paulo, 2001.*
Factor D emand for attendance
Area covered by the FHP Area not covered by the FHP
OR (95% CI) OR (95% CI)
Sex
Femal e 1,00 1.00
M al e 0.92 (0.73-1.14) 0.82 (0.66-1.02)
Age (years)
<10 1.00 1.00
10-19 0.64 (0.41-0.98) 0.71 (0.55-0.92)
20-29 0.79 (0.59-1.07) 0.55 (0.35-0.87)
30-39 0.70 (0.52-0.95) 0.77 (0.63-0.96)
40-49 0.79 (0.56-1.10) 0.75 (0.60-0.95)
50-59 0.67 (0.45-1.02) 0.82 (0.64-1.07)
60 or over 0.73 (0.48-1.12) 1.03 (0.78-1.36)
Degree of limitation
No limitation 1.00 1.00
Slight 0.96 (0.66-1.40) 0.88 (0.67-1.15)
M oderate 0.93 (0.66-1.32) 1.13 (0.85-1.50)
Severe 1.38 (1.09-1.74) 1.08 (0.86-1.37)
Schooling
N one 1.00 1.00
1st to 4th year of elementary school 0.72 (0.49-1.06) 1.43 (0.76-2.68)
5th to 8th year of elementary school 0.72 (0.49-1.07) 1.90 (1.06-3.40)
1st to 3rd year of high school 0.98 (0.67-1.43) 2.01 (1.06-3.81)
Col l age 0.80 (0.38-1.67) 2.38 (1.22-4.65)
Per capita family income (minimum salaries)
<0.5 1.00 1.00
0.5-0.99 1.05 (0.68-1.64) 1.04 (0.72-1.50)
1-1.99 1.18 (0.78-1.81) 1.09 (0.73-1.62)
2-4.99 1.07 (0.67-1.72) 1.17 (0.85-1.60)
5 or more 1.10 (0.63-1.94) 1.16 (0.81-1.65)
Work situation
Empl oyed 1.00 1.00
U nempl oyed 0.89 (0.53-1.47) 0.88 (0.59-1.33)
Informal/self-employed 0.91 (0.64-1.28) 1.03 (0.86-1.25)
Inacti ve 1.11 (0.86-1.42) 0.69 (0.50-0.97)
Pension situation
N one 1.00 1.00
INSS (state pension) 1.19 (0.92-1.53) 0.93 (0.76-1.12)
Pri vate 1.39 (0.90-2.15) 1.06 (0.74-1.52)
Public servant 1.10 (0.73-1.66) 0.93 (0.63-1.35)
'
Rev Saúde Pública 2005;39(1) www.fsp.usp.br/rsp
Utilization of Family Health Program Goldbaum M et al
to indicate that one of the impacts of the program has been a distribution of healthcare attendance that has lower dependence on the socioeconomic conditions of the area covered and, importantly, higher depend-ence on the degree of need (morbidity).
The results from the present study have confirmed the inequalities in the utilization of healthcare serv-ices described in the literature in relation to sex, age, schooling and income, and in the demand for attend-ance according to age, schooling and work situation. Nevertheless, these inequalities are smaller in the area covered by the FHP, which demonstrates coherence with the objective of program relating to the promo-tion of horizontal equity. Inequality in the utilizapromo-tion of services in the situation of morbidity reported within the last 15 days was confirmed, with greater inequality in the demand for services in the area covered and in accordance with the degree of severity. This is coher-ent with the objective relating to vertical equity.
These findings indicate that a certain level of access to and utilization of healthcare services among the popu-lation living in the poorer areas of the municipality of São Paulo does exist, even in the areas not covered by
REFEREN CES
1. Braveman P. Monitoring equity in health: a policy-oriented approach in low- and middle-income countries. Geneva; WHO; 1998. (Equity Initiative Document, 3).
2. Cesar CLG, Figueiredo GM, Westphal MF, Cardoso MRA, Costa MZ, Gattás VL. Morbidade referida e utilização de serviços de saúde em localidades urbanas brasileiras: metodologia. Rev Saúde Pública 1996;30:153-60.
3. Culyier AJ. Health, health expenditures, and equity. In: Van Doorslaer E, Wagstaff A, Rutten F. Equity in finance and delivery of health care: an international perspective. Oxford: Oxford University Press; 1993.
4. D epartment of H ealth and H uman Services/D H H S. National health care disparities report. Rockville MD: 2003. Available from: URL: http://
www.proadess.cict.fiocruz.br [2004 M ai 25].
5. Marques RM, Mendes A. Atenção Básica e Programa de Saúde da Família (PSF): novos rumos para a política de saúde e seu financiamento. Ciênc Saúde Coletiva 2003;8:403-15.
6. Mendoza-Sassi R, Béria JU, Barros AJD. Fatores associados à utilização de serviços ambulatoriais: estudo de base populacional. Rev Saúde Pública 2003;37:372-8.
7. Pedroso M. Desenvolvimento humano no município de São Paulo [dissertação de mestrado]. São Paulo: PUC/SP; 2003.
8. Santana ML, Carmagnani MI. Programa de saúde da família no Brasil: um enfoque sobre seus pressupostos básicos, operacionalização e vantagens. Saúde Soc 2001;10:33-54.
9. Sawyer DO, Leite IC, Alexandrino R. Perfis de utilização de serviços de saúde no Brasil. Ciênc Saúde Coletiva 2002;7:757-76.
10. Silva JA, Dalmaso ASW. Agentes comunitários de saúde: o ser, o saber, o fazer. Rio de Janeiro: Fiocruz; 2002.
11. Silva NN, Pedroso GC, Puccini RF, Furlani WJ. Desigualdades sociais e uso de serviços de saúde: evidências de análise estratificada. Rev Saúde Pública 2000;34:44-9.
12 Travassos C, Viacava F, Fernandes C, Almeida CM. Desigualdades geográficas e sociais na utilização de serviços de saúde no Brasil. Ciênc Saúde Coletiva 2000;5:133-49.
13. Van Doorslaer E, Wagstaff A, Rutten F. Equity in finance and delivery of health care: an international perspective. Oxford: Oxford University Press; 1993.
14. Zucchi P, Del Nero C, Malik AM. Gastos em saúde: os fatores que agem na demanda e na oferta dos serviços de saúde. Saúde Soc 2000;9:127-50. the FHP. However, in such areas, the presence of the FHP has been shown to be capable of diminishing the effect of the unequal social conditions (as measured via the variables selected), on the access and utilization profile that exists there, with improvement in the social equity in this respect. The present study was not aimed at meas-uring the social iniquity by reference to an ideal service consumption pattern, or a pattern that would be needed for there to be an impact on healthcare conditions. Rather, it has sought to identify the difference that the FHP, when effectively implemented (as in the cases stud-ied here), may make to the access and utilization profile of healthcare services among a population with these living conditions. This type of study is of great impor-tance for better comprehension of the results and im-pacts that are possible through the implementation of the FHP, which may be distinct, depending on the liv-ing conditions and access to healthcare service among the target population.
ACKN O W LED GEM EN TS