1Universidade de São Paulo, Faculdade de Medicina de Ribeirão Preto, Laboratório de Nutrição e Metabolismo. Av. Bandeirantes,
3900, 14049-900, Ribeirão Preto, SP, Brasil. Correspondence to/Correspondência para: AA JORDÃO. E-mail: <[email protected]>.
2Universidade de Londrina, Faculdade de Educação Física e Esporte, Departamento de Educação Física. Londrina, PR, Brasil.
Bioelectrical impedance analysis and
anthropometry for the determination of
body composition in rats: effects of
high-fat and high-sucrose diets
Bioimpedância elétrica e antropometria na
determinação da composição corporal
de ratos: efeitos das dietas ricas
em lipídeos e sacarose
Larissa Rodrigues Neto ANGÉLOCO1
Rafael DEMINICE1,2
Izabel de Arruda LEME1
Renata Cristina LATARO1
Alceu Afonso JORDÃO1
A B S T R A C T
Objective
The aim of the present study was to determine the impedance of Wistar rats treated with high-fat and high-sucrose diets and correlate their biochemical and anthropometric parameters with chemical analysis of the carcass.
Methods
Twenty-four male Wistar rats were fed a standard (AIN-93), high-fat (50% fat) or high-sucrose (59% of sucrose) diet for 4 weeks. Abdominal and thoracic circumference and body length were measured. Bioelectrical impedance analysis was used to determine resistance and reactance. Final body composition was determined by chemical analysis.
Results
or bioelectrical impedance analysis variables. Anthropometric and bioelectrical impedance analysis changes were not observed in the High-Sucrose group. However, a positive association was found between body fat and three anthropometric variables: body mass index, Lee index and abdominal circumference.
Conclusion
Bioelectrical impedance analysis did not prove to be sensitive for detecting changes in body composition, but body mass index, Lee index and abdominal circumference can be used for estimating the body composition of rats.
Indexing terms: Anthropometry. Bioelectrical impedance analysis. Diet. Rats.
R E S U M O
Objetivo
Determinar a impedância de ratos tratados com dietas ricas em lipídeos e sacarose por meio do método da bioimpedância elétrica e correlacionar com a análise direta da carcaça, os parâmetros bioquímicos e antropométricos.
Métodos
Foram utilizados 24 ratos machos (Wistar), os quais foram alimentados com dieta padrão, rica em lipídeos ou rica em sacarose por 4 semanas. O grupo-controle recebeu dieta padrão AIN-93; o hiperlipídico, dieta contendo 50% de lipídeos, dos quais 70% eram gordura saturada; e o grupo com rico em sacarose foi alimentado com maior proporção de carboidratos simples, sem alteração na quantidade total.
Resultados
A maior ingestão de lipídeos levou a um aumento da porcentagem de gordura hepática e de colesterol e reduziu a quantidade de água corporal total no grupo hiperlipídico, contudo essas alterações no perfil bioquímico não se refletiram em mudanças antropométricas ou alterações nos parâmetros da bioimpedância elétrica. Mudanças na antropometria e bioimpedância elétrica não foram observadas no grupo com rico em sacarose. No entanto, uma associação positiva foi observada entre a gordura da carcaça e três parâmetros antropométricos, ou seja, índice de massa corporal, índice de Lee e circunferência abdominal.
Conclusão
A impedância bioelétrica não se mostrou sensível em detectar mudanças na composição corporal, entretanto observou-se que parâmetros antropométricos - índice de massa corporal, índice de Lee e circunferência do abdômen - podem ser utilizados para estimar a composição corporal em ratos.
Termos de indexação: Antropometria. Bioimpedância elétrica. Dieta. Ratos.
I N T R O D U C T I O N
Body composition is usually assessed for determining body component deficiencies or excesses, such as lean mass and fat mass, which allow an understanding of nutritional status1. The great importance of this assessment is that body weight alone does not reflect if there is too much or too little of these body components, which may hazardous2. In addition, changes in body composition may have an impact on metabolism, since adipose tissue modulates lipid and glucose homeostasis3.
Accurate methods for determining the body composition of animals are extremely
important for understanding how the body responds to nutrient intake, and for nutritional and physiological studies4,5 that use animal models to investigate the effects of obesity and nutrient deficiencies6,7.
In an attempt to overcome the disadvantages of direct chemical analysis of the carcass, indirect techniques have been used for determining the body composition of animals8. Interest in Bioelectrical Impedance (BIA) has increased recently since it is a noninvasive, inexpensive, fast and reproducible method9 that provides a good estimate of body composition10. Moreover, it can be used repeatedly on the same animal causing minimal disturbance1,11. However, estimation accuracy will depend on the equation used and standardization of the test conditions12.
Since Bioelectrical Impedance is based on the principle that tissues have different impedances, that is, opposition to the flow of an electric current, which in turn is dependent on water and electrolyte content,13 and assuming that the fat-free mass has a constant water content and resistivity, Total Body Water (TBW) and Fat-Free Mass (FFM) can be estimated by measuring the electrical impedance of the body14.
Studies considering this information for the use of BIA in animals have shown that BIA can be used for predicting the total body water of animals, but there are no specific formulas that distinguish lean from fat mass1,11,15. Furthermore, few studies have used this method in rats and no study has investigated whether diet affects body composition and whether BIA would be capable of detecting subtle changes.
More studies using BIA on live animals are necessary to determine if this technique can determine rats’ body composition accurately and if diet affects the body composition of experimental animals.
The objective of the present study was to determine the impedance of Wistar rats fed high-fat and high-sucrose diets by BIA and to verify if the results correlate with those obtained by direct chemical analysis of the carcass and biochemical and anthropometric measurements.
M E T H O D S
Animals and treatment
The study included 24 male Wistar rats with an initial mean weight of 65g, obtained from the Central Animal Facility of Ribeirão Preto School of Medicine, Universidade de São Paulo (FMRP/ USP). The project was approved by the FMRP/USP Ethics Committee on Animal Research, protocol number 147/2008. The animals were housed in individual cages under an alternating 12-hour light/dark cycle, mean temperature of 22ºC, and free access to food and water.
The animals were allowed to adapt to the experimental conditions for one week, all of them receiving the standard AIN-93 diet. They were then divided randomly into 3 groups: Control group (C): group fed the standard diet AIN-93 (n=8); High-Fat group (HF): group fed a high-fat diet (n=8); and High-Sucrose group (HS): group fed a diet with a different type of carbohydrate (n=8).
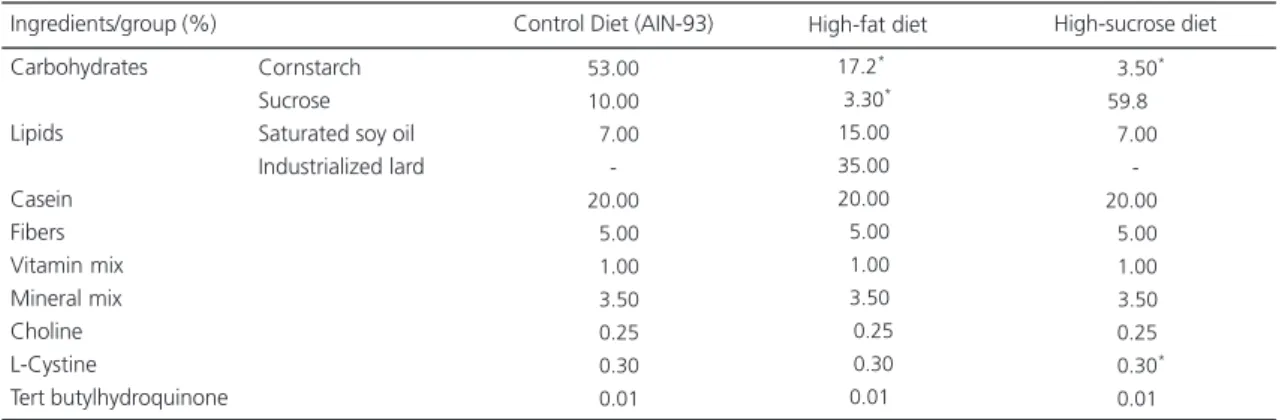
The control group was given the standard AIN-93 diet16, and the high-fat group was given a HF diet containing 15% fat, adapted from Reeves et al.16, as described in Table 117. Fats in the control diet originated exclusively from soybean oil and in the HF diet, from rendered lard (70.00%) and soybean oil (30.00%). The HS diet had a different carbohydrate composition, that is, more simple carbohydrates: while the control diet contained mainly cornstarch, the HS diet contained 3.50% cornstarch and 59.85% sucrose18 (Table 1).
The animals were weighed once a week by a Filizola® electronic scale with a capacity of 1,500 grams and accuracy of 1 gram. Food intake was monitored by weighing the feeders three times a week over the study period.
Anthropometric measurements
Body length was measured from the nostril to the base of the tail (pelvic-caudal junction); abdominal circumference at the point immediately anterior to the forefoot; and chest circumference at the site immediately behind the foreleg19. The rats were anaesthetized with 2% tribromoethanol for the measurements.
A non-elastic tape measure was used for all measurements.
BMI was determined by dividing the animal’s weight (g) by the square of its length (cm). The Lee index was determined by dividing the cube root of the body weight (g) by the nose-to-anus length (cm)20.
Bioelectrical impedance
Whole Body Resistance (WBR) and Reactance (WBXc) were measured by a phase-sensitive tetrapolar bioelectrical impedance analyzer (Byodinamics BIA 310E). Standard hypodermic needles were used as electrodes. The rats were anesthetized and put on their stomachs on a non-conductive surface to eliminate interference from electrical induction. The dorsal surfaces of the head and body were shaved for placement of the needle electrodes. Source electrode 1 was placed on the midline on the anterior margin of the orbit and source electrode
2 was placed 4cm from the base of the tail. Detector electrode 1 was placed on the anterior opening of the ear and detector electrode 2 was placed in the median region of the pelvis1. All impedance measurements were done in well fed and hydrated animals.
Total body water (WTBW, g) was estimated by the empirical formula given by Hall et al.1: WTBW = 15.47 + 97.44 L2/ WBR, where L is the length of the body (cm) and WBR is the total body resistance (:) according to BIA.
Laboratory methods
Biochemical analyses
Hepatic fat was determined as suggested by Bligh & Dyer21. Total serum cholesterol and protein, and blood glucose were determined by colorimetric reactions, using the LABTEST® enzyme kit.
Direct chemical analysis of the carcass
At the end of the four-week intervention, the animals were sacrificed by decapitation and frozen until chemical analysis of the carcass. Skin, viscera, head and feet were discarded, using only bones and muscles for quantitative water, fat and protein analysis22. Water content was determined by placing the empty carcasses individually in
Table 1. Composition of the experimental diets. Ribeirão Preto (SP, Brazil), 2010.
Carbohydrates
Lipids
Casein Fibers Vitamin mix Mineral mix Choline L-Cystine
Tert butylhydroquinone Ingredients/group (%)
Cornstarch Sucrose Saturated soy oil Industrialized lard
Control Diet (AIN-93)
53.00 10.00
07.00 -20.00
05.00
01.00
03.50
00.25
00.30
00.01
High-fat diet
17.2*0
03.30*0
15.00* 35.00* 20.00*
05.00*
01.00*
03.50*
00.25
00.30
00.01*
High-sucrose diet
03.50*
59.80*
07.00* -20.00*
05.00*
01.00*
03.50*
00.25*
00.30*
00.01*
aluminum sheets in an oven at 105ºC for 24 hours. The amount of water present in the carcass was calculated by subtracting the dry carcass weight from the baseline carcass weight. The dry carcasses were then macerated and the fat extracted by intermittent extraction using petroleum ether and a Soxhlet extractor. Carcass fat was calculated by the difference in weight. The protein content was calculated by the micro-Kjeldahl method23, an indirect nitrogen determination method, using the 6.25 factor for conversion to protein. All analyses were repeated three times at the FMRP/USP Nutrition and Metabolism Laboratory.
Statistical analysis
Data are expressed as Means (M) and Standard Deviation (SD). Analysis of Variance (ANOVA) followed by the Tukey post-hoc test
were used for investigating possible differences in the study parameters, and linear regression for investigating possible correlations between the study variables. The significance level was set at 5% (p<0.05) for all analyses.
R E S U L T S
Table 2 shows the weightand food intake of the groups. The HF group consumed significantly less food (g/week) than groups C and HS, but the groups did not differ with respect to energy intake (kcal/week). All animals had similar baseline and final weights, and weight gain during the intervention.
The HF group had significantly higher hepatic fat content and serum cholesterol level than group C. Meanwhile, the HS group had significantly higher blood glucose level than the
Table 2.Comparison of final weight, weight gain and food and energy intake among the study groups. Ribeirão Preto (SP, Brazil), 2010.
Final weight (g) Weight gain (g) Food intake (g/week) Energy intake (kcal/week) Fat intake (g/week) Sucrose intake (g/week)
290.1 229.3
040.8 161.1
002.8
004.1
18.3a
16.7 a
12.7a
50.3 a
01.2a
01.4a
M SD
C
269.1 204.5
027.5 168.6
013.7
000.9
55.8a
52.7a
06.5b
39.9a
03.4b
00.1b
M SD
HF
302.6 240.1
042.0 166.4
002.9
025.1
04.7a
31.9a
08.8a
35.0a
01.2a
05.3C
M SD
HS
C: Control group; HF: High-Fat group/ HS: High-Sucrose group; Mean values; M: Media; SD: Standard Deviation; followed by different letters indicate a significant difference for p<0,05.
Table 3. Body composition of the rats studied evaluated by direct chemical analysis of the carcass after 4 weeks of the experiment.
Ribeirão Preto (SP, Brazil), 2010.
Total body water (g) %
Fat-free mass (g) %
Protein (g) % Body fat (g) %
M=80.1; SD=12.3a
50.8a
M=147.7; SD=1.2a
90.6a
M=52.8; SD=9.7a
33.6a
M=14.9; SD=1.9a
9.4a
C HF
M=69.7; SD=12.1b
43.9a
M=147.4; SD=0.9a
90.4a
M=41.7; SD=5.9b
26.6a
M=15.4; SD=3.0a
9.6a
HS
M=82.7; SD=11.7a
51.2a
M=146.4; SD=1.4a
89.8a
M=51.2; SD=8.5a
31.7a
M=16.4; SD=1.8a
10.2a
HF group. Group HF had significantly less total protein than groups C and HS.
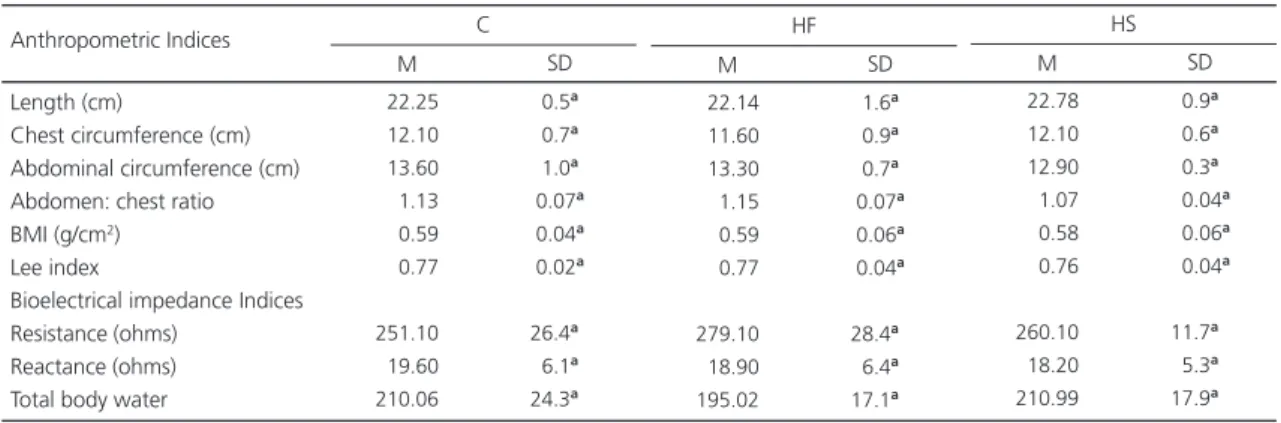
Table 3 shows the circumferences, BMI and Lee index of the animals. These variables did not differ significantly among the groups, nor did resistance or reactance Table 4.
Table 5 shows the composition of the carcasses determined by direct chemical analysis. Only TBW and protein differed significantly among the groups (p<0.05): they were lower in the HF group than in the C and HS groups.
Figure 1 shows the positive correlations found between carcass fat and BMI, Lee index and abdominal circumference. A negative correlation (p<0.05) was found between carcass fat and reactance (r=-0.51). However, no correlation was found between carcass fat and resistance determined by BIA.
D I S C U S S I O N
The effects of different macronutrient intakes have been extensively studied in laboratory animals. However, little information is available about the effect of different macronutrient intakes on the body composition and anthropometric variables of rodents in general. Also, little is known about the validity of these methods for the anthropometric assessment of these animals.
Table 4.Anthropometric and bioelectrical impedance analysisindices. Ribeirão Preto (SP, Brazil), 2010.
Length (cm)
Chest circumference (cm) Abdominal circumference (cm) Abdomen: chest ratio BMI (g/cm2)
Lee index
Bioelectrical impedance Indices Resistance (ohms)
Reactance (ohms) Total body water Anthropometric Indices
C: Control group; HF: High-Fat group; HS: High-Sucrose group. Values are reported as M: Means and SD: Standard Deviation.
M SD C 022.25 012.10 013.60 001.13 000.59 000.77 251.10 019.60 210.06
00.5a0
00.7a0
01.0a0
0.07a
0.04a
0.02a
26.4a0
06.1a0
24.3a0
M SD HF 022.14 011.60 013.30 001.15 000.59 000.77 279.10 018.90 195.02
01.6a0
00.9a0
00.7a0
0.07a
0.06a
0.04a
28.4a0
06.4a0
17.1a0
M SD HS 022.78 012.10 012.90 001.07 000.58 000.76 260.10 018.20 210.99
00.9a0
00.6a0
00.3a0
00.04a
00.06a
00.04a
11.7a0
05.3a0
17.9a0
There are several experimental studies investigating the effects of fat and high-sucrose diets on rats since these diets promote metabolic changes, but they usually only assess their effect on body weight24-26. BIA can accurately measure lean and fat mass and this distinction is important because excess body fat compromises health, and may promote the development of glucose intolerance and dyslipidemia. Importantly, BIA can be used repeatedly for determining the body composition of live animals, while direct chemical analysis requires sacrificing.
In the present experiment, abdominal circumference, Lee index and BMI (Figure 1) correlated significantly with body composition. The positive correlation found between carcass fat and BMI is in agreement with Novelli et al.19, who suggested that BMI can reliably estimate body fat in rats even though it is not sensitive enough to detect body changes stemming from diets with different macronutrient compositions. Contrary to the present experiment, the cited study did not show the data regarding the correlation between carcass fat and the Lee index and abdominal circumference. Thus, future studies should investigate how accurately these variables can reflect body composition changes.
technique in laboratory animals11,29,30, so this method needs to be further investigated.
Surprisingly, the present results demonstrated that resistance data do not correlate with carcass fat determined chemically, suggesting that BIA is not sufficiently sensitive to measure the body composition of rats or detect the differences in groups receiving different diets. Another disagreement concerned reactance, which was negatively correlated with carcass fat, in contrast with Hall et al.1, in which reactance, when compared with resistance, was not considered a strong predictor of any body component. This study also found wide intragroup variation, showing the heterogeneity of these animals and their different responses to the same diet.
In contrast to the present results, other studies have shown that BIA is sufficiently sensitive to determine rat body composition. In a pioneering study, Hall et al.1 developed an appropriate method for using BIA in rats and found a strong negative correlation between Whole Body Resistance (WBR) measured at 50kHz and total body water and protein. Yoki et al.31 used the empirical formula proposed by Hall et al.1 to estimate the total body water of rats fed a control diet and a diet supplemented with methionine or homocysteine, and demonstrated that this formula was capable of detecting differences between the groups. In contrast to the present study, there were no correlations between this formula and body composition variables. Also, there were no differences among groups fed different diets. Rutter et al.11 noted that BIA could be used to estimate the total body water of control rats, although the method was less accurate when the procedure was used in rats fed a high-fat diet.
The present results show that the fat intake of the HF group and the sucrose intake of the HS group were considerably higher (HF:389% and HS:512%) than those of the control group during the intervention period, despite lower food
Figure 1. Correlations between carcass fat and BMI (a), Lee index (b) and abdominal circumference (c) 4 weeks after the dietary intervention. Ribeirão Preto (SP) Brazil, 2010.
Note: C: Control group; HF: High-Fat group; HS: High-Sucrose. 0,46
0,48 0,5 0,52 0,54 0,56 0,58 0,6 0,62 0,64 0,66 0,68
10 11 12 13 14 15 16 17 18 19 20 21
Carcass fat (g)
Body mass index
r=0.73; >0.01p A
C HF HS
12 12,5 13 13,5 14 14,5 15
10 11 12 13 14 15 16 17 18 19 20 21
Carcass fat (g)
C
Abdominal cir
cunfer
ence (cm)
C HF HS
r=0.42; >0.05p
6,8 7 7,2 7,4 7,6 7,8 8 8,2 8,4
10 11 12 13 14 15 16 17 18 19 20 21
Carcass fat (g)
B
Lee index
r=0.72; >0.01p
intake and same energy intake. Rat tendency to consume less high-fat food is confirmed by other studies32,33. This change in food intake may be due to a mechanism in rats that regulates food intake, reducing food intake when the diet is energy-dense34.
However, higher fat intake increases hepatic fat and cholesterol and reduces total body water, demonstrating that high-fat diets change the lipid profile of the animals. Nevertheless, these changes in blood biochemistry were not reflected by anthropometric or BIA variables, which is in disagreement with most literature reports11,29. Thus, it is possible that the duration of the study intervention was not enough to change body composition but enough to change the biochemical profile, since it changes more readily, or that a diet with different fat proportions would be necessary. Also, some studies have shown that high fat accumulation in rats does not depend on the age or sex of the animals, although genetics may influence fat retention35. BIA standardization in rats with the development of smaller devices and specific equations could provide more accurate results.
C O N C L U S I O N
In conclusion, BIA was not capable of detecting body composition changes in rats fed high-fat and high-sucrose diets. However, carcass fat was significantly associated with BMI, Lee index and abdominal circumference, suggesting that these parameters may be used for estimating rat body composition. More research is needed using BIA to assess the body fat of animals fed different diets. The associations between diet and body composition, and how body composition changes over time, could be investigated without having to kill the animals.
A C K N O W L E D G M E N T
This study was sponsored by Fundação de Amparo a Pesquisa do Estado de São Paulo (grant number 2008/11704-0).
C O N T R I B U T I O N S
LRN ANGÉLOCO and R DEMINICE planned and carried out the experiment, analyzed data and wrote the manuscript. IA LEME helped carry out the experiment, standardized BIA in rats, analyzed data and wrote the manuscript. RC LATARO helped carry out the experiment, collected laboratory data and analyzed the data. AA JORDÃO helped to plan the experiment, analyzed data and wrote the manuscript.
R E F E R E N C E S
1. Hall CB, Lukaski HC, Marchello MJ. Estimation of rat body composition using tetrapolar bioelectrical impedance analysis. Nutri Rep Int. 1989; 39(3): 627-33.
2. Lee SY, Gallagher D. Assessment methods in human body composition. Curr Opin Clin Nutr Metab Care. 2008; 11(5):566-72.
3. Duren DL, Sherwood RJ, Czerwinski SA, Lee M, Choh AC, Seervogel RM, et al. Body composition methods: comparisons and interpretation. J Diabetes Sci Technol. 2008; 2(6):1139-46. 4. Silva SR,Gomes MJ, Dias-Da-Silva A, Gil LF,
Aze-vedo JM. Estimation in vivo of the body and carcass chemical composition of growing lambs by real-time ultrasonography. J Anim Sci. 2005; 83(2):350-7.
5. Rothwell NJ, Stock MJ. In vivo determination of body composition by tritium dilution in the rat. Br J Nutr. 1979; 41(3):625-8.
6. Hariri N, Thibault L . High-fat diet-induced obesity in animal models. Nutr Res Rev. 2010; 23(2):270-99. 7. des Robert C, Li N, Caiado R, Frost S, Lane R, Hauser
J, et al. Metabolic effects of different protein intakes
after short term undernutrition in artificially reared infant rats. Early Hum Dev. 2009; 85(1):41-9. 8. Trocki O, Baer DJ, Castonguay TW. An evaluation
of the use of total body electrical conductivity for the estimation of body composition in adult rats: effect of dietary obesity and adrenalectomy. Physiol Behav. 1995; 57(4):765-72.
9. Lukaski HC. Methods for the assessment of human body composition: traditional and new. Am J Clin Nutr. 1987; (4):537-56.
11. Rutter K, Hennoste L, Ward LC, Cornish BH, Thomas BJ. Bioelectrical impedance analysis for the estimation of body composition in rats. Lab Anim.1998; 32(1):65-71.
12. National Institutes of Health. Bioelectrical impedance analysis in body composition measurement: National Institutes of Health Technology Assessment Conference Statement. Am J Clin Nutr. 1996; 64(3): 524S-32S.
13. Rees AE, Ward LC, Cornish BH, Thomas BJ. Sensitivity of multiple frequency bioelectrical impedance analysis to changes in ion status. Physiol Meas. 1999; 20(4):349-62.
14. Ward LC, Doman D, Jebb SA. Evaluation of a new bioelectrical impedance instrument for the prediction of body cell mass independently of height or weight. Nutrition. 2000; 16(9):745-50. 15. Thomas BJ, Cornish BH, Ward LC. Bioelectrical
impedance analysis for measurement of body fluid volumes: a review. J Clin Eng. 1992; 17(6):505-10. 16. Reeves PG, Nielsen FH, Fahey GC. AIN-93 purified diets for laboratory rodents: final report of the American Institute of Nutrition ad hoc writing committee on the reformulation of the AIN-76A rodent diet. J Nutr. 1993; 123(11):1939-51. 17. Sabbatini AB, Penati A C, Santos RDS, Tostes LM,
Vieira LC, Lamas J. Efeitos de uma dieta hiperlipídica em ratos Wistar. Anais do 14º Simpósio Interna-cional de Iniciação Científica da USP, 2006; Ribeirão Preto.
18. Castro GSF, Almeida LP, Vannucchi H, Portari GV, Jordao AA. Effects of diets containing different types of carbohydrates on hepatic metabolism. Scand J Lab Anim Sci. 2008; 35(4):321-28. 19. Novelli EL, Diniz YS , Galhardi CM, Ebaid GMX,
Rodrigues HG, Mani F, et al. Anthropometrical parameters and markers of obesity in rats. Lab Anim. 2007; 41(1):111-9.
20. Bernardis LL, Patterson BD. Correlation between “Lee index” and carcass fat content in weanling and adult female rats with hypothalamic lesions. J Endocrinol. 1968; 40(4):527-8.
21. Bligh EG, Dyer WJ. A rapid method of total lipid extraction and purification. Can J Biochem Physiol. 1959; 37(8):911-7.
22. Franco FSC, Natali AJ, Costa NMB, Lunz W, Go-mes GJ, Carneiro Junior MA, et al. Effects of creatine supplementation and power training on performance and lean body mass of rats. Rev Bras Med Esporte. 2007; 13(5):297-302.
23. Ma TS, Zuazaga G. Micro-Kjeldahl determination of nitrogen: a new indicator and an improved rapid method. Ind Eng Chem (Analytical Edition). 1942; 14(3):280-2.
24. Castro GSF, Almeida BB, Leonardi DS, Ovídio PP, Jordão AA. Association between hepatic cholesterol and oleic acid in the liver of rats treated with partially hydrogenated vegetable oil. Rev Nutr. 2012; 25(1):45-56. doi:10.1590/S1415-52732012 000100005.
25. Borba AJ, Roch MGM, Silva MF, Tibúrcio DTS, Pereira SAL, Reis LC,et al. Dietahiperlipídico--proteica utilizada para emagrecimento induz obesidade em ratos. Rev Nutr. 2011;24(4): 519-28. doi:10.1590/S1415-527320110004000 01.
26. Liu SH, He SP, Chiang MT. Effects of long-term feeding of chitosan on postprandial lipid responses and lipid metabolism in a high-sucrose-diet-impaired glucose-tolerant rat model. J Agric Food Chem. 2012; 60(17):4306-13.
27. Kushner RF. Bioelectrical impedance analysis: a review of principles and applications. J Am Coll Nutr.1992; 11(2):199-209.
28. Kyle UG, Bosaeus I, de Lorenzo AD, Deurenberg P, Elia M, Gómez JM, et al. Bioelectrical impedance analysis-part II: utilization in clinical practice. Clin Nutr. 2004; 23(6):1430-53.
29. Ilagan J, Bhutani V, Archer P, Lin PK, Jen KL. Estimation of body composition changes during weight cycling by bioelectrical impedance analysis in rats. J Appl Physiol. 1993; 75(5):2092-8. 30. Cornish BH, Ward LC, Thomas BJ. Measurement
of extracellular and total body water of rats using multiple frequency bioelectrical impedance analysis. Nutr Res. 1992; 12(4-5):657-66.
31. Yokoi K, Lukaski HC, Uthus EO, Nielsen FH. Use of bioimpedance spectroscopy to estimate body water distribution in rats fed high dietary sulfur amino acids. J Nutr. 2001; 131(4):1302-8.
32. Estrany ME, Proenza AM, Lladó I, Gianotti M. Isocaloric intake of a high-fat diet modifies adiposity and lipid handling in a sex dependent manner in rats. Lipids Health Dis. 2011; 12:10-52.
33. Nakashima Y, Yokokura A. Consumption of a high-fat diet containing lard during the growth period in rats predisposes them to favorably respond to the diet in later life. J Nutr Sci Vitaminol (Tokyo). 2010; 56(6):380-6.
34. Kretschmer BD, Schelling P, Beier N, Liebscher C, Treutel S, Krüger N , et al. Modulatory role of food, feeding regime and physical exercise on body weight and insulin resistance. Life Sci. 2005; 76(14):1553-73.
35. Ellis J, Lake A, Hoover-Plow J. Monounsaturated canola oil reduces fat deposition in growing female rats fed a high or low fat diet. Nutr Res. 2002; 22:609-21.