274
Revista da Sociedade Brasileira de Medicina Tropical 44(3):274-281, mai-jun, 2011
INTRODUCTION
1. Departamento de Puericultura e Pediatria, Disciplina de Nutrição e Metabolismo, Faculdade de Medicina de Ribeirão Preto, Universidade de São Paulo, Ribeirão Preto, SP. 2. Departamento de Medicina Social, Faculdade de Medicina de Ribeirão Preto, Universidade de São Paulo, Ribeirão Preto, SP.
Address to: Dra. Jacqueline Pontes Monteiro. Depto Puericultura e Pediatria/FMRP/USP. Av. Bandeirantes 3900, Campus USP, 14049-900 Ribeirão Preto, SP, Brasil.
Phone: 55 16 3602-2806; Fax: 55 16 3602-2700 e-mail: [email protected]
Received in 03/09/2010 Accepted in 17/02/2011
Nutritional assessment and lipid proile in HIV-infected children and
adolescents treated with highly active antiretroviral therapy
Avaliação nutricional e do peril lipídico em crianças e adolescentes infectadas pelo HIV
tratadas com terapia antirretroviral de alta potência
Marina Hjertquist Tremeschin
1, Daniela Saes Sartorelli
2, Maria Célia Cervi
1, Bento Vidal de Moura Negrini
1,
Roberta Garcia Salomão
1and Jacqueline Pontes Monteiro
1ABSTACT
Introduction: HIV-infected children and adolescents treated with highly active antiretroviral therapy (HAART) regimens that include a protease inhibitor (PI) can show significant improvements in clinical outcomes, nutritional status and quality of life. he study aimed to report nutritional and metabolic alterations for pediatric patients continuously exposed to HAART and for healthy controls for up to 1 year. Methods: Clinical, anthropometric, lipid proile and food intake data were collected prospectively over approximately 12-months for each patient.
Results: Fity-one individuals were studied, of these, 16 were healthy. Ater 12 months follow-up, HIV-positive individuals remained below the healthy control group parameters. No change was observed concerning food intake. Triglyceride serum levels were higher in patients using protease inhibitor at the onset of the study [PI groups: 114 (43 - 336), and 136 (63 - 271) versus
control group: 54.5 (20 - 162); p = 0.003], but ater twelve months follow-up, only the group using protease inhibitor for up to two months presented higher values [140 (73 - 273) versus 67.5 (33 - 117); p = 0.004]. HDL-cholesterol was lower in HIV-positive individuals [HIV-positive groups: 36 (27 - 58) and 36 (23 - 43); control 49.5 (34 - 69); p = 0.004]. Conclusions: HIV-infected children and adolescents treated with highly active antiretroviral therapy showed compromised nutritional parameters compared to a paired healthy control group. Individuals using protease inhibitor presented worse triglyceride serum levels compared to their healthy counterparts.
Keywords: Body composition. Dyslipidemia. Highly active antiretroviral therapy. HIV- positive children. Lipid proile. Nutritional status.
RESUMO
Introdução: Crianças e adolescentes infectadas pelo HIV e tratadas com terapia antirretroviral de alta potência (TAAP), que inclui inibidor de protease (IP) podem apresentar signiicante melhora clínica no estado nutricional e na qualidade de vida. O objetivo é relatar as alterações nutricionais e metabólicas em pacientes pediátricos expostos a TAAP e controles saudáveis durante 1 ano. Métodos: O peril clínico, antropométrico e lipídico, bem como dados da ingestão alimentar foram coletados prospectivamente durante aproximadamente 12 meses.
Resultados: Cinquenta e um indivíduos foram estudados. Dezesseis eram saudáveis. Após 12 meses de acompanhamento, indivíduos HIV-positivo permaneceram abaixo dos parâmetros do grupo controle saudável. Nenhuma mudança foi observada em relação à ingestão alimentar. Níveis séricos de triglicerídeos foram maiores em pacientes usando inibidor de protease no começo do estudo [IP grupo: 114 (43 - 336), e 136 (63 - 271) versus grupo controle: 54.5 (20 - 162); p = 0.003], porém após doze meses de acompanhamento, apenas o grupo que recebeu inibidor de protease por não mais do que dois meses apresentou maiores valores [140 (73 - 273) versus 67.5 (33 - 117); p = 0.004]. HDL-colesterol foi menor nos indivíduos HIV-positivos [grupo HIV-positivo: 36 (27 - 58) e 36 (23 - 43); controle 49.5 (34 - 69); p=0.004].
Conclusões: Crianças e adolescentes infectadas pelo HIV e tratadas com terapia antirretroviral de alta potência tiveram seus parâmetros nutricionais comprometidos quando comparados com o pareado grupo controle. Indivíduos usando inibidor de protease apresentaram piores níveis séricos de triglicerídeos quando comparados com os saudáveis.
Palavras-chaves: Composição corporal. Dislipidemia. Terapia antirretroviral de alta potência. Crianças HIV-positivas. Peril lipídico. Estado nutricional.
HIV-infected children and adolescents treated with highly active antiretroviral therapy (HAART) regimens that include a human immunodeiciency virus (HIV) protease inhibitor (PI) can exhibit significant improvements in clinical outcomes, nutritional status and quality of life1. HAART
generally includes three or more antiretroviral agents used in combination. These drugs are selected from any of three well-recognized classes: nucleoside reverse transcriptase inhibitors (NRTI), non-nucleoside reverse transcriptase inhibitors (NNRTI), or protease inhibitors (PI). However, HAART has also been associated with certain undesirable side efects, including gastrointestinal intolerance, high pill burden, mitochondrial toxicities and lipodystrophy.
he lipodystrophy syndrome has been clinically characterized by fat redistribution with an associated range of metabolic abnormalities2. The physical
features include clinical evidence of at least one of the following: fat wasting (lipoatrophy) of the face, extremities, or butocks and fat accumulation (lipohypertrophy) in the abdomen or over the dorsocervical spine. he metabolic features include at least one of the following: fasting hypertriglyceridemia and/or hypercholesterolemia, fasting C-peptide level elevation and evidence of abnormal glucose metabolism, including disorders ranging from abnormal fasting glucose levels to diabetes mellitus2-4.
Although published studies have yielded valuable data on the characterization of lipodystrophy syndrome and metabolic changes and its association with PI-containing antiretroviral therapy among children and adolescents worldwide, very litle data exist in Brazil concerning nutritional status, quality of life and lipid proile5,6 ater one year of HAART.
his study reports longitudinal clinical data for pediatric patients continuously exposed to HAART regimens and healthy controls groups for up to 1 year, and describes the nutritional and lipid proiles compared in both groups.
Article/Artigo
METHODS
RESULTS Children attending the Pediatric Outpatient HIV Clinic at
our center were studied. Every consecutive child who came to the teaching hospital of the School of Medicine of Ribeirão Preto, University of São Paulo, Brazil, over two years (2006 to 2007) was recruited and submited to an interview to check their availability and inclusion criteria for participation. he institutional research ethics commitee approved the research protocol and all the patients and their parents or legal guardians provided writen informed consent to participate. he participants were divided into 4 groups of patients on the basis of the type of HAART being used: group 1, patients using nucleoside reverse transcriptase inhibitors or non-nucleoside reverse transcriptase inhibitors; group 2, patients using protease inhibitor (PI) for more than two months; group 3, patients using protease inhibitor for up to two months; and group 4, paired HIV-negative healthy children and adolescents.
The inclusion criteria were the ability to complete the anthropometry and absence of liver disease, chronic or acute pancreatitis, renal failure, or diarrhea that could interfere in the development of the child and their nutritional status. None of the patients was receiving vitamin supplementation or appetite stimulants and all were clinically stable.
he HIV-negative children and adolescents were selected from a Health Center in Ribeirão Preto, Brazil, and were paired for age and sex.
Data was collected prospectively over 12-months, for each patient. All HIV-positive patients received medical care according to the Pediatric Outpatient HIV Clinic protocol. Data obtained from medical records included age, sex, complete antiretroviral therapy history, Centers for Disease Control and Prevention classiication, CD4+ T lymphocyte counts and HIV-1 RNA levels.
Hypercholesterolemia was deined as a total fasting cholesterol level higher than 200mg/dl and a low-density lipoprotein cholesterol level higher than 130mg/dl. Hypertriglyceridemia was deined as a fasting triglyceride level above 140mg/dl7. Hyperlipidemia was
deined as serum triglycerides ≥ 140mg/dl and/or serum cholesterol ≥ 200mg/dl.
Laboratory studies of total serum cholesterol and triglycerides were performed by commercial laboratories as part of routine clinical care. Lipid measurements were based on fasting blood samples.
he nutritional assessment of these children occurred at uniform intervals, generally every 6 months, as mandated by the service protocol of patients, and the data were recorded in a database (SPSS 15.0).
Weight and height were assessed according to the method described by Heymsield et al8 and determined by a dietitian who
was trained to take all measurements. he reference data of the World Health Organization/National Center for Health Statistics/ Centers for Disease Control and Prevention9 was used. For the
estimation of fat-free mass and total body water, a bioelectrical impedance technique (BIA) was applied at the same time the weight was measured10. he midarm circumference, waist circumference,
subscapular skinfold and triceps skinfold were also measured to relect lean body mass and fat11. Body mass index (BMI) was
calculated by the standard formula using height and weight and ploted on CDC BMI-for-age curves for 2 to 20 years of age for girls
and boys12. Weight, height and BMI values were converted to age-
and sex-adjusted Z scores using EPI INFO® sotware program and individuals < - 2 standard deviation for weight for age and or height for age were considered malnourished.
Usual dietary intake was assessed by an adapted semi quantitative food-frequency questionnaire. Individuals were asked to report which foods they had eaten during the preceding three months based on a ixed list. he standard portion sizes were presented to the respondent, who was asked how many times the portion size was eaten. he standard portion sizes for each food were those reported in a previous study13,14. Respondents were asked to report their
consumption as daily, weekly, monthly and rarely. Nutrient intakes associated with each patern of food consumption were determined according to Dietsys sotware.
Quality of life was assessed by Autoquestionnaire de qualité de vie enfant imagé (AUQEI questionnaire)15 which was validated
by Assumpção Jr et al16. It is a generic tool applied to children
aged between 4 and 12 years-old, based on children’s subjective perspective of satisfaction regarding function, family, entertainment and autonomy. Values above 48 are indicative of good quality of life.
Statistical analyses
Continuous variables with normal distribution were expressed as mean ± standard deviation; in this case, comparison across groups was performed by analysis of variance (Post Hoc) and the non-paired t test. he nonparametric Kruskal-Wallis test was used to compare variables with non-normal distribution, which were expressed as median and range. he Wilcoxon test was used to compare longitudinal variables; this tests whether the distribution of two paired variables in two related samples is the same and takes into account the magnitude of the diferences between two paired variables. The Χ2 test or Fisher exact test was used to compare
frequency distributions across groups. Linear regression analysis was used to determine whether alterations in weight and body composition were associated with changes in quality of life, since most commonly, linear regression refers to a model in which the conditional mean of y given the value of X is an aine function of X. Analysis of covariance (ANCOVA) was also applied for energy intake in two moments, adjusted for age and weight, to test the hypothesis that age and weight could interfere in the results of energy intake. P < 0.05 was considered statistically signiicant.
Fity-one children and adolescents agreed to participate and met the criteria for inclusion in this study. hey were distributed into four groups: group 1 (n = 17), group 2 (n = 9), group 3 (n = 9) and group 4 (n = 16). Stavudine, as part of a backbone NRTI regimen, and PI use, have both been associated with lipodystrophy syndrome17;
however, in the present study, no statistical diference was veriied in the proportion of individuals receiving stavudine among the groups (at the onset of the study: G1 17.6%, G2 33.3%, G3 33.3% p = 0.57; ater twelve months: G1 23.5%, G2 22.2%, G3 33.3% p = 0.82).
276
Rev Soc Bras Med Trop 44(3):274-281, mai-jun, 2011
T
A
B
LE 1
-C linic al a n d de m ogr aphic d at
a of c
hildr en a n d a dole sc en ts di str ib ut ed a cc o rdin g t o t ype a n d tim
e of a
n tir etr o vir al th er ap y ( A R T
) in th
e be
ginnin
g of th
e s tudy a n d a t er t w elv e m o n ths follo w -u p . P ar ame te rs Gr o u p 1(
n = 17)
Gr
o
u
p 2(
n = 9)
Gr
o
u
p 3(
n = 9)
Gr
o
u
p 4(
n = 16)
p -v alue A B A B A B A B A B A ge ( mon th s) 116 (82-180) 130 (92-192) 140 (73-187) 151 (86-202) 126 (60-195) 136 (74-208) 120.5 (48-192) 135 (60-204) 0.599 0.634 V ir al lo ad ( ce lls/mm 3) 2,878 (49-2466) 2,399.5 (49-48,477) 556 (49-38,929) 49 (49-144,362) 12,775 (232-10,999) 3,904 (49-91,438) - - 0.210 0.290 C D4/C D8 ( ce lls/mm 3) 0.425 (0.19-1.18) 0.53 (0.11-1.06) 0.72 (0.15-1.02) 0.63 (0.17-1.08) 0.33 (0.04-0.41) 0.37 (0.08-1.11) - - 0.019‡ 0.217 C D4 ( ce lls/mm 3) 574.5 (17-816) 730 (230-1,089) 681 (112-1,032) 821 (68-1,083) 396 (13-654) 406 (103-1,584) - - 0.047‡ 0.530 C D8 ( ce lls/mm 3) 1,466 (352-2,497) 1,262 (576-2,905) 936 (349-4,249) 1,316 (1,004-3,000) 1,182 (345-3,035) 1,105 (637-3,503) - - 0.314 0.782 T
ime of A
TR ( mon th s) 102 (12-143) 115 (24-156) 86 (70-156) 100 (83-171) 84 (0.13-168) 93 (9-181) - - 0.613 0.575 T
ime of PI (
mon th s) - - 27 (5-86) 39 (20-100) 1 (0.13-2) 11 (9-14) - - 0.000‡ 0.000* T ot al cho le st er ol ( m g/d l) 125 (100-202) 131 (91-209) 161 (129-236) 165 (110-215) 166 (103-213) 156.5 (107-202) 148.5 (101-200) 154 (95-203) 0.059 0.169 T ri gly ce ride s ( m g/d l) 94 (40-197) 79 (55-286) 114 (43-336) 96 (42-216) 136 (63-271) 140 (73-273) 54.5 (20-162) 67.5 (33-117) 0.003** 0.004*** H DL cho le st er ol ( m g/d l) 39 (21-59) 36 (27-58) 32 (26-47) 44 (19-54) 34 (21-52) 36 (23-43) 42 (32-68) 49.5 (34-69) 0.518 0.004**** LDL cho le st er ol ( m g/d l) 69 (57-146) 74.5 (42-127) 74 (55-96) 100 (54-140) 109 (60-133) 100 (55-124) 85 (48-137) 83 (31-148) 0.302 0.219 A UQEI ( coun ts ) 58 (46-68) 56 (45-71) 56 (39-62) 54 (45-73) 54 (43-62) 57 (47-66) 53.5 (40-66) 54 (44-65) 0.280 0.564 C ol um n A : d at es a t t h e on se t o f t h e st ud y, c ol um n B : d at es a t er tw el ve m on th s f ol lo w -u p, C D 4: L ym ph oc yt e T C D 4 co un t, C D 8: ly m ph oc yt e T C D 8 co un t, se ru m H D L : h ig h d en si ty li po pr ot ei n , s er um L D L : l ow d en si ty li po pr ot ei n , A UQEI: Qual it
y of l
ife que
st
ionn
air
e, ‡ gr
ou
p 2 b
igg
er th
an 3, *gr
ou
p 2 d
ife re n t f rom gr ou
p 3, **gr
ou
p 4 d
ife re n t f rom gr ou
ps 2 a
nd 3,***gr
ou
p 3 d
ife re n t f rom gr ou
p 4, ****gr
ou
p 4 d
ife re n t f rom gr ou
ps 1 a
nd 3. A TR : a n tir etr ov ir al the ra
py; PI: pr
ot eas e inhi b it or .
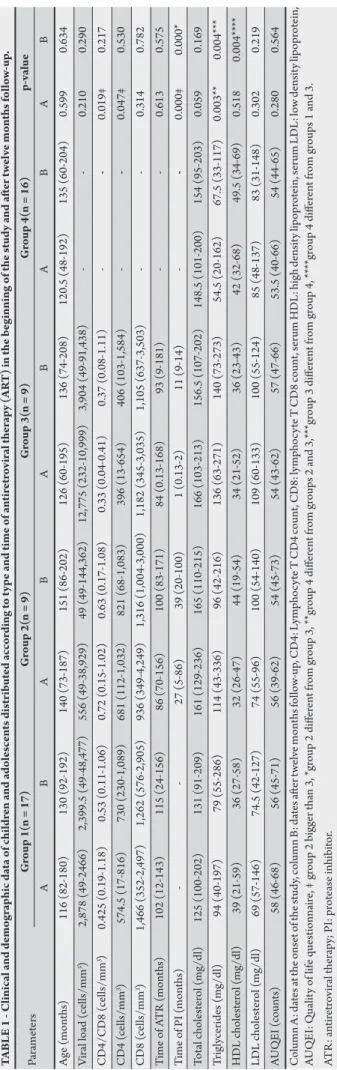
of the study compared to group 2. Eight (47%) out of 17 patients in group 1 had prior AIDS, whereas ive (55%) out of nine patients in group 2 and seven (78%) out of nine patients in group 3 had prior AIDS; this diference was not statistically signiicant (p > 0.05). No signiicant diferences between any of the groups with respect to age and sex were observed (54.9% male versus 45.1% female, p = 0.32). Quality of life was similar between groups at all time points, according to the AUQEI questionnaire. There were also no statistical differences between groups 1, 2 and 3 concerning HIV infection classiication at any time point. he demographic and clinical data for all patients are presented in Tables 1 and 2.
Triglycerides serum levels were higher in patients using protease inhibitor compared to healthy controls at the onset of the study, but ater twelve months follow-up, only group 3 had higher values and HDL cholesterol serum levels were lower in group 1 and 3 compared to group 4 (Table 1). In spite of that there was no statistical diferences between the groups concerning patients who exhibited hyperlipidemia: 12% (2) of patients in group 1, 33.3% (3) of patients in group 2, 44.4% (4) of patients in group 3, exhibited hyperlipidemia at any time point; 18.7% (3) and 6.2% (1) of patients exhibited hyperlipidemia at the study onset and ater twelve months follow-up, respectively, for group 4.
At the beginning of the study, healthy controls subjects presented greater weight, height/age adequacy, Z scores for weight and height and triceps and subscapular skinfold thickness adequacy compared to HIV-positive individuals. Concerning body mass index adequacy, groups using protease inhibitor presented lower values compared to groups 1 and 4, but with statistically signiicant results only for group 2 (Table 2). Ater twelve months follow-up, group 2 showed the worst values for almost all the anthropometric parameters and group 4, the best values compared to HIV-positive individuals (Table 2).
At the onset of the study, malnourished individuals constituted 5.9% of group 1, 44.4% of group 2, 33.3% of group 3 and 0% of group 4 (p = 0.007). Individuals in PI groups presented greater malnourishment than individuals in group 4 (p < 0.05); and group 2 presented worse values compared to group 1 (p = 0.03) and group 4 (p = 0.009). Ater twelve months follow-up, only group 2 showed an increase in the number of malnourished individuals (55.5%). In group 1, overweight individuals constituted 11.8% at the onset of the study, while overweight individuals constituted 6.2% of group 4 at the end of the study. At the onset of the study, obese individuals constituted 5.9% and 12.5% of groups 1 and 4, respectively. A decrease in the rate of obesity occurred in group 4 by the end of the study (6.2%).
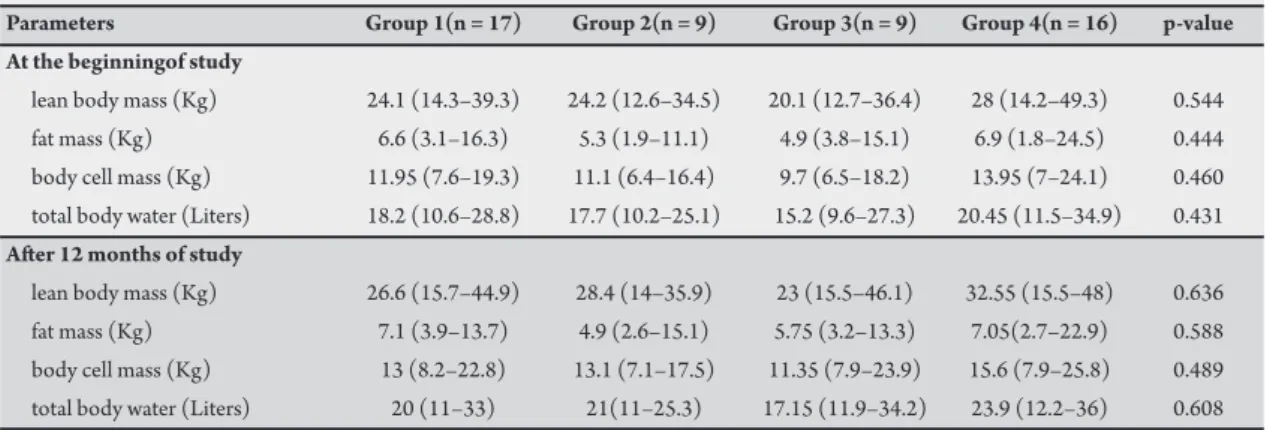
Bioelectrical impedance analyses were unable to detect any diferences between the groups at any point during the study (Table 3).
Energy and macronutrient intakes were similar between the groups at all time points during the study, but a higher lipid intake (% of energy intake) occurred compared to the recommended intake in all groups. he mean energy intake at the onset of the study and at the end of study was, respectively, 2,413kcal (1,586 - 5,806) and 2,148kcal (1,289 - 4,166). he mean percentage of lipid calories at the onset and end of the study was, respectively, 37.8% (28.6 - 49.2) and 38.5% (28 - 48.6). Age and weight did not interfere with the energy intake results, according to ANCOVA analyses (at the onset: age p = 0.39, weight p = 0.72; at the end: age p = 0.94, weight p = 0.49).
An increase in CD4 cell count occurred in group 1 ater twelve months follow-up (p = 0.044). Clinical improvement was not observed in groups 2 and 3 (p > 0.05 for all parameters).
Parameters
A B A B A B A B A B
Weight (Kg) 31.3 39 29.7 35.2 25 27.9 36.75 42.4 0.047* 0.531
(19.6–49.8) (21–55) (14.5–45.6) (16.6–51) (16.6–50.9) (20–53.1) (16.9–73.8) (9–70.3)
Z score weight -0.41 ±1.16 -0.51 ±1.21 -2.0±1.38 -1.97±1.32 -1.60±1.11 -1.35±0.84 0.19±0.91 0.2±0.95 0.001** 0.001**
Height (cm) 132 142.5 137 145.5 127.5 134 142.5 149.3 0.550 0.587
(114.5–166) (118.5–170) (105–159) (110.5–163) (105.5–158) (112-163.5) (104.5-164.5) (111.5-66.5)
Z score height -0.66 ±1.08 -0.66±0.94 - 1.36±0.93 -1.19±0.88 -1.6±1.1 -1.45±1.1 0.74±1.1 0.57±1.1 0.000** 0.000**
Body mass index 101 99 91.43 91 91.05 97 104.06 101 0.003† 0.036†
(% of adequacy) (80.22-141.46) (80–148) (74.70–99.87) (67–100) (85.6–101.5) (82–109) (79.8–151.5) (79–156)
Waist circumference 61.5 65 57 63 61 60 62 62.75 0.509 0.516
(cm) (49–77) (52–77) (46.5–68.5) (48–69) (52–73.1) (54.4–71.3) (48.5–80) (48.6–75.8)
Triceps skinfold 68 77 45.49 60 60.41 84 121.73 106 0.000* 0.002††
thickness (% of adequacy) (33.19–126.6) (44–205) (32.08–79.9) (42–103) (34.48–123) (59.2–121) (72.8-173.22) (75–202)
Subscapular skinfold 73.68 108 55.49 86 87.5 88 152.77 142 0.000** 0.001****
thickness (% of adequacy) (33.33–250) (71–250) (38.46–125) (56–133) (41.6–107.69) (80–167) (57.1–400) (85–367)
Mid-arm-muscle-circumference 100.5 96.1 94.4 91.4 89.7 86.76 94.24 100.3 0.125 0.006****
(% of adequacy) (86.6–114.4) (83–119) (78.2–111.48) (67.27-108.84) (75.38–99.6) (78.2-102.6) (54.39–143.3) (79.76–133)
Height/age (%) 98.76 98 94.9 94 95.04 96 105.33 102 0.000** 0.001**
(92.4–107.0) (89–104) (88.1–101.57) (89–102) (87.46-98.55) (86–102) (95–115.34) (95–114)
Weight/height (%) 99.0 100 91.58 91 97 99 91.53 98 0.093 0.033***
(85.59-149.18) (84–147) (78.2–99.16) (73–99) (87.9–108.3) (85–112) (82.5–135) (85–140)
Column A: dates at the onset of the study, Column B: dates ater twelve months follow-up, †group 2 diferent from groups 1 and 4, ††group 4 diferent from groups 1 and 2, *he four groups are statistically diferent, **group 4 diferent from groups 1, 2 and 3, ***group 2 diferent from group 1, ****group 4 diferent from groups 2 and 3.
T
re
m
es
chin M
H e
t a
l
- D
ysl
ip
ide
mi
a in pe
dia
tr
ic H
IV
278
An increase in weight (p = 0.008), height (p = 0.008), triceps skinfold thickness (p = 0.035), subscapular skinfold thickness (p = 0.034) and lean body mass (p = 0.008) also occurred in group 2 ater twelve months follow-up.
Group 3 showed an increase in weight (p = 0.008), height (p = 0.008), subscapular skinfold thickness (p = 0.034) and lean body mass (p = 0.017) ater twelve months follow-up.
Group 4 also showed progress in nutritional status, with an increase in weight (p = 0.003), height (p = 0.001), height/age index (p = 0.008), Z score for height (p = 0.01), body mass index (p = 0.032), mid-arm-muscle circumference (p = 0.008) and lean body mass (p = 0.002) ater twelve months follow-up.
TABLE 3 - Bioelectrical impedance analyses of children and adolescents distributed according to type and time of antiretroviral therapy (ART) at the beginning of the study and ater twelve months follow-up.
Parameters Group 1(n = 17) Group 2(n = 9) Group 3(n = 9) Group 4(n = 16) p-value
At the beginningof study
lean body mass (Kg) 24.1 (14.3–39.3) 24.2 (12.6–34.5) 20.1 (12.7–36.4) 28 (14.2–49.3) 0.544
fat mass (Kg) 6.6 (3.1–16.3) 5.3 (1.9–11.1) 4.9 (3.8–15.1) 6.9 (1.8–24.5) 0.444
body cell mass (Kg) 11.95 (7.6–19.3) 11.1 (6.4–16.4) 9.7 (6.5–18.2) 13.95 (7–24.1) 0.460
total body water (Liters) 18.2 (10.6–28.8) 17.7 (10.2–25.1) 15.2 (9.6–27.3) 20.45 (11.5–34.9) 0.431
Ater 12 months of study
lean body mass (Kg) 26.6 (15.7–44.9) 28.4 (14–35.9) 23 (15.5–46.1) 32.55 (15.5–48) 0.636
fat mass (Kg) 7.1 (3.9–13.7) 4.9 (2.6–15.1) 5.75 (3.2–13.3) 7.05(2.7–22.9) 0.588
body cell mass (Kg) 13 (8.2–22.8) 13.1 (7.1–17.5) 11.35 (7.9–23.9) 15.6 (7.9–25.8) 0.489
total body water (Liters) 20 (11–33) 21(11–25.3) 17.15 (11.9–34.2) 23.9 (12.2–36) 0.608
No diferences were observed concerning food intake ater twelve months follow-up in groups 1, 2 and 3 (p > 0.05 for all parameters). Group 4 presented a decrease in food intake in relation to energy (p = 0.020), protein (p = 0.030) and carbohydrate (p = 0.044).
After twelve months follow-up, no change was observed concerning the lipid proiles in all groups (p > 0.05 for all parameters), except for an increase in HDL cholesterol in group 4.
Linear regression analysis showed that an increase in fat mass in HIV-positive individuals is associated with quality of life (p = 0.026; adjusted for age and sex p = 0.042; adjusted for time using protease inhibitor PI p = 0.047; adjusted for time in antiretroviral therapy p = 0.034) (Table 4). No other variable was statistically associated with quality of life.
TABLE 4 - Regression coefficients β 1 (95% confidence interval) for the diference in quality of life according to fat mass alteration in HIV positive children ater twelve months follow-up.
Alteration in quality of life
Diference in fat mass β CI 95% p
Model 1* 0.406 0.195 - 2.848 0.026
Model 2** 0.410 0.059 - 3.018 0.042
Model 3 *** 0.041 0.025 - 3.049 0.047
Model 4 † 0.433 0.129 - 3.104 0.034
*Model 1: crude analysis, **Model 2: adjusted for age and sex, ***Model 3: model 2 + Time using protease inhibitor, †Model 4: model 2 + time using antiretroviral therapy.
DISCUSSION
Analysis of the data obtained showed that clinically stable HIV-positive children and adolescents still present greater compromise regarding nutritional status compared to healthy controls paired for age, sex and quality of life, in the HAART era. he most compromised were the individuals using protease inhibitor. Despite adequate nutritional improvement ater twelve months follow-up, HIV-positive individuals remained below the healthy control group parameters. An increase in fat mass in HIV-positive individuals improves quality of life predictions. No change was observed concerning food intake and only the group using NRTI and/or NNRTI showed a statistically signiicant increase in CD4 cell count ater twelve months follow-up. Triglyceride serum levels were higher in patients using protease inhibitor compared to healthy controls at the onset of the study, but ater twelve months follow-up, only the group using PI for up to two months presented triglyceride serum levels higher than healthy
controls, while HDL cholesterol serum levels were lower in groups 1 and 3 compared to group 4. A proportion of hyperlipidemia occurred in individuals using protease inhibitor, though this was not statistically signiicant. Despite the small sample size, the results obtained were similar to those reported by Aldrovandi et al in a larger cross-sectional multicenter study in the United States18.
Despite worse nutritional status compared to controls, HIV-positive individuals presented an increase in weight, height, fat mass and fat-free mass ater twelve months up. Longitudinal follow-up monitoring HIV-positive children with HAART also showed an increase in lean mass19. he study by Verweel et al indicates that
virology respondent children with HIV-infection show an increase in height and weight following the initiation of HAART20.
It seems that HAART had a positive efect on height and weight in the children and adolescents with HIV-infection in this study, though not suicient to achieve healthy control values. his efect was sustained for at least 12 months (48 weeks) and can last up to 96 weeks according to Verweel et al20. hese sustained efects on fat
mass may positively inluence the child’s quality of life, as shown by the present results and will predictably contribute to improved prognosis. he positive efect of HAART on nutritional parameters has been extensively reported21-25.
Group 4 showed the best values for z scores compared to the HIV-positive groups. Ater twelve months follow-up, only group 4 showed an increase in the height-for-age Z score. In contrast, group 2 presented more malnourished individuals compared to groups 1 and 4 at the onset of the study. Ater twelve months follow-up, only group 2 presented an increase in the number of malnourished individuals, which can be atributed to poorer clinical evolution in one patient. Similar results were reported by Verweel et al20.
In the present study, triceps and subscapular skinfold thickness and mid-arm muscle circumference showed no detectable statistical diferences, comparing individuals using NRT/NNRT and PIs, and fat redistribution was not an important feature in these individuals, corroborating the results obtained by Santos et al26. Melvin et al27
suggested that dyslipidemia occurs prior to body changes in the lipodystrophy syndrome, especially in individuals in Tanner stages 1 and 2. his study did not analyze Tanner classiication stage, but the median age of the children was compatible with stages 1 and 2. Metabolic abnormalities and fat redistribution are more likely to occur in post-pubertal children, especially those who are receiving protease inhibitor treatment28-30.
he period of follow-up and age were statistically similar between the groups, but might have afected the results, since the control group presented 14.5 months of follow-up compared to 14, 11 and 10 months for groups 1, 2 and 3, respectively. Since statistically signiicant diferences for weight, height, triceps and subscapular skinfold thickness were veriied at the onset of the study, this shows that HIV-positive individuals continue to present poorer nutritional parameters than the healthy control group.
In the present study, HIV-infected individuals showed worse nutritional evolution compared to healthy controls, despite similar food intake. HIV-1-infected children in developed countries present similar birth weights compared to non-infected groups, but quickly diverge in both weight and height within the irst few months of life31.
his fact is diicult to explain because in children who fail to gain weight, identifying a single factor, which, when corrected, results in normal growth in the course of HIV infection is uncommon. Evidence of signiicantly less lean body mass (as assessed by midarm circumference and triceps skinfold thickness) has been veriied among very young HIV-infected children compared to control children of similar age32. At present, the pathogenesis of weight loss
or growth failure in HIV infection is largely speculative. Many factors, including poor oral intake, malabsorption, and hypermetabolism may be involved33. Disturbances in the growth hormone insulin-like
growth factor axis that have been described in HIV infection could also play a role in the growth and body composition abnormalities observed here34.
he fact that there were more malnourished individuals among HIV-infected children compared to controls in the present study suggests that the nutritional characteristics of Brazilian HIV-infected children may not become similar to their uninfected counterparts as they become healthier with HAART, a fact that is in disagreement with the results of some studies20,35.
Many reports regarding clinically evaluated lipodystrophy syndrome suggest that peripheral atrophy is oten accompanied
by an increase in central obesity in HIV-infected individuals using HAART. In the present study, waist circumference does not permit precise characterization of any increase in central obesity in HIV-positive individuals. It is possible that waist circumference cannot easily distinguish changes in fat from lean and may not be suitable for this purpose in children.
In contrast to the increase in the body mass index (BMI) in adults on HAART, BMI did not increase in all children efectively treated with HAART ater twelve months follow-up in the present study. hese result corroborates similar indings reported by Verweel et al20.
It is possible that BMI increases more in children with an advanced stage of infection and poor nutritional status at baseline36.
Bioelectrical impedance was unable to detect any diferences between the groups. BIA has been used to assess body composition in HIV-infected children, but interpretation of the results is diicult due to the lack of standards for children37-39. he accuracy of bioelectric
impedance may vary not only in relation to the equations used, but by sex and percentage of body fat40. In addition, BIA measures
only whole-body fat and lean body mass, thus it cannot diagnose abnormalities in fat redistribution and may be inaccurate in the seting of lipodystrophy41.
Food intake was similar between the groups and no changes were observed ater twelve months follow-up, except for a decrease in energy, protein and carbohydrate intake in the control group. Despite this fact, a higher proportion of lipid intake than carbohydrate was veriied in all groups.
Decreased nutrient intake is not encountered in children with HIV infection. he dietary intake among children with HIV infection is reported to be equal to or greater than those in non-infected children42 and additional variables, such as metabolic abnormalities,
could be involved in lipodystrophy syndrome43.
Nutritional concerns in HIV-infected children have evolved, from wasting to obesity and insulin resistance. Excessive caloric intake and a shit in dietary composition toward lipids suggest that continued dietary monitoring in HIV-infected children is important to avoid increased risk of cardiovascular disease.
he present study showed that an increase in fat mass is associated with beter quality of life. he AUQEI questionnaire seemed to be appropriate in pediatric and adolescent populations with HIV44,45.
Preliminary evidence in pediatric HIV-1 research suggests that combination antiretroviral therapies have a positive efect on mean weight, height, growth velocity, appetite, and well-being21,23,45,46.
Studies on the tolerability and eicacy of PI containing regimens have mentioned alterations in serum lipids ranging from dyslipidemia in 20% to 50% of children on single PI to > 90% on dual PI containing regimens45,47-49. The present data showed a lower proportion of
hyperlipidemia compared to the study by Taylor et al50, who
reported 58.3% and the study by Werner et al, who veriied 88.3%51.
In addition, the proportion of hyperlipidemia among HIV-positive individuals was similar to the healthy control group, suggesting that the HAART regimen alone could not be associated with an increased risk of dyslipidemia. Taylor et al50 also conirmed that some patients
using protease inhibitor may not develop dyslipidemia.
280
he study failed to detect higher dyslipidemia in the group using PIs, and the the occurrence of hypertrygliceridemia among HIV-positive individuals from groups 2 and 3 could have preceded the use of protease inhibitor53. Although initial reports implicate
protease inhibitors, more recent studies have suggested that nucleoside analogues could play a role in the development of lipodystrophy syndrome, including dyslipidemia2,54.
The study also failed to detect any association between PI duration and dyslipidemia. Cheseaux et al55 and Krause et al also
reported no signiicant increase even ater 24 and 30 months of antiretroviral therapy56. The stabilizing relation with extended
durations of PI usage may explain why most cross-sectional studies have failed to detect this association.
The study has limitations. The assessment of the physical abnormalities of lipodystrophy was not possible, because assessment of the phenotypic manifestations of lipodystrophy with physical examinations is inherently subjective and may difer among diferent providers. In addition, sex diferences in growth and body composition in children in response to infection have been described39.
The study design does not permit any conclusions regarding whether PI alone may be associated with dyslipidemia or whether a potentiating effect occurs when combining PI with nucleoside inhibitors. Processes that lead to changes in metabolic parameters are likely to be multifactor, and dyslipidemia occurs in patients who have never received PI57-59. Furthermore, the fact that patients
were not randomized to PI therapy and that the study was based on a small number of HIV-infected children must be taken into account.
Since body composition shows a wide variation in growing children according to age, sex and pubertal status, inter-individual variability was minimized by comparing each HIV-infected patient with a matched healthy control. In addition, each child was used as his or her own control by capturing data ater twelve months follow-up.
Further studies, mainly longitudinal cohort studies, are required to precisely describe the time course of body-composition changes in HIV-infected children and, because they will probably survive for longer periods in adulthood, the long-term risks for the development of premature cardiovascular disease atributable to prolonged dyslipidemia associated with antiretroviral therapy warrant additional studies.
ACKNOWLEDGMENTS
he authors declare that there is no conlict of interest. CONFLICT OF INTEREST
FINANCIAL SUPPORT
REFERENCES
The authors would like to state that the coauthors have contributed to the conception and design of the study, generation, collection, assembly, analysis and interpretation of data, and to the revision and inal version of the manuscript.
UNESCO, Ministério da Saúde - Secretaria de Vigilância em Saúde - Departamento de DST, Aids e Hepatites Virais - PN-DST/ AIDS; Unidade de Pesquisa e Desenvolvimento Tecnológico.
1. Gortmaker S, Hughes M, Cervia J, Brady M, Johnson G, Seage G, et al. Efect of Combination herapy Including Protease Inhibitors on Mortality Among Children and Adolescents Infected with HIV-1. N Engl J Med 2001; 345:1522-1528. 2. Carr A, Samaras K, horisdotir A, Kaufmann GR, Chisholm DJ, Cooper DA. Diagnosis, prediction, and natural course of HIV-1 protease-inhibitor-associated lipodystrophy, hyperlipidaemia, and diabetes mellitus: a cohort study. Lancet 1999; 353:2093-2099.
3. Mauss S. HIV-associated lipodystrophy syndrome. AIDS 2000; 14:S197-S207. 4. Yanovski JA, Miller KD, Kino T, Friedman TC, Chrousos GP, Tsigos C, et al. Endocrine And Metabolic Evaluation Of Human Immunodeiciency Virus-Infected Patients With Evidence Of Protease Inhibitor-Associated Lipodystrophy. J Clin Endocrinol Metab 1999; 84:1925-1931.
5. Battistini TRB, Sarni RO, Souza FIS, Pitta TS, Fernandes AP, Hix S, et al. Lipodystrophy, lipid proile changes, and low serum retinol and carotenoid levels in children and adolescents with acquired immunodeiciency syndrome. Nutr 2010; 26: 612-616.
6. Sarni ROS, de Souza FIS, Batistini TRB, Pita TS, Fernandes AP, Tardini PC, et al. Lipodystrophy in children and adolescents with acquired immunodeiciency syndrome and its relationship with the antiretroviral therapy employed. J Pediatr. 2009; 85:329-334.
7. National Institute of Health. National Cholesterol Education Program. ATP III Guidelines At-A-Glance Quick Desk Reference. Bethesda, MD: National Heart, Lung, and Blood Institute; 2001.
8. Heymsield SB, Tighe A, Wang ZM. Nutritional assessment by anthropometric and biochemical methods. In: Shils ME, Olson JA, Shike M, editors. Modern
Nutrition in Health and Disease. 8th ed. Philadelphia: Lea & Febiger; 1994. p.
812.
9. Ogden CL, Kuczmarski RJ, Flegal KM, Mei Z, Guo S, Wei R, et al. Center For Disease Control And Prevention 2000 Growth Charts For he United States: Improvements To he 1977 National Center For Health Statistics Version. Pediatrics 2002; 109:45-60.
10. Kushner RF, Schoeller DA. Estimation of total body water by bioelectrical impedance analysis. Am J Clin Nutr 1986; 44:417-424.
11. Heller LS. Nutrition support for children with HIV/AIDS. J Am Diet Assoc 1997; 97:473-474.
12. Center for Disease Control and Prevention. CDC advance data no 314. [Cited
200 December 4]. Available from: www.cdc.gov/.
13. Cardoso MA, Stocco PR. Desenvolvimento de um questionário quantitativo de frequência alimentar em imigrantes japoneses e seus descendentes residentes em São Paulo, Brasil. Cad Saude Publica 2000; 16:107-114.
14. Cardoso MA, Kida AA, Tomita LY, Stocco PR. Reproducibility and validity of a food frequency questionnaire among women of Japanese ancestry living in Brazil. Nut Res 2001; 21:725-733.
15. Maniicat S, Dazord A. Evaluation de la Qualité de Vie de l’enfant: validation d’un questionaire, premier résultats. Neuropsichiatr Enfance Adolesc 1997; 45:106-114.
16. Assumpção Jr FB, Kuczynski E, Sprovieri MH, Aranha EMG. Escala de avaliação de qualidade de vida (AUQEI - Autoquestionnaire qualité de Vie Enfant Imagé): Validade e coniabilidade de uma escala para qualidade de vida em crianças de 4 a 12 anos). Arq Neuropsiquiatr 2000; 58:119-127.
17. Apardi SM, Cuf A, Horlick M, Wan J, Kotler DP. Lipodystrophy in HIV-infected children is associated with high viral load and low CD4+ lymphocyte count and CD4+ lymphocyte percentage at baseline and use of protease inhibitors and stavudine. J Aquir Immune Deic Syndr 2001; 27:30-34.
18. Aldrovandi GM, Lindsey JC, Jacobson DL, Zadzilka A, Sheeran E, Moye J, et al. Morphologic and Metabolic Abnormalities in Vertically HIV-infected Children and Youth. AIDS 2009; 23:661-672.
19. Vigano A, Mora S, Testolin C, Beccio S, Schneider L, Bricalli D, et al. Increased lipodystrophy is associated with increased exposure to highly active antiretroviral therapy in HIV - infected children. JAIDS 2003; 32:482-489.
virus type 1-infected children is associated with a sustained efect on growth. Pediatrics 2002; 109:25.
21. Darasteanu J, Petra S, Luminos M, Mardarescu M. Comparison of two antiretroviral triple combinations including the inhibitors in children infected
with HIV/AIDS. Paper presented at the 3trd International Conference on
Nutrition and HIV infection. 1999; Cannes, France.
22. Mueller BU, Sleasman J, Nelson RP, Smith S, Deutsch PJ, Ju W, et al. A phase I/II study of the protease inhibitor indinavir in children with HIV infection. Pediatrics 1998; 102:101-109.
23. Dollfus C, Vaudre G, Clairon C, Courpotin C. Height and weight growth in HIV infected children treated with antiretroviral combination therapy including protease inhibitors. Paper present at the third international conference on nutrition and HIV infection. 1999; Cannes, France.
24. Chantry C, Hughes M, Alvero C, Cervia J, Hodge J, Borum P, et al. Insulin-Like Growth Factor-1 and Lean Body Mass in HIV-Infected Children. JAIDS 2008; 48:437-443.
25. Miller TL, Mawn BE, Orav EJ, Wilk D, Weinberg GA, Nicchita J, et al. he efect of protease inhibitor therapy on growth and body composition in human immunodeiciency virus type 1-infected children. Pediatrics 2001; 107:1-6. 26. Santos FS, Rangel LGG, Saucedo GP, Rosales GV, Novales MGM.
Hypertriglyceridemia and Hypercholesterolemia in Human Immunodeiciency Virus-1-Infected Children Treated with Protease Inhibitors. Arch Med Res 2006; 37:129-132.
27. Melvin AJ, Lennon S, Mohan KM, Purnell JQ. Metabolic abnormalities in HIV type 1-infected children treated and not treated with protease inhibitors. AIDS Res Hum Retroviruses 2001; 17:1117-1123.
28. Beregszaszi M, Dollfus C, Levine M, Faye M, Deghmoun S, Bellal N, et al. Longitudinal evaluation ad risk factors of lipodystrophy and associated metabolic changes in HIV-infected children. J Acquir Immune Deic Syndr 2005; 40:161-168.
29. Carter RJ, Wiener J, Abrams EJ, Farley J, Nesheim S, Palumbo P, et al. Dyslipidemia among perinatally HIV-infected children enrolled in PACTS-HOPE cohort, 1999-2004: A longitudinal analysis. J Acquir Immune Deic Syndr 2006; 41:453-460.
30. Chantry CJ, Hughes MD, Alvero C, Cervia JS, Meyer WA, Hodge J, et al. Lipid and glucose alteration in HIV-infected children beginning or changing antiretroviral therapy. Pediatrics 2008; 122:129-138.
31. Moye J, Richk C, Kalish LA, Sheon AR, Diaz C, Cooper ER, et al. Natural history of somatic growth in infants born to women infected by human immunodeiciency virus. Woman and infants transmission study group. J Pediatr 1996; 128:58-69.
32. Miller TL, Evans SJ, Orav EJ, Morris V, Mcintosh K, Winter HS. Growth and body composition in children infected with the human immunodeiciency virus -1. Am J Clin Nutr 1993; 7:588-592.
33. Fontana M, Zuin G, Plebani A, Bastoni K, Visconti G, Principi N. Body composition in HIV-infected children: relations with disease progression and survival. Am J Clin Nutr 1999; 69:1282-1286.
34. Frost A, Lang CH, Celato MC. Growth hormone/insulin-like growth factor axis in human immunodeiciency virus-associated disease. Endocrinol 1997; 7:23-31.
35. Ferrando SJ, Rabkin JG, Lin S, Mcelhiney M. Increase in body cell mass and decrease in wasting are associated with increasing potency of anti-retroviral therapy for HIV infection. AIDS Patient Care 2005; 19:216-223.
36. Beau JP, Imboua-Coulibaly L. Body mass index: a prognosis factor among HIV seropositive malnourished children. J Trop Ped 1997; 43:301-303.
37. American Dietetic Association. HIV/AIDS medical nutrition therapy protocol: medical nutrition therapy across the continuum of care. Chicago, IL: American Dietetic Association; 1998.
38. Apardi SM, Cuf PA, Kotler DP, Wang J, Bamji M, Lnge M, et al. Growth velocity, fat-free mass and energy intake are inversely related to viral load in HIV-infected children. J Nutr 2000; 130:2498-2502.
39. Parraga IM, Assis AMO, Prado MS. Gender diferences in growth of school-aged children with schistosomiasis and geohelminth infection. Am J Trop Med Hyg 1996; 55:150-156.
40. Corcoran C, Anderson EJ, Burrows B, Stanley T, Walsh M, Poulos AM, et al. Comparison of total body potassium with other techniques for measuring lean body mass in men and women with AIDS wasting. Am J Clin Nutr 2000; 72:1053-1058.
41. Knox TA, Zafonte-Sanders M, Fields-Gardner C, Moen K, Johansen D, Paton N. Assessment of nutritional status, body composition, and human immunodeiciency virus-associated morphologic changes. Clin Infect Dis 2003; 36:S63-S68.
42. Miller T, Evans S, Orav J. Growth and nutrient intake in HIV-infected children. Clin Res 1992; 40:380.
43. Henderson A, Saavedra JM, Perman JA, Huton N, Livingston A, Yolken RH. Efect of enteral tube feeding on growth of children with symptomatic human immunodeiciency virus infection. J Pediatr Gastroenterol Nutr 1994; 18:429-434.
44. Garvie PA, Lawford J, Banet MS, West RL. Quality of life measurement in paediatric and adolescent populations with HIV: a review of the literature. Child Care Health Dev 2009; 35:440-453.
45. honi GJ, Lalande M, Bachelard G, Vidal P, Maniicat S, Fedou C, et al. Quality of life in HIV-infected children and adolescents under higly active antiretroviral therapy: change over time, efets of age and familial context. Arch Pediatr 2006; 13:130-139.
46. Mueller BU, Nelson RP, Sleasman J, Zuckerman J, Heath-Chiozzi M, Steinberg SM, et al. A Phase I/II Study Of he Protease Inhibitor Ritonavir In Children With Human Immunodeiciency Virus Infection. Pediatrics 1998; 101:335-343. 47. Duiculescu D, Ball E, Mihai E. Inluence of anti-retroviral therapy on growth parameters in HIV-infected children. Paper presented at the third international conference on nutrition and HIV infection. 1999; April 22-25; Cannes, France. 48. Lainka E, Oezbek S, Falck M, Ndagijimana J, Niehues T. Marked dyslipidemia in human immunodeiciency virus-infected children on protease inhibitor-containing antiretroviral therapy. Pediatrics 2002; 110:56.
49. Nadal D, Steiner F, Cheseaux JJ, Lazarevitch CA, Aebi C, Kind C, et al. Long-Term Responses To Treatment Including Ritonavir Or Nelinavir In HIV-1-Infected Children. Infection 2000; 28:287-296.
50. Amaya A, Kozinetz CA, Mcmeans A, Schwarzwald H. Lipodystrophy Syndrome In Human Immunodeiciency Virus-Infected Children. Pediatr Infect Dis J 2000; 21:405-410.
51. Taylor P, Worrel C, Steinberg SM, Hazra R, Jankelevich S, Wood LV. Natural History Of Lipid Abnormalities And Fat Redistribution Among HIV-Infected Children Receiving Long-Term, Protease Inhibitor-Containing, Highly Active Antiretroviral herapy Regimens. Pediatrics 2004; 114:235-242.
52. Werner MLF, Pone MVS, Fonseca VM, Chaves CRMM. Lipodystrophy syndrome and cardiovascular risk factors in children and adolescents infected with HIV/ AIDS receiving highly active antiretroviral therapy. J Pediatr 2010; 86:27-32. 53. Saint-Marc T, Partisani M, Poizot-Martin I, Bruno F, Rouviere O, Lang JM, et
al. A syndrome of peripheral fat wasting (lipodystrophy) in patients receiving long-term nucleoside analogue therapy. AIDS 1999; 13:1659-1667.
54. Dube M, Fenton M. Lipid abnormalities. Clin Infect Dis 2003; 33:S79-S83. 55. Nolan D, Mallal S. Complications associated with NRTI therapy: update on
clinical features and possible pathogenic mechanisms. Antivir her 2004; 9:849-863.
56. Cheseaux JJ, Jotterand V, Aebi C, Gnehm H, Kind C, Nadal D, et al. Hyperlipidemia in HIV-infected children treated with protease inhibitors: relevance for cardiovascular diseases. J Acquir Immune Deic Syndr 2002; 30:288-293.
57. Krause JC, Toye MP, Fisher DJ, Stechenberg BW, Reiter EO, Allen HF. Metabolic abnormalities in human immunodeiciency vírus-infected children: two-year follow-up. J Pediatr Endocrinol Metab. 2009; 22:345-351.
58. Brinkman K, Smeitink JA, Romijin JA, Reiss P. Mitochondrial toxicity induced by nucleoside-analogue reverse transcriptase inhibitors is key factor in the pathogenesis of antiretroviral-therapy-related lipodystrophy. Lancet 1999; 354:1112-1115.