Cop
yright
© ABE&M t
odos os dir
eit
os r
eser
vados
.
Serum levels of retinol binding protein
4 in women with different levels of
adiposity and glucose tolerance
Níveis séricos da proteína carreadora do retinol 4 em mulheres com diferentes níveis de adiposidade e tolerância à glicose
Eleonora Beltrame Comucci1, Ana Carolina Junqueira Vasques1, Bruno Geloneze1, Antonio Ramos Calixto1,
José Carlos Pareja1, Marcos Antonio Tambascia1
ABSTRACT
Objective: Retinol-binding protein 4 (RBP4) is an adipokine responsible for vitamin A (retinol) transportation. Studies associated RBP4 increased levels with severity of type 2 diabetes mel-litus (T2DM) and insulin resistance (IR). The study aimed to quantify RBP4 serum standards in women with a wide range of body mass index (BMI) and glucose tolerance level. Subjects and methods: Cross-sectional study was performed with 139 women divided into three groups: Group 1 (lean-control, n = 45) and Group 2 (obese, n = 53) with normal glucose tolerance and group 3 (obese with T2DM, n = 41), called G1, G2 and G3. Were assessed clinical, biochemical, anthropometric and body composition parameters. Results: According to data analysis, we ob-tained in G1 higher RBP4 levels (104.8 ± 76.8 ng/mL) when compared to G2 (87.9 ± 38 ng/mL) and G3 (72.2 ± 15.6 ng/mL) levels. Also, were found: in G1 positive correlations of RBP4 with BMI (r = 0.253), glycated hemoglobin (r = 0.378) and fasting insulin (r = 0.336); in G2 with glycated hemoglobin (r = 0.489); in G3 with glycated hemoglobin (r = 0.330), fasting glucose (r = 0.463), HOMA-IR (r = 0.481). Conclusions: Although RBP4 have shown lower levels in diabetic and obese, a strong correlation with HOMA-IR index highlights that, in our study, there is growing IR when there is an increasing in RBP4 levels. Arq Bras Endocrinol Metab. 2014;58(7):709-14
Keywords
Obesity; metabolic syndrome; insulin resistance; women; premenopause RESUMO
Objetivo: A proteína carreadora do retinol 4 (RBP4) é uma adipocina responsável pelo transpor-te de vitamina A (retinol). Estudos associam os níveis aumentados de RBP4 com a gravidade do diabetes melito tipo 2 (DM2) e resistência à insulina (RI). O objetivo deste estudo foi investigar como esses níveis se comportam em mulheres com ampla variação do índice de massa cor-poral (IMC) e tolerância à glicose. Sujeitos e métodos: Estudo transversal realizado com 139 mulheres, divididas em três grupos: Grupo 1 (controles-magras; n = 45) e Grupo 2 (obesas; n = 53), com tolerância normal à glicose; Grupo 3 (obesas DM2; n = 41), denominados G1, G2 e G3. Foram avaliados parâmetros clínicos, bioquímicos, antropométricos e composição corporal. Resultados: De acordo com a análise dos dados, obtivemos em G1 maiores níveis de RBP4 (104,8 ± 76,8 ng/mL) em comparação ao G2 (87,9 ± 38 ng/mL) e G3 (72,2 ± 15,6 ng/mL). Também foram encontradas correlações positivas entre RBP4 e IMC (r = 0,253), hemoglobina glicada (r = 0,378) e insulinemia de jejum (r = 0,336); em G2 com hemoglobina glicada (r = 0,489); G3 com hemoglobina glicada (r = 0,330), insulinemia de jejum (r = 0,463) e HOMA-IR (r = 0,481). Con-clusões: Embora a RBP4 tenha apresentado níveis menores em pacientes diabéticas e obesas, a forte correlação com o índice HOMA-IR deixa claro que, em nosso estudo, há crescente RI quando os níveis dessa proteína também são crescentes. Arq Bras Endocrinol Metab. 2014;58(7):709-14 Descritores
Obesidade; síndrome metabólica; resistência à insulina; mulheres; pré-menopausa
1 Laboratory of Investigation on Metabolism and Diabetes (Limed), Department of Internal Medicine, Faculty of Medical Sciences, State University of Campinas (Unicamp), Campinas, SP, Brazil
Correspondence to:
Eleonora Beltrame Comucci Laboratório de Investigação em Metabolismo e Diabetes, Universidade Estadual de Campinas, Rua Carlos Chagas, 420
Cidade Universitária “Zeferino Vaz” 13081-970 – Campinas, SP, Brazil [email protected] Received on Oct/17/2012 Accepted on July/30/2014
Cop
yright
© ABE&M t
odos os dir
eit
os r
eser
vados
.
INTRODUCTION
T
he complex pathogenesis linking obesity, type 2diabetes mellitus (T2DM), hypertension and dys-lipidemia involve mechanisms ranging from increased insulin resistance (IR) through adipocytes production of pro-inlammatory and pro-oxidants factors. Adipo-se tissue is the largest endocrine organ of human body which regulates glucose homeostasis, steroid produc-tion, immune system acproduc-tion, hematopoietic and re-productive function. Despite a strong epidemiological association, overweight does not explain itself T2DM development (1-7).
Adipokines are cytokines produced and secreted by adipose tissue. Many studies have suggested a central role of this endocrine organ predominantly in routes of fat storage and insulin action. Adipokines have been suggested as good markers of metabolic syndrome and unregulated production of these cytokines may change metabolic homeostasis, insulin sensitivity, immune res-ponse and cardiovascular disease (8). Retinol binding protein 4 (RBP4) is an adipokine with recent discovery, reported by contributing to the IR and T2DM, belongs to lipocalins family and transports vitamin A (retinol) from liver to peripheral tissues. The protein encoder gene is located on chromosome 10 (10q23.33) near re-gions encoding genes linked to increased levels of fast-ing glucose, such as gene TCF7L2 (10q25.3) which controls CREB and Fox01 genes (9-12).
Liver is responsible for major seric output of RBP4, followed by adipose tissue which expresses 20% to 40% of liver expression. The exact physiological function of adipocyte-derived RBP4 is unclear. A recent study has shown that vitamin A and its metabolites regulate adi-pogenesis. RBP4 production is elevated in animal mo-dels with severe IR (GLUT4 knockout only in adipose tissue), resulting in up-regulation of RBP4 expression and hyperglycemia by the interference of insulin signal-ing (13-15).
RBP4 serum levels are elevated in subjects with im-paired glucose tolerance, T2DM and inversely correla-ted with insulin sensitivity in non-diabetic subjects with familial history of T2DM. RBP4 levels correlate with degree of IR in those subjects, and this relation is dependent of obesity (16-25). In addition to lower
in-sulin sensitivity, a negative effect on secretion of β-cells
caused by RBP4 is suggested. On the other hand, there is a variety of recent studies that did not ind in RBP4 an accurate biomarker of IR and MS in diabetic or nor-mal subjects (26-28).
The study aimed to quantify RBP4 serum standards in women with a wide range of body mass index (BMI) and glucose tolerance level.
SUBJECTS AND METHODS
Study design
A cross-sectional study was conducted at the Labo-ratory of Investigation on Metabolism and Diabetes (LIMED) – State University of Campinas – Brazil.
Sample
A total of 139 women were assessed and divided into three groups: Group 1 (Lean-control, n = 45), Group 2 (obese, n = 53), both with normal glucose tolerance, and Group 3 (obese with T2DM, n = 41), called G1, G2 and G3. T2DM was diagnosed according to the American Diabetes Association criteria.
The inclusion criteria were age over 20 years old, premenopause and negative islet autoimmunity. The exclusion criteria were use of incretin mimetics, dipep-tidyl peptidase-4 inhibitors or insulin; signiicant kid-ney or liver dysfunction; recent neoplasia (< 5 years); and use of oral or injectable corticosteroids for more than 14 consecutive days in the last 3 months.
This study was approved by Ethics Committee of Faculty of Medical Sciences of State University of Campinas, Brazil. All participants provided written in-formed consent before participation.
Anthropometrical and body composition assessment
Cop
yright
© ABE&M t
odos os dir
eit
os r
eser
vados
.
Assays
Plasma glucose levels were promptly measured in fas-ting state using a glucose analyzer (YSI 2700; YSI Life Sciences, Yellow Spring, OH, USA) with a CV of 2%. Glycated hemoglobin was measured with high-perfor-mance liquid chromatography (HPLC). Plasma insulin was analyzed using an automated two-site chemilu-minescent immunometric assay (Immulite 1000 Sys-tem; Siemens Health Diagnostics, USA). Intra-assay and inter-assay variation coeficients were 5.2-6.4% and 5.9-8.0%. Total cholesterol, HDL cholesterol, tri-glycerides, were measured by enzymatic colorimetric method. LDL cholesterol levels were calculated using Friedewald method. RBP4 was measured in duplicate by ELISA (Phoenix Pharmaceuticals, Inc.). For statis-tical analysis we considered the mean of two values ob-tained. Variation coeficients intra and inter-assay were 4.5% and 7%, respectively.
Insulin resistance assessment
Insulin resistance was measured using HOMA-IR (Ho-meostasis Model Assessment – Insulin Resistance) (Fi-gure 1):
(BMI and body fat percentage), patients within G3 had larger waist circumferences and larger SAD than those within G2 (p < 0.001), indicating increased central fat distribution. As expected, G3 presented elevated levels of glycated hemoglobin and fasting glucose compared to G1 and G2. Fasting insulin was similar among G2 and G3, and augmented compared to G1 (p < 0.001). HOMA-IR presented increased levels across three study groups, G1 < G2 < G3 (p < 0.001). Levels of total cholesterol and LDL-choleste-rol, did not differ among groups, however, levels of HDL-cholesterol were augmented and levels of tri-glycerides were diminished in G1 and G2 compared to G3 (p < 0.05) (Table 1). In G3, RBP4 levels were lower when compared to G1 (p < 0.05) and similar to G2 (Figure 2).
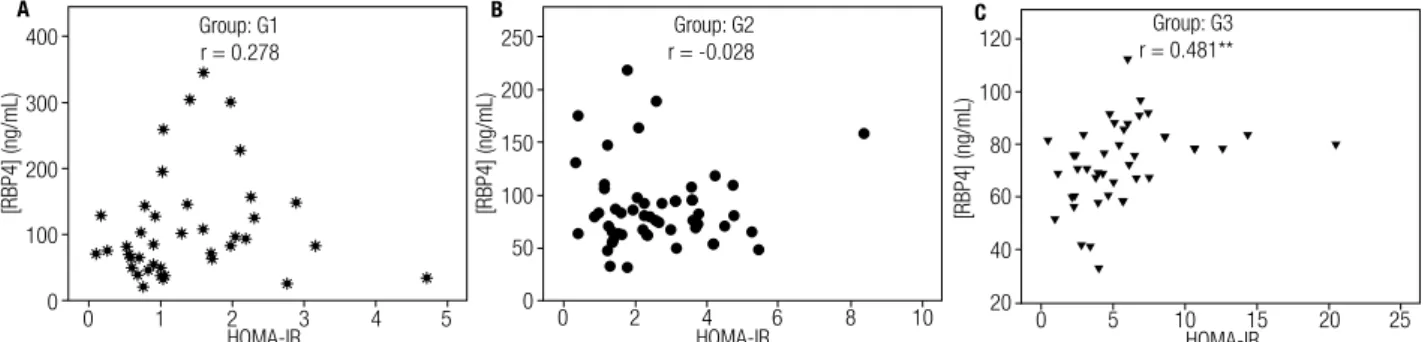
In G1, serum RBP4 correlated positively with BMI (r = 0.253), glycated hemoglobin (r = 0.378) and fasting insulin (r = 0.336) (p < 0.05); in G2, serum RBP4 correlated positively with glycated hemoglobin (r = 0.489; p < 0.01) and in G3 serum RBP4 corre-lated positively with glycated hemoglobin (r = 0.330; p < 0.05), fasting glucose (r = 0.463), HOMA-IR (r = 0.481), (p < 0.01) (Figure 3C).
DISCUSSION
The main inds of present study were: 1) Serum RBP4 levels were diminished in obese patients with T2DM (G3), compared to patients without T2DM (G2) and controls (G1). The last two groups had statistically equal results; 2) BMI was positively correlated with RBP4 levels in G1, although anthropometric indicators of central fat accumulation (waist circumference and SAD) did not correlate with RBP4; 3) Glycated hemo-globin was consistently positive correlated with RBP4 levels in all studied groups; 4) RBP4 levels correlated with HOMA-IR in G3, demonstrating that this adi-pokine igures as a marker of IR in patients with obesity and T2DM.
1) Serum RBP4 levels were diminished in obese pa-tients with T2DM (G3) compared to papa-tients without T2DM (G2), and without T2DM and obesity (G1).
There seems to be a number of factors interfering with correlations and that should be considered when interpreting results. Furthermore, genetic differences in proile of studied populations, relationships among gender and age, have an important role in interpreta-tion and comparison of data obtained (21).
Figure 1. HOMA-IR formula.
HOMA-IR = Fasting insulin (mU/L) x Fasting glucose (mmoI/L)
22,5
Statistical analysis
Statistical analysis were performed using SPSS 20.0 (Chicago, IL, USA). In descriptive analysis, continuous variables were described using measures of central ten-dency and dispersion. Kolmogorov-Smirnov test was used to assess normality of distribution of variables. The comparison among three study groups (G1, G2 and G3) was performed applying Kruskal Wallis test. In situations where there was a statistically signiicant difference was used post-hoc Bonferroni test to identify which groups differed. Correlations among study varia-ble RBP4 with other anthropometric parameters, body composition and metabolism were analyzed by Spear-man correlation test. The level of signiicance as a basis for decision was less than 5% (p < 0.05).
RESULTS
Cop
yright
© ABE&M t
odos os dir
eit
os r
eser
vados
.
Table 1. Clinical and metabolic characteristics of the three groups of patients studied
G1 Lean controls
(n = 45)
G2 Obese (n = 53)
G3 T2DM obese
(n = 41) p-value
Mean ± SD
Age (years) 37a ± 7.5 39a.b ± 7.0 43b ± 7.0 0.003
BMI (kg/m²) 24.3a ± 2.4 35.6b ± 4.6 37.0b ± 4.5 0.001
Waist circumference (cm) 85.9a ± 7.4 107.8b ± 10.2 115.9c ± 10.0 0.001
SAD (cm) 18.4a ± 1.8 24.0b ± 2.9 26.0c ± 2.9 0.001
Body fat (kg) 31.8a ± 3.7 40.7b ± 3.9 40.7b ± 3.5 0.001
[RBP4] (ng/mL) 104.8a ± 76.8 87.9a,b ± 38.0 72.2b ± 15.6 0.178
Glycated hemoglobin (%) 5.2a ± 0.88 5.5a ± 0.91 7.6b ± 2.07 0.001
Fasting insulin (mU/I) 6.9a ± 4.2 12.7b ± 7.5 14.6b ± 11.3 0.001
Fasting plasma glucose (mg/dL) 78.7a ± 8.6 82.2a ± 10.9 147.7b ± 66.9 0.001
HOMA-IR 1.3a ± 0.8 2.5b ± 1.5 5.0c ± 3.6 0.001
Total cholesterol (mg/dL) 183a ± 33.6 191a ± 41.7 183a ± 38.5 0.595
HDL cholesterol (mg/dL) 54a ± 11.0 50a ± 12.7 39b ± 9.2 0.001
LDL cholesterol (mg/dL) 110a ± 31.1 121a ± 34.7 108a ± 33.3 0.220
Triglycerides (mg/dL) 94a ± 56.6 118a ± 71.0 193b ± 191.4 0.001
Note: values in the same row and subtable who do not share the same subscript are signiicantly different at p < 0.05 (Bonferroni test).
BMI: body mass index; SAD: sagittal abdominal diameter; RBP4: retinol binding protein 4; HOMA-IR: Homeostasis Model Assessment – Insulin Resistance among.
A
400 Group: G1 r = 0.278
Group: G2 r = -0.028
Group: G3 r = 0.481**
0 1 2 3 4 5
HOMA-IR HOMA-IR
300
200
100
0
[RBP4] (ng/mL)
B
[RBP4] (ng/mL)
C
[RBP4] (ng/mL)
250
200
150
100
50
0
120
100
80
60
40
20
0 5 10 15 20 25 HOMA-IR
0 2 4 6 8 10
Figure 2. Correlation among serum RBP4 levels with HOMA-IR index in three HOMA-IR groups of patients studied. (A) lean controls; (B) obese; (C) T2DM obese.
200
[RBP4] (ng/mL)
150 a
a.b
b 100
50
0
G1 G2 Grupo
G3
Figure 3. Levels of RBP4 in three groups. a and b represent groups that differed statistically at p < 0.05 (Bonferroni test).
* Correlation is signiicant at p < 0.05 (two-tailed); ** Correlation is signiicant at p < 0.01 (two-tailed).
G1 and G3 differed signiicantly in age, which prob-ably relects in levels of RBP4. There was a positive cor-relation (p < 0.05) among age and levels of RBP4 in G2. No gender difference was analyzed since the study included only women in menacme period.
2) Although BMI was positively correlated with RBP4 levels in G1, anthropometric indicators of cen-tral fat accumulation (waist circumference and SAD) did not correlate with RBP4.
Cop
yright
© ABE&M t
odos os dir
eit
os r
eser
vados
.
3) Glycated hemoglobin was consistently correlated with RBP4 levels in all studied groups.
Our indings show that glycated hemoglobin le vels were signiicantly correlated in all groups with levels of RBP4. While when we evaluated fasting glucose there was no such trend in G1 and G2, groups without T2DM.
In G3, whose fasting glucose is greater than in other groups, there was a strong positive correlation following the tendency of increased glycated hemoglo-bin levels. This inding, in particular, conirms existing literature (7), higher was the level of RBP4 in obese diabetic more correlated with levels of fasting glucose and glycated hemoglobin, perhaps because RBP4 gene encoder is located very near genes linked to obesity and T2DM.
4) RBP4 levels correlated with HOMA-IR in G3, demonstrating this adipokine igures as a marker of IR in patients with obesity and T2DM.
The RBP4 is an adipokine consistently associated with IR in animal models (knockout only for GLUT4 receptor in adipose tissue) and was also considered a promising adipokine in humans, possibly linking adi-posity, IR, T2DM and certain components of the meta-bolic syndrome (11,31).
Retinol binding protein 4 seems to be involved in early phases of IR development and other metabolic syndrome components. Therefore, longitudinal stu-dies are needed to investigate how change will occur in RBP4 levels especially in children and adolescents predisposed to these conditions.
The study of RBP4 must be extensive, due to va-rious sources and polymorphisms in genes encoding this protein and genes encoding one of its receptors.
In this study we found a positive correlation among RBP4 levels and some biochemical parameters. Ho-wever, in several clinical studies, associations and/or causality of changes in the expression of RBP4 were not demonstrated (21).
Limitations of study
Methodological differences in sample collection and determination of RBP4 levels should be considered. Studies showed there is a variation in protein quantii-cation according to used methods (21).
Other interfering factors, such as levels of retinol, iron and even renal function appear to be important and should be investigated in future studies (18).
Deeper studies, using other research methods with human adipocytes, are necessary to reveal how secre-tion and regulasecre-tion of RBP4 expression works and its self-paracrine effect.
Differences in results of this study regarding others can also be caused by different methods of RBP4 quan-tiication.
CONCLUSIONS
In our study, unexpectedly, the levels of RBP4 were re-duced in patients with both obesity and T2DM com-pared to patients without obesity and T2DM. On the other hand, consistently thorough the three groups, RPB-4 was positively and strongly correlated with gly-cated hemoglobin and with IR in the G3.
This apparent discrepancy, also demonstrated by other studies, may be explained by the interference of other factors (assay technique, genetic variations, levels of retinol, iron and even renal function), or metabolic control degree.
Acknowledgements: we thank Fundação de Amparo à Pesquisa do
Estado de São Paulo (Fapesp) and Coordenação de Aperfeiçoamen-to de Pessoal de Nível Superior (Capes) for their inancial support.
Disclosure: no potential conlict of interest relevant to this article was reported.
REFERENCES
1. Kahn SE, Prigeon RL, Schwartz RS, Fujimoto WY, Knopp RH, Brun-zell JD, et al. Obesity, body fat distribution, insulin sensitivity and Islet beta-cell function as explanations for metabolic diversity. J Nutr. 2001;131(2):354S-60S.
2. Kahn SE, Hull RL, Utzschneider KM. Mechanisms linking obesity to insulin resistance and type 2 diabetes. Nature. 2006;444(7121):840-6.
3. Kershaw EE, Flier JS. Adipose tissue as an endocrine organ. J Clin Endocrinol Metab. 2004;89(6):2548-56.
4. Després JP. Body fat distribution and risk of cardiovascular disea-se: an update. Circulation. 2012;126(10):1301-13.
5. Vague J. Les Obésités: etudes biométriques. Press Medical. 1947;(30):339.
6. Sjöström CD, Håkangård AC, Lissner L, Sjöström L. Body com-partment and subcutaneous adipose tissue distribution--risk fac-tor patterns in obese subjects. Obes Res. 1995;3(1):9-22. 7. Ravussin E, Smith SR. Increased fat intake, impaired fat
oxida-tion, and failure of fat cell proliferation result in ectopic fat stora-ge, insulin resistance, and type 2 diabetes mellitus. Ann N Y Acad Sci. 2002;967:363-78.
8. Trayhurn P, Wood IS. Adipokines: inlammation and the pleiotro-pic role of white adipose tissue. Br J Nutr. 2004;92(3):347-55. 9. Berg AH, Scherer PE. Adipose tissue, inlammation, and
Cop
yright
© ABE&M t
odos os dir
eit
os r
eser
vados
.
10. Fantuzzi G. Cytokines: pulling the body together as a whole. ScientiicWorldJournal. 2011;11:2506-8.
11. Colantuoni V, Romano V, Bensi G, Santoro C, Costanzo F, Rau-gei G, et al. Cloning and sequencing of a full length cDNA co-ding for human retinol-binco-ding protein. Nucleic Acids Res. 1983;11(22):7769-76.
12. Oh KJ, Park J, Kim SS, Oh H, Choi CS, Koo SH. TCF7L2 modu-lates glucose homeostasis by regulating CREB- and FoxO1--dependent transcriptional pathway in the liver. PLoS Genet. 2012;8(9):e1002986.
13. Gnudi L, Shepherd PR, Kahn BB. Over-expression of GLUT4 se-lectively in adipose tissue in transgenic mice: implications for nu-trient partitioning. Proc Nutr Soc. 1996;55(1B):191-9.
14. Villarroya F, Iglesias R, Giralt M. Retinoids and retinoid receptors in the control of energy balance: novel pharmacological strate-gies in obesity and diabetes. Curr Med Chem. 2004;11:795-805. 15. Ziouzenkova O, Orasanu G, Sharlach M, Akiyama TE, Berger JP,
Viereck J, et al. Retinaldehyde represses adipogenesis and diet--induced obesity. Nat Med. 2007;13(6):695-702.
16. Yang Q, Graham TE, Mody N, Preitner F, Peroni OD, Zabolotny JM, et al. Serum retinol binding protein 4 contributes to insulin resistan-ce in obesity and type 2 diabetes. Nature. 2005;436(7049):356-62. 17. Basualdo CG, Wein EE, Basu TK. Vitamin A (retinol) status of irst
nation adults with non-insulin-dependent diabetes mellitus. J Am Coll Nutr. 1997;16(1):39-45.
18. Abahusain MA, Wright J, Dickerson JW, de Vol EB. Retinol, al-pha-tocopherol and carotenoids in diabetes. Eur J Clin Nutr. 1999;53(8):630-5.
19. Klöting N, Fasshauer M, Dietrich A, Kovacs P, Schön MR, Kern M, et al. Insulin-sensitive obesity. Am J Physiol Endocrinol Metab. 2010;299(3):E506-15.
20. Graham TE, Yang Q, Blüher M, Hammarstedt A, Ciaraldi TP, Henry RR, et al. Retinol-binding protein 4 and insulin resistance in lean, obese, and diabetic subjects. N Engl J Med. 2006;354(24):2552-63. 21. Kotnik P, Fischer-Posovszky P, Wabitsch M. RBP4: a controversial
adipokine. Eur J Endocrinol. 2011;165(5):703-11.
22. Munkhtulga L, Nagashima S, Nakayama K, Utsumi N, Yanagisawa Y, Gotoh T, et al. Regulatory SNP in the RBP4 gene modiied the expression in adipocytes and associated with BMI. Obesity (Sil-ver Spring). 2010;18(5):1006-14.
23. Kovacs P, Geyer M, Berndt J, Klöting N, Graham TE, Böttcher Y, et al. Effects of genetic variation in the human retinol binding protein-4 gene (RBP4) on insulin resistance and fat depot-speciic mRNA expression. Diabetes. 2007;56(12):3095-100.
24. Munkhtulga L, Nakayama K, Utsumi N, Yanagisawa Y, Gotoh T, Omi T, et al. Identiication of a regulatory SNP in the retinol bin-ding protein 4 gene associated with type 2 diabetes in Mongolia. Hum Genet. 2007;120(6):879-88.
25. Craig RL, Chu WS, Elbein SC. Retinol binding protein 4 as a candi-date gene for type 2 diabetes and prediabetic intermediate traits. Mol Genet Metab. 2007;90(3):338-44.
26. Santoro N, Perrone L, Cirillo G, Brienza C, Grandone A, Cresta N, et al. Variations of retinol binding protein 4 levels are not associa-ted with changes in insulin resistance during puberty. J Endocri-nol Invest. 2009;32(5):411-4.
27. Ulgen F, Herder C, Kühn MC, Willenberg HS, Schott M, Scher-baum WA, et al. Association of serum levels of retinol-binding protein 4 with male sex but not with insulin resistance in obese patients. Arch Physiol Biochem. 2010;116(2):57-62.
28. Henze A, Frey SK, Raila J, Tepel M, Scholze A, Pfeiffer AF, et al. Evidence that kidney function but not type 2 diabetes de-termines retinol-binding protein 4 serum levels. Diabetes. 2008;57(12):3323-6.
29. Lukaski HC, Bolonchuk WW, Hall CB, Siders WA. Validation of te-trapolar bioelectrical impedance method to assess human body composition. J Appl Physiol (1985). 1986;60(4):1327-32.
30. Matthews DR, Hosker JP, Rudenski AS, Naylor BA, Treacher DF, Turner RC. Homeostasis model assessment: insulin resistance and beta-cell function from fasting plasma glucose and insulin concentrations in man. Diabetologia. 1985;28(7):412-9.