CASPASE-3 and CD-34 expression in prostate adenocarcinoma
CASPASE-3 and CD-34 expression in prostate adenocarcinoma
CASPASE-3 and CD-34 expression in prostate adenocarcinoma
CASPASE-3 and CD-34 expression in prostate adenocarcinoma
CASPASE-3 and CD-34 expression in prostate adenocarcinoma
Expressão da CASPASE-3 e CD-34 no adenocarcinoma de próstata
Expressão da CASPASE-3 e CD-34 no adenocarcinoma de próstata
Expressão da CASPASE-3 e CD-34 no adenocarcinoma de próstata
Expressão da CASPASE-3 e CD-34 no adenocarcinoma de próstata
Expressão da CASPASE-3 e CD-34 no adenocarcinoma de próstata
VICENTE PAULODA MOTTA1; OSVALDO MALAFAIA, ECBC-PR2; JURANDIR MARCONDES RIBAS-FILHO, TCBCPR2; NICOLAU GREGORI CZECZKO,
TCBC-PR2; CARMEN AUSTRÁLIA PAREDES MARCONDES RIBAS2; RONALDO MÁFIA CUENCA, TCBC-DF2
A B S T R A C T A B S T R A C T A B S T R A C T A B S T R A C T A B S T R A C T
Objective: Objective: Objective: Objective:
Objective: 1. To evaluate the percentage of caspase-3 and CD-34 expression on adenocarcinoma; 2. to quantify caspase-3 and CD-34 in tumor cells; 3. to verify the relationship between biomarkers and its malignancy; 4. to correlate biomarkers themselves. Methods:
Methods: Methods: Methods:
Methods: Thirty-eight human malignant prostate specimens, Gleason’s score, were immunohistochemically stained for caspase-3 and CD-34 protein. Quantification was done under Samba 4000 Immuno System reading, yielding two variables: label index and optical density. Statistical analyses were based on cross-methods involving univariate and bivariate as well as correlation factors among independent variables. Results:Results:Results:Results:Results: Immunostaining was revealed in 25 plates for caspase-3 and 34 for CD-34. Caspase-3 expression for label index was over 50 in 76%, while for optical density was below 50 in 96%. CD-34 expression demonstrated label index over 50 in 59% and optical density below 50 in 56%. Correlation among expression and severity did not demonstrate to be statistically significant. There was no correlation between protein expression and Gleason´s score. Conclusion:Conclusion:Conclusion:Conclusion:Conclusion: 1. Caspase-3 and CD-34 were present respectively in 73.5% and 100% of samples; 2. caspase-3 and CD-34 showed high expression regarding label index and low expression in optical density; 3. there was no statistical significance among expressions and tumor severity according to Gleason´s score; 4. no significant correlation could be set between the biomarkers themselves.
Key words: Key words: Key words: Key words:
Key words: Caspase 3. Antigens, CD34. Cytophotometry. Immunohistochemistry. Adenocarcinoma. Prostatic neoplasms.
Study conducted for the Programa de Pós Graduação em Princípios da Cirurgia e Instituto de Pesquisas Médicas do Hospital Evangélico Universitário de Curitiba/ Faculdade Evangélica do Paraná – Curitiba – PR – BR.
1. Master, Principles of Surgery Graduate Program, Evangelical Medical School, Curitiba, Paraná, Brazil; 2. PhD, Full Professor, Post-Graduate Program, Evangelical Medical School, Curitiba, Paraná, Brazil.
INTRODUCTION
INTRODUCTION
INTRODUCTION
INTRODUCTION
INTRODUCTION
T
he differentiation between tumors that will develop into metastatic disease from those that will present a slow and controllable evolution represents a challenge to researchers 1.Molecular pathogenesis and prostate cancer progression remain not well known. Genetics-molecular mechanisms have been implicated in prostate tumorigenesis and disease evolution. In habitual progression, cell cycle presents a sequence of events that duplicates cell components and later splits into two cells. During cancer evolution, an uncontrollable multiplication process takes place in the cells due to the respective mutations occurred initially.
Tumor biomarkers consist in biochemical indicators of tumor existence, including cell-surface antigens, cytoplasm proteins, enzymes, and hormones. Programmed cell death, known as apoptosis, and angiogenesis present strong correlation with carcinogenesis intensity 2. Biomarkers
studying in such conditions became important coadjuvants in diagnostic research, tumor progression, and cancer treatment. Such markers are included in prognostic factors for prostate carcinoma category III, according to American Pathologist Consensus 3, described as all other factors not
well enough studied to show their prognostic value.
Programmed cell death markers, such as cysteine protease protein 32, known as caspase-3, responsible for proteolytic cleavage of various proteins, have been studied using paraffin specimens made of different samples of prostate tumor in order to quantify its expression4.
Loss of apoptotic control in favor of cell proliferation may be responsible for prostate cancer initiation and progression1.
Biomarkers modulating prostate cancer angiogenesis, such as CD-34 antigens expressed in endothelial cells, have been also evaluated through immunohistochemical reading in recent studies 5. New
vessels formation will depend on the interaction among cells themselves and their microenvironment, including endothelial cells, extracellular matrix, and soluble factors6.
Informatics science in the medical field allowed imaging analysis of tumor cells through citophotometry reading, contributing in the diagnosis of neoplasia7.
Computer analysis of histological imaging allows quantifying several protein markers, glycoproteins or glycohistochemical. In this manner, microscopic and mathematical data may be obtained from the analysis; microscope image processing is turned into number, making the statistical analysis elaboration possible.
to evaluate the percentage of caspase-3 and CD-34 expression on tumor cells; 2. to quantify caspase-3 and CD-34 biomarkers in tumor cells; 3. to verify the relationship between biomarkers of the tumor and its malignancy; 4. to correlate biomarkers themselves.
METHODS
METHODS
METHODS
METHODS
METHODS
Human prostate tissues were obtained from 38 patients from Brasília Hospital, Federal District, Brasil. All tumors samples were identified, fixed in formol, and embedded in paraffin. In addition, each paraffin-embedded section was submitted to new microtomy measured 3µm thickness. Following, slides were processed under hematoxylin-eosin staining and reviewed independently by two pathologists for histopathological report and included in the study. Four blocks were eliminated: histopathological confirmation of prostate adenocarcinoma diagnosis was not confirmed in three of them and Gleason´s score was not determined in one block.
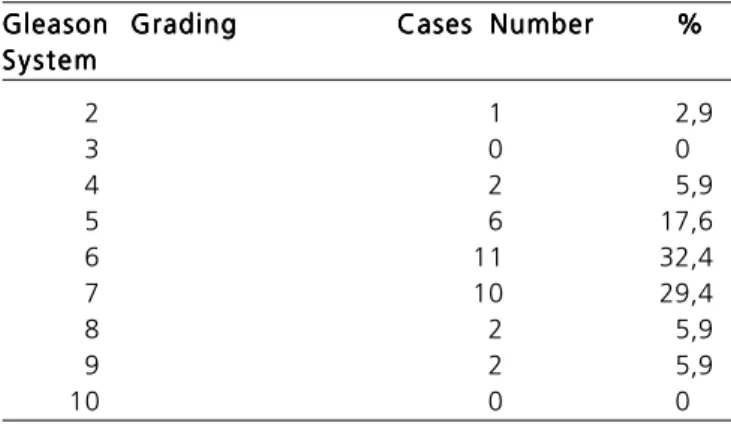
The slides were classified according to Gleason grading system that describes tumor infiltration and differentiation, showing that 79,4% was considered maligancy ranging from 5 to 7 (Table 1).
Immunohistochemical process followed the ha-bitual slides preparation. Caspase-3 and CD-34 immunoexpressions were obtained by streptavidin–biotin– peroxidase complex. Process was realized in steps. At first, the procedures started by histological sectioning of 3ìm a 5ìm from paraffin-embedded material. The slices were placed in identified slides. For paraffin fragmentation, the material was incubated at 37°C during nighttime. Deparaffin was carried out under xylol and ethanol washing.
For caspase-3 antibody, antigen recovering was acquired using citrate solution buffer, prepared from the dilution of citric acid and sodium citrate solution in distilled water. After drying, the slides were placed in flasks containing buffer solution and they were warmed. As temperature reached 97°C, time period was counted to 20 minutes. Flasks were then removed and cooled. Following,
the block endogenous peroxidase activity was immersed in 3% hydrogen peroxide.
In order to preserve pH, slices were submitted into buffer solution PBS in 0,2M concentration, obtained by dilution of sodium phosphate monobasic and sodium phosphate dibasic, using tween 20. Utilizing a hydrophobic pen, a circle was drawn around the histological cut. The slides were then incubated with a primary antibody against caspase-3 and/or CD-34, for 18 hours period (overnight).
Washing the slides with distilled water, followed by placing them in PBS buffer solution was done next. Later, Biotin secondary antibody was incubated and placed in PBS buffer solution. Incubation procedure was realized with Streptavidin-HRP, followed by another washing in PBS buffer, when DAB chromogen was added over the slides. Afterwards eosin-heamatoxylin staining was performed; finishing up the process with slides preparation and identification.
Caspase-3 primary antibodies (rabbit polyclonal anti-CPP32 antibody, code number A3537 Biogen, immunoglobulin fraction antiserum from rabbit) and CD-34 (rat monoclonal antibody, clone QBEnd/10, molecular weight105-120kDa, specific binding reaction for humans) were used in the study.
Histological sections were chosen for immunohistochemical analysis from heamatoxylin preparation staining, representing neoplasia and containing no technical artifacts.
Positive immunoexpression cells analysis for antibody anti-caspase-3 and anti-CD-34 was performed under optical microscope using cytophometry through SAM-BA 4000 Cell Image Analysis System, in high concentration field unknown as hotspots.
The image analysis system was composed by video-camera, two monitors, printer, microcomputer, and specific Immuno® software for histological imaging interpretation and analysis. The analyzer system developed by Alcatel (Grenoble, France) stands for Microscope Analysis System by Automatic Scanning (SAMBA 4000).
Initially, system calibration and pattern set were performed in order to utilize the software.
Analogical imaging under the microscope is captured through the camera and sent to the computer. The respective software analyzer allows the computer to form digital points into image (pixels), transforming them in numerical image. Such process grants a value for each point in the image. The light absorbed by the tissue in each segment is quantified. Quantification was expressed by variation gray color scale ranging from zero (black), points without resistance to light beam, to 255 (white), presenting resistance, in other words, where tissue is more dense.
Visual field screening for hotspots location was performed and the reading procedure was conducted in greek bar.
Objective lens 20x were used in number ranging from 3 to 10 fields for each slide in order to identify, in the nucleus and cytoplasm, the apoptosis biomarkers, and in 10 fields for each slide, in order to identify, in the endothelial
Table TableTable Table
Table 1 1 1 1 1 – Frequency and percentage of Gleason grading system in 34 patients presenting prostate neoplasia.
Gleason Grading Gleason GradingGleason Grading Gleason Grading
Gleason Grading Cases NumberCases NumberCases NumberCases NumberCases Number %%%%% S y s t e m
S y s t e mS y s t e m S y s t e m S y s t e m
2 1 2,9
3 0 0
4 2 5,9
5 6 17,6
6 11 32,4
7 10 29,4
8 2 5,9
9 2 5,9
cell membrane, the angiogenesis biomarkers. Total surface extent ranged from 60.000µm2 a 120.000µm2. Reading time
spent for each slide was approximately 40 minutes. Parameters evaluated consisted into two variables for quantifying markers expression: label index and mean optical density. Label index describes the percentage of area marked. Mean optical density comprises the color intensity. Such variable is expressed in absolute number.
Data statistical interpretations were under univariable analysis, calculating the positive biomarkers expression, frequency, and percentage. In the bivariable model, Fisher´s exact test analysis was used to correlate histopathological Gleason´s score (<7 or =7) and biomarkers that were also divided into two groups. First group included values <50, considered low expression and second group, values =50 were considered as high expression. Finally, it was considered the association grade between biomarkers through Spearman rank correlation test, estimating coefficients and verifying its significance.
RESULTS
RESULTS
RESULTS
RESULTS
RESULTS
Thirty-four histopathological patient samples presenting prostate neoplasia were evaluated. All samples were immunostained for caspase-3 and CD-34, obtained positive results in 73,5% and in 100%, respectively (P = 0,002).
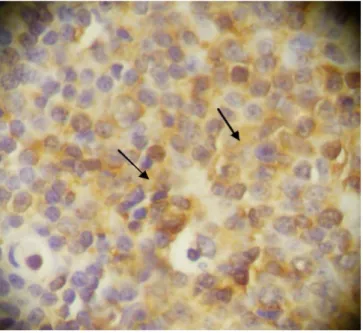
In the caspase-3 marked slides, a chestnut color was observed as for the nucleus as for the cytoplasm stained regions. Blue coloration was noted in non-stained regions (Figure 1).
In the CD-34 marked slides it was observed, in endothelium, the same chestnut color for the stained regions and blue color in non-stained regions (Figure 2).
Label index quantification and optical density obtained for both markers are detailed in Tables 2 and 3. Caspase-3 was considered in intervals of 50, in 25 patients, and CD-34 protein was also considered in intervals of 50, in 34 patients.
Correlation between biomarkers quantification Correlation between biomarkers quantification Correlation between biomarkers quantification Correlation between biomarkers quantification Correlation between biomarkers quantification according to Gleason´s Score
according to Gleason´s Scoreaccording to Gleason´s Score according to Gleason´s Scoreaccording to Gleason´s Score
Table 4 demonstrates the correlation between label index and optical density quantification for caspase-3 marker and both groups of patients defined by two grades according to Gleason´s classification: <7 and =7. None of the correlations was statistical significant (P > 0,05).
Table 5 verifies the correlation between label index and optical density quantification for CD-34 marker and both groups of patients defined by both grades according to Gleason´s score: <7 e =7. None of the correlations was statistical significant (P > 0,05).
In respect to the correlation coefficients between caspase-3 and CD-34, the label index was 0,017 (p=0,936) and optical density was 0,234 (p=0,272) and shows that variables did not present statistical significance between them (P > 0,05).
DISCUSSION
DISCUSSION
DISCUSSION
DISCUSSION
DISCUSSION
Early diagnosis improvements in prostate adenocarcinoma have been looking for new biomarkers due to the limitations uses of PSA as a diagnosis and prognosis marker.
Weidner et al.8 concluded that the discovery of
accurate prognostic indicators that correlate with disease evolution would help to identify patients who might require aggressive therapy. Nowadays, it is well known the genetic origin of prostate neoplasia. Alers et al. 9 confirm the
Figure 1 – Figure 1 –Figure 1 –
Figure 1 –Figure 1 – Photomicrography presenting the high expression caspase-3 pattern in prostate adenocarcinoma grade 6 according to Gleason´s score (400x enlargement). The arrows indicate cells stained by the antibody.
Figure 2 – Figure 2 –Figure 2 –
possibility to document chromosomal alterations associated with prostate cancer staging.
Gleason 10 recommends that, in smaller studies
on prostate cancer or when the objective consist in comparison of tumor “good” and “bad” parameters, would be preferable to separate patients into two groups according to histological final count in <7 or =7. Based on this recommendation, the cut point was also applied in this study for statistical analysis comparison.
Cells have the ability to go under a form of programmed cell death, known as apoptosis and tumor growth is determined by an unbalanced cellular growth and death.
Apoptosis consists in form of programmed cell death in multicellular organisms, mediated by proteolitic enzymes known as caspases responsible for initiating the process of cell death by cleaving specific proteins located in cellular nucleus and cytoplasm. Caspases family is composed of 10 proteins members, being caspase-3 as one of the principles executors of the cellular process.
Caspase-3 has been already demonstrated 11 its
presence in various types of cells. Prostatic epithelial cells are considered to be among cells presenting positive immunoreactivity expression for caspase-3 protein. In the present research, it was verified the presence of caspase-3 in 25 slides from a total of 34 (73,5%). Nevertheless, there is controversial points in literature referring to percentage expression, some demonstrating a lower percentage than the one here presented 12 while others shown expression in
all slides 4.
Caspase-3 quantification was obtained in this study by computer image using Immuno® software, which expressed numerically the label index and optical density. Such a method permitted exclusion of subjective interventional of data analysis. Literature review has shown
that quantifying reports have been obtained in a subjective analysis in most of the cases4. Therefore, in the present
study, the different results observed as compared to literature may be explained by the different quantifying analysis methods used in the recent research.
Relating to correlation between caspase-3 quantification and disease’s severity based on Gleason´s score, the current research did not show significant association. Many studies have been elaborated searching
Table 4 Table 4Table 4 Table 4
Table 4 ––––– Quantifying correlation between caspase-3 marker and Gleason´s Score (<7 and =7).
C A SPA SE-3 C A SPA SE-3C A SPA SE-3 C A SPA SE-3
C A SPA SE-3 GLEASONGLEASON <7GLEASONGLEASONGLEASON <7 <7 <7 <7n n n n n = 13= 13= 13= 13= 13 GLEASONGLEASON =7GLEASONGLEASONGLEASON =7 =7 =7 =7n n n n n = 10= 10= 10= 10= 10 P* P* P* P* P* VALUE VALUE VALUE VALUE VALUE Label index
0-50 3 3 1,0
51-100 10 7
Optical density
0-50 12 10 1,0
51-100 1 0
*Fisher´s exact test.
Table 2 Table 2Table 2 Table 2
Table 2 ––––– Frequency and percentage relating to caspase-3 marker.
C A SPA SE-3 C A SPA SE-3C A SPA SE-3 C A SPA SE-3
C A SPA SE-3 nnnnn %%%%%
Label index
0-50 6 24
51-100 19 76
Optical density
0-50 24 96
51-100 1 4
Table 3 Table 3Table 3 Table 3
Table 3 ––––– Frequency and percentage relating to CD-34 marker.
C D - 3 4 C D - 3 4C D - 3 4 C D - 3 4
C D - 3 4 nnnnn %%%%%
Label index
0-50 14 41
51-100 20 59
Optical density
0-50 19 56
51-100 15 44
Correlação entre a quantificação dos biomarcadores segundo o Escore de Gleason
Table 5 – Table 5 –Table 5 – Table 5 –
Table 5 – Quantifying correlation between CD-34 marker and Gleason´s Score (<7 and =7).
C D - 3 4 C D - 3 4C D - 3 4 C D - 3 4
C D - 3 4 GLEASONGLEASON <7 GLEASONGLEASONGLEASON <7 <7 <7 <7 n n n n = 20n = 20= 20= 20= 20 GLEASONGLEASON =7 GLEASONGLEASONGLEASON =7 =7 =7 =7 n n n n n = 12= 12= 12= 12= 12 P* P* P* P* P* VALUEVALUEVALUEVALUEVALUE Label index
0-50 10 4 0,471
51-100 10 8
Optical density
0-50 11 8 0,71
51-100 9 4
for possible correlations, presenting controversial data about the subject, some describing none correlation present, while others demonstrate the existence of possible association4.
Authors 13 gave some explaining over the conflicting results
obtained from the studies, justifying that the divergences might reside in the amount of antibody used in each study, its concentration, its affinity to the antigen, incubation period, detection system sensibility, and fixation process. Another point to be considered consist in the fact that 79,4% of the analyzed samples in the present study were classified as Gleason´s score 5-7, presenting variable biological behavior. Bostwick et al.3, members of American College
of Pathologists affirmed during the Consensus of 1999 about Prognosis Factors in Prostate Cancer, relating to apoptosis process, the insufficient literature data for elaborating recommendations, justifying the necessity of the researching development over the subject.
Folkman 14 affirmed that angiogenesis, in
neoplasia, consist in a continuous and vigorous process observed in cicatrization or inflammatory processes and, in 1986, reported that solid tumors were not able to grow beyond 1-2 mm without organized vessel formation. Other authors5,13 have demonstrated that in order to promote
tu-mor growth it becomes necessary to have new vessels formation in the tumor area and that the angiogenesis index would become a prognostic factor 8. Such statements justify
the importance of angiogenesis understanding in prostate cancer, as it has been realized in this research, demonstrating the angiogenesis process present in all analyzed slides.
Bigler et al. 15 e Brawer et al. 16 were the
pioneers evaluating microvessels density in prostate tumor, using a computer image analysis system and Siegal et al.17
demonstrated a higher microvessel density in the center of prostate tumor than in the peripheral area, suggesting that angiogenesis promoters present a more intense activity in the center cancer region. The knowledge over the topography of microvessels has its implications in quantifying the angiogenesis process obtained through biopsy samples18,
differing in this study once the samples were obtained from radical prostatectomies.
There are various types of antibodies anti-endothelial cells and different ways to analyze microvessels density. Offersen et al.19 examined two antibodies
anti-endothelial cells (anti-CD-34 and Von Willebrand anti-factor) and two different methods to quantify angiogenesis in prostate cancer: microvessels density and Chalkley. Both methods, when evaluated using anti-CD-34 antibody, demonstrated a better accuracy for this marker, revealing CD-34 to be more sensible than Von Willebrand anti-factor as tumor cell marker. Microvessels counting in the present study based on a computerized system of reading, excluding subject counting, thereby improving data credibility.
Correlation between CD-34 and Gleason´s Correlation between CD-34 and Gleason´s Correlation between CD-34 and Gleason´s Correlation between CD-34 and Gleason´s Correlation between CD-34 and Gleason´s score
scorescore scorescore
Association between angiogenesis and tumor severity has already been investigated by various authors 5,13,15.
In the present research, correlation between antigen tumor expression and its severity grade was not demonstrated. Such results are controversial as compared to literature data review.
Bigler et al.15 revealed greater microvessels
density in prostatic tumors as compared to benign areas, using policlonal antibody Von Willebrand anti-factor. Microvessels image counting utilized digital image from software (Bioscan, Edmonds, WA), a similar method as used in this study. Other authors8 showed, through antibody Von
Willebrand anti-factor, that microvessels density presented in metastatic prostate tumors was significant greater than non-metastatic tumors. Although obtained in hotspots, microvessels counting was conducted in a subjective manner and the greek bar method was not applied, unlike the present study. Salomao et al. 20 noted positive correlation
between microvessels infiltration and Gleason´s score in a study over 210 patients.
Controversial results found in this research could not be explained due to the small population sample under investigation. Weidner et al.8 also presented a small
population sample for study interpretation, composed by only 15 patients. In immunohistochemical analysis, besides the fact that subject counting was performed, different antibody and biomarkers expressions quantification were used, although hotspots analysis has been taken under consideration. In the present investigation, one must considered also the fact that 78% of samples evaluated were considered in medium grade for malignancy, in other words, they were not considered to be completely “good” or “bad” tumors staging, agreeing to some authors description18 about no correlation existence between
pathological grade in prostate adenocarcinoma and Gleason´s scores ranging from 5 to 7. Bostwick et al. 3 affirm
that controversial literature data are justified by the different methods applied and the interpretation inconstancy determined by observers, as well as the reading manner used in the studies (general counting or hotspots). Due to the angiogenesis importance in tumoral biology, authors recommend the development of new studies in order to establish the proper model research pattern and interpretation criteria.
In the current research, label index of tumor markers and optical density evaluation did not show significant correlation. Literature data are not clearly set over the subject, therefore new studies development must be considered in order to define possible relationship.
It has been stated that in normal prostatic epithelium cellular proliferation is balanced by apoptosis process12. The target in an effective therapy would be
correcting such unbalanced growth process. In this manner, it becomes essential the knowledge over apoptosis process and its adequante intervention. Authors
6 affirmed the accurate knowledge in the angiogenesis
effective as monotherapy or in association with radiotherapy, chemotherapy, or immunotherapy, it remains to be determined.
This research with computerized method of biomarker expression using SAMBA 4000 system, according to literature review, is the first trial published. Other authors have described a similar procedure, although different softwares had been applied15,16. The system allowed to
quantify in an easy and fast manner the percentage of marked area and its color intensity, avoiding subjective errors reading.
In conclusion: 1. Caspase-3 and CD-34 biomarkers were present respectively in 73.5% and 100% of the tumor samples; 2. caspase-3 showed high expression regarding label index in 76% of the plates, while demonstrating a low expression in optical density reading in 96% of them; for CD-34 protein, its index label index was high expressive in 59% of the plates, while optical density showed a low expression in 56% of them; 3. no statistical significance was demonstrated among biomarkers expressions and tumor severity according to Gleason´s score; 4. no significant correlation could be set between the biomarkers themselves.
R E S U M O R E S U M O R E S U M O R E S U M O R E S U M O
Objetivo: Objetivo: Objetivo: Objetivo:
Objetivo: 1. Avaliar em qual percentual as células tumorais se marcam com caspase-3 e CD-34; 2. quantificá-los nas células tumorais; 3. verificar correlação entre quantificação e grau de malignidade tumoral; 4. correlacioná-los entre si. MétodosMétodosMétodosMétodosMétodos: Estudaram-se 38 blocos com adenocarcinoma, classificados por Gleason e marcação imunoistoquímica para caspase-3 e CD-34. As proteínas imunomarcadas foram quantificadas no software Immuno do Sistema Samba 4000 de citofotometria de imagem, pelo índice de marcagem e densidade óptica. Resultados:Resultados:Resultados:Resultados:Resultados: Imunomarcou-se 25 lâminas para caspase-3 e 34 para CD-34. As quantificações da caspase-3 para o índice de marcagem foram acima de 50 em 76% e, para densidade óptica, abaixo de 50 para 96%. Em relação ao CD-34, índice de marcagem foi acima de 50 em 59% e densidade óptica abaixo de 50 em 56%. As correlações entre expressões dos marcadores e a gravidade do tumor, assim como entre os marcadores, não evidenciaram significância estatística. Não se mostrou relação de expressão com o score de Gleason. ConclusãoConclusãoConclusãoConclusãoConclusão: 1. A presença caspase-3 e CD-34 foi de 73,5% e 100%, respectivamen-te; 2. caspase-3 e CD-34 apresentaram alta expressão do índice de marcagem, e baixa para densidade óptica; 3. não houve correlação entre as quantificações com a classificação de Gleason; 4. não houve correlação das expressões dos dois marcadores entre si.
Descritores: Descritores: Descritores: Descritores:
Descritores: Caspase 3. Antígenos CD34. Citofotometria. Imunoistoquímica. Adenocarcinoma. Neoplasias da próstata.
REFERENCES
REFERENCES
REFERENCES
REFERENCES
REFERENCES
1. Tu H, Jacobs SC, Borkowski A, Kyprianou N. Incidence of apoptosis and cell proliferation in prostate cancer: relationship with TGF-beta1 and bcl-2 expression. Int J Cancer. 1996; 69(5):357-63. 2. Matsushima H, Goto T, Hosaka Y, Kitamura T, Kawabe K.
Correlation between proliferation, apoptosis, and angiogenesis in prostate carcinoma and their relation to androgen ablation. Cancer. 1999; 85(8):1822-7.
3. Bostwick DG, Grignon DJ, Hammond ME, Amin MB, Cohen M, Crawford D, et al. Prognostic factors in prostate cancer. College of American Pathologists Consensus Statement 1999.Arch Pathol Lab Med. 2000; 124(7):995-1000.
4. Anwar S, Ambros RA, Jennings TA, Ross JS, Beza A, Mian B, et al. Expression of cysteine protease protein 32 in prostatic adenocarcinoma correlates with tumor grade. Arch Pathol Lab Med. 2004; 128(6):649-52.
5. Banerjee AG, Liu J, Yuan Y, Gopalakrishnan VK, Johansson SL, Dinda AK, et al. Expression of biomarkers modulating prostate cancer angiogenesis: differential expression of annexin II in prostate carcinomas from India and USA. Mol Cancer. 2003; 2:34. 6. van Moorselaar RJ, Voest EE. Angiogenesis in prostate cancer: its
role in disease progression and possible therapeutic approaches. Mol Cell Endocrinol. 2002; 197(1-2):239-50.
7. Goddard JC, Sutton CD, Furness PN, Kockelbergh RC, O’Byrne KJ. A computer image analysis system for microvessel density measurement in solid tumours. Angiogenesis. 2002; 5(1-2):15-20. 8. Weidner N, Carroll PR, Flax J, Blumenfeld W, Folkman J. Tumor angiogenesis correlates with metastasis in invasive prostate carci-noma. Am J Pathol. 1993; 143(2):401-9.
9. Alers JC, Rochat J, Krijtenburg PJ, Hop WC, Kranse R, Rosenberg C, et al. Identification of genetic markers for prostatic cancer progression. Lab Invest. 2000; 80(6):931-42.
10. Gleason DF. Histologic grading of prostate cancer: a perspective. Hum Pathol. 1992; 23(3):273-9.
11. Krajewska M, Wang HG, Krajewski S, Zapata JM, Shabaik A, Gascoyne R, et al. Immunohistochemical analysis of in vivo patterns of expression of CPP32 (Caspase-3), a cell death protease. Cancer Res. 1997; 57(8):1605-13.
12. Amirghofran Z, Monabati A, Gholijani N. Apoptosis in prostate cancer: bax correlation with stage. Int J Urol. 2005; 12(4):340-5. 13. Hall MC, Troncoso P, Pollack A, Zhau HY, Zagars GK, Chung LW, et
al. Significance of tumor angiogenesis in clinically localized prostate carcinoma treated with external beam radiotherapy. Urology. 1994; 44(6):869-75.
14. Folkman J. Tumor angiogenesis: therapeutic implications. N Engl J Med. 1971; 285(21):1182-6.
15. Bigler SA, Deering RE, Brawer MK. Comparison of microscopic vascularity in benign and malignant prostate tissue. Hum Pathol. 1993; 24(2):220-6.
16. Brawer MK, Deering RE, Brown M, Preston SD, Bigler SA. Predictors of pathologic stage in prostatic carcinoma. The role of neovascularity. Cancer. 1994; 73(3):678-87.
17. Siegal JA, Yu E, Brawer MK. Topography of neovascularity in human prostate carcinoma. Cancer. 1995; 75(10):2545-51.
18. Silberman MA, Partin AW, Veltri RW, Epstein JI. Tumor angiogenesis correlates with progression after radical prostatectomy but not with pathologic stage in Gleason sum 5 to 7 adenocarcinoma of the prostate. Cancer. 1997; 79(4):772-9.
19. Offersen BV, Borre M, Sørensen FB, Overgaard J. Comparison of methods of microvascular staining and quantification in prostate carcinoma: relevance to prognosis. APMIS. 2002; 110(2):177-85.
Received in 10/10/2008
Accepted for publication in 16/12/2008 Conflict of interest: None
Financial source: Instituto de Pesquisas Médicas (IPEM)– Hospital Uni-versitário Evangélico de Curitiba (HUEC) / Faculdade Evangélica do Paraná (FEPAR) – Curitiba – PR – Brasil.
How to cite: How to cite:How to cite: How to cite:How to cite:
Motta VP,Malafaia O,Ribas-Filho JM,Czeczko NG,Ribas CAP, Cuenca RM. Caspase-3 and cd-34 expression in prostate adenocarcinoma. Rev Col Bras Cir. [periódico na Internet] 2009; 36(3). Disponível em URL: http://www.scielo.br/rcbc
Correspondence address: Correspondence address:Correspondence address: Correspondence address:Correspondence address: Vicente Paulo da Motta