Promoters Architecture-Based Mechanism for
Noise-Induced Oscillations in a Single-Gene
Circuit
N. Guisoni1, D. Monteoliva2, L. Diambra3*
1Instituto de Física de Líquidos y Sistemas Biológicos, Universidad Nacional de La Plata, La Plata, Argentina,2Departamento de Física, Facultad de Ciencias Exactas, Universidad Nacional de La Plata, La Plata, Argentina,3Centro Regional de Estudios Genómicos, Universidad Nacional de La Plata, La Plata, Argentina
Abstract
It is well known that single-gene circuits with negative feedback loop can lead to oscillatory gene expression when they operate with time delay. In order to generate these oscillations many processes can contribute to properly timing such delay. Here we show that the time delay coming from the transitions between internal states of thecis-regulatory system
(CRS) can drive sustained oscillations in an auto-repressive single-gene circuit operating in a small volume like a cell. We found that the cooperative binding of repressor molecules is not mandatory for a oscillatory behavior if there are enough binding sites in the CRS. These oscillations depend on an adequate balance between the CRS kinetic, and the synthesis/ degradation rates of repressor molecules. This finding suggest that the multi-site CRS archi-tecture can play a key role for oscillatory behavior of gene expression. Finally, our results can also help to synthetic biologists on the design of the promoters architecture for new genetic oscillatory circuits.
Introduction
Oscillatory phenomena are an essential feature of biological systems and such behavior is pres-ent at differpres-ent levels of the organization of the living matter (cell, tissues, organs and individu-als). At the intra-cellular level several examples of genes with oscillatory expression are known, whose periods range from*40 minutes in the zebrafish somitogeneses [1] to a day in circa-dian clocks [2]. In general, the mechanism underlying such oscillations is a negative regulatory loop implemented in a gene-protein interaction network. The complexity of such networks vary from highly complex ones, as those described for the cell division cycle, or the circadian rhythm, to the simplest ones which were synthetically implemented in prokaryotic cells [3,4]. In this sense Strickeret al. have shown that a synthetic single-gene circuit is able to display oscillatory behavior [5]. It is well known that time delay serves as a source of instabilities which can lead to oscillations and also to chaotic behavior [6,7]. The dynamical system theory
a11111
OPEN ACCESS
Citation:Guisoni N, Monteoliva D, Diambra L (2016) Promoters Architecture-Based Mechanism for Noise-Induced Oscillations in a Single-Gene Circuit. PLoS ONE 11(3): e0151086. doi:10.1371/journal. pone.0151086
Editor:Ramon Grima, University of Edinburgh, UNITED KINGDOM
Received:January 8, 2016
Accepted:February 23, 2016
Published:March 9, 2016
Copyright:© 2016 Guisoni et al. This is an open access article distributed under the terms of the Creative Commons Attribution License, which permits unrestricted use, distribution, and reproduction in any medium, provided the original author and source are credited.
Data Availability Statement:All relevant data are within the paper and its Supporting Information files.
Funding:The authors have no support or funding to report.
predicts that single-gene circuits with negative feedback loop can exhibit oscillatory gene expression when they operate with an explicit time delay [8–11], or when such time delay is implicit in additional steps representing post-transcriptional events [12,13]. Several processes, such as: transcript elongation, splicing, translocation, translation and phosphorylation, can contribute to generate a proper time delay [14]. The resulting period of the oscillation emerges from the combination of such time consuming processes rather than the sum of the individual delays, because such processes can occur concurrently. Recently, researchers have assessed experimentally the contribution of processes such as transcript elongation [15], splice process-ing [16], and nuclear translocation [17] on the oscillatory behavior. However, the individual impact of such processes on the dynamics of the circuit is not yet fully understood, offering to modelers an opportunity to assess them theoretically. In this paper we show an alternative mechanism able to provide the time delay needed for generate sustained oscillation. This mechanism is based on transitions between internal states of the CRS rather than in post-tran-scriptional events. To examine if this mechanism can generate sustainable oscillationsper se, we devise an autorepressive single-gene loop without explicit time delay nor additional post-transcriptional events. Our analysis show that the proposed mechanism is able to generate oscillations when operates in a stochastic regime, but not in a deterministic scenario where the system exhibits a fixed point. This result suggests that the CRS architecture can constitute a mechanism for noise-induced oscillations (NIO). NIO phenomenon was first reported associ-ated with stable focus by McKane and Newman [18]. NIO was also reported in a chain of downstream-coupled Brusselators [19]. Furthermore, Toneret al. have recently shown that intrinsic chemical fluctuations can also induce concentration oscillations in systems whose deterministic models exhibit a stable node [20].
Materials and Methods
The model
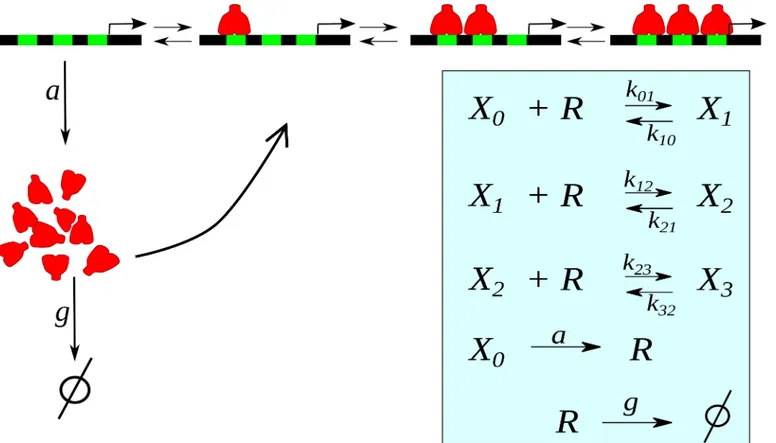
Our model considers that gene expression is regulated by a tandem ofNfunctionally identical regulatory binding sites, where the gene product can bind cooperatively inhibiting its own expression (seeFig 1). This architecture has a biological counterpart in the mouse Hes1 and Hes7 genes (associated to the somitogenic clocks of mammalians), which negatively autoregu-late its own expression through three binding sites (an N- and two E-boxes sequences) in the proximal promoter [21]. In order to emphasize the role ofcis-regulatory system dynamics as an alternative oscillatory mechanism, we do not take into account the translation step. Also, for simplicity, we consider that the repressor synthesis occurs, at ratea, only when no repressor is bound to the DNA, and that they are linearly degraded at rateg. In fact, the present model is a modified version of a previous one with many binding sites [22,23], by including a negative feedback loop.
The macroscopic description
The deterministic reaction rate equations for the proposed model can be written as
d~
dt ¼S~f ~
; ð1Þ
where~is the vector of concentrations,Sis the stoichiometric matrix, and~f is a vector func-tion whose componentfjis the rate function of thej-th reaction. In our caseϕiis the fraction of
comprisesfive chemical species and eightfirst-order chemical reactions. The stoichiometric matrix is given by:
S¼
1 1 0 0 0 0 0 0
1 1 1 1 0 0 0 0
0 0 1 1 1 1 0 0
0 0 0 0 1 1 0 0
1 1 1 1 1 1 1 1
0
B B B B B B @
1
C C C C C C A ;
and the corresponding deterministic reaction rate equations are:
d0
dt ¼ k010cþk101; d1
dt ¼ k121c k101þk010cþk212; d2
dt ¼ k232c k212þk121cþk323;
d3
dt ¼ k323þk232c;
dc
dt ¼ a0 gcþk101þk212þk323 cðk010þk121þk232Þ;
ð2Þ Fig 1. Sketch of the autorepressive single-gene loop with three binding sites.The repressor moleculesR(red) can bind to regulatory sites (green) on the DNA inhibiting its own synthesis. Inset: Cascade of reactions whereXirepresents the promoter withibound repressors, andki,jthe transition rates.
wherekijis the kinetic rate between promoter statesiandj. Due to cooperativity, previous
binding of a repressor molecule alters the actual binding or unbinding process. Known rela-tionships between the system’s kinetics and thermodynamic properties allow us to write all kinetic rates,ks,s+1andks+1,sin terms of three parameters [22]: the binding ratep, the
unbind-ing rateq, andwhich represents the cooperativity intensity, i.e., (¼e DGRTI, whereDG
Iis the
free energy of the interaction). We consider that the presence of already bound repressors alter DNA affinities increasing binding ratesks,s+1. Thus, following [22], we can writeks,s+1=
s−1(N+ 1
−s)p, whileks+1,s=s q. Of course= 1 indicate the absence of cooperativity. An
ana-lytic exploration by standard linear analysis around the steady state of this system is only possible forN2. However, if the synthesis and degradation processes are much slower than the CRS kinetics, we can perform a quasi-steady state approximation onϕivariables, with
i= 0,. . .,N, which allows to write the temporal evolution of the repressors concentration as
_
c¼a FðcÞ g c.F(c) is a sigmoidal regulatory function with an effective half-maximum con-centrationKd, and effective steepnessnH. Such simplified system does not present limit cycle
independently on the steepness of the monotonically decreasing regulatory functionF.
The mesoscopic description
The macroscopicEq (1)may be not suitable to describe correctly the gene expression regula-tion due to the low copy numbers of the involved chemical species. This lead to the necessity of a stochastic description of the system. To this end we consider stochastic simulations of the ele-mentary reactions [24], and the strategy based on the linear-noise approximation (LNA). The LNA is broadly used to study how noise affects reaction networks at the cellular level [25–27]. This approach provides exact predictions for reaction networks composed of zero- and first-order reactions, or for networks involving second-first-order reactions and large volumes at con-stant concentrations. Recently, it has been proved that the precision of LNA predictions can be extended to a strict class of chemical systems with second-order reactions for all volumes [28]. This approach has been previously used to estimate power spectrum derived from biochemical circuits [20,27], and from genetic oscillators [26,29]. In this approximation the fluctuations~Z
around the mean concentrationsEq (1)are given by [25]:
d~Z¼J~ZðtÞdtþBdW~ðtÞ; ð3Þ
whereJandD¼BBTare the Jacobian and diffusion matrices, respectively, anddW~ is a
Wie-ner process. MatricesJandDcan be computed from the rate equations and from the
stoichi-ometry matrix asJij¼
@ðSi~fð Þ~ Þ @j ;and
D¼Sdiagð~fÞST[25]. This approximation allow us to
write the autocorrelation functionhηi(t)ηi(t+τ)i, in terms of theJandDmatrices, from which
one can estimate the power spectrum.
The power spectrum
In order to assess the oscillatory behavior of the model above, we are interested in compute the power spectrum of the fluctuations associated with the number of transcripts. This power spec-trum is computed in two ways. The first one is from the time series derived from stochastic simulations. In this case, the spectrum is calculated by averaging the 8000 periodograms from realizations of 820 min length, and then normalizing by the total power. As usual the periodo-gram was computed using the discrete Fourier transform [30].
spectrum of fluctuations associated toi–esima specie is given by:
SiðoÞ ¼
O p ð
JþI ioÞ 1Dð JT I ioÞ 1
ii; ð4Þ
whereOis the volume, andIis the identity matrix. Once determined the spectrum, one
impor-tant issue in the study of stochastic oscillations is to distinguish them from the randomfl uctua-tions using the peaks of the spectrum. Therefore, we will consider an oscillation quality measure [20],Q90% ¼o^=Do, whereo^is the peak frequency of NIO, andΔωis the difference between the two frequencies at which the power takes its 90% of the peak value. We choose this formalism for its simplicity, despite of the limitations of its predictions when one is dealing with low copy numbers of genes, as our case. In this sense, it is important to remark two limita-tions of the LNA for our purpose: (i) it can significantly underestimate the period and ampli-tude of the oscillations [26], and (ii) it is able to predict only the main peak of the spectrum [31]. A more general discussion about the limitations of the LNA for chemical systems can be found in [32,33].
Results
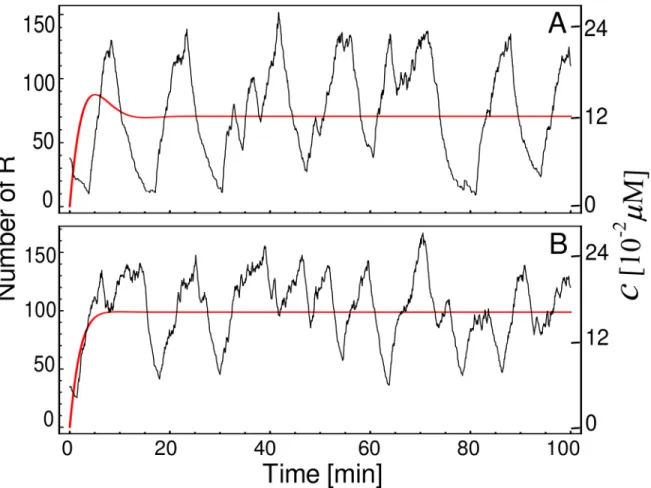
To verify if a mechanism based on transitions between internal states of the CRS can generate sustainable oscillationsper se, we perform simulations of the model sketched inFig 1at two dif-ferent descriptive levels. A macroscopic description can be obtained by numerical integration ofEq (1). In this case, the system presents a damped oscillation before reaching the fixed point (Fig 2A, red line) forN= 3,p= 1.7 × 10⁻³(μM min)−1,q= 0.75 min−1,= 9,a= 0.075μM min−1, andg= 0.3 min−1(see parameters values in [8,22], and references therein). On the other hand, an exact stochastic simulation of these same reactions exhibits oscillations (Fig 2A, black lines) similar to the degrade-and-fire oscillations reported in [34] which uses an explicit time delay model. Oscillations in deterministic single-gene circuits without delay have been described in Goodwin-like models [14] which differ from the presented here because they con-sider two additional post-transcriptional steps. However, the oscillatory behavior in the Good-win model occurs fornH>8 [12,35]. This high value of the Hill coefficient at the
transcriptional level has been considered rather unrealistic [14]. The prediction of such high
nH-value could be explained as a consequence of the quasi-steady state approximation
underly-ing to such models and to an inadequate macroscopic-deterministic description. For the case of a lower cooperativity (Fig 2B,= 2), where the deterministic system does not exhibit damped oscillations, the oscillatory-like behavior of the stochastic counterpart is less apparent and more difficult to be distinguished from noise, as expected for lower cooperativity. The results above show that the transitions between internal states of the CRS can constitute a mechanism for noise-induced oscillations in gene expression. Consequently, the CRS architec-ture can play an important role on oscillatory genetic circuits.
(Fig 3A,= 9) isQ90%= 1.87, while it is not defined for the case with lower cooperativity (Fig 3B,= 2). Increasingp-value 100-fold in case of= 9 also leads to oscillations (data not shown). The periods of the oscillations inFig 3A(*15 min) are smaller when contrasted with the fastest oscillations in eukaryotes, however by including other time-consuming steps in the model, as elongation, protein synthesis and translocation, the oscillation period could increase significatively.
Beyond showing evidence on NIO phenomenon in a single-gene circuit without explicit delay, we want to study two key features. The first one is the steepness of the regulatory func-tion, which is determined both by the intensity of the cooperative binding, and the number of regulatory binding sitesN. The second one is the interplay between the CRS kinetic and the rate of synthesis and degradation processes. To unshroud the influence of this relationship, we scaled the rates of the synthesis and degradation processes with a parameterλ, writinga=λa0, andg=λg0. Thus, increasingλspeeds up the synthesis/degradation processes in relation to the CRS, but without altering the mean number of repressor molecules nor the resulting regulatory function.
Fig 2. Deterministic vs. stochastic descriptive levels.Temporal course of the concentrationc(red lines), obtained by numerical integration ofEq (1), and stochastic trajectories (black lines) of the same system displaying an oscillatory behavior. The parameter values areN= 3,p= 1.7 × 10⁻³μM min−1,q= 0.75 min−1,a= 0.075μM min−1, andg= 0.3 min−1. In addition
takes value of 9 for case (A) and 2 for case (B). For stochastic simulations we consider the cell volume asΩ= 1 × 10⁻¹⁵l.
Fig 4A and 4Bdepict the peak frequencyo^and the corresponding quality factorQ90%, respectively, of the oscillatory behavior as a function ofandλfor the oscillations in the num-berfluctuations of repressor. For the parameter values studied here (the same as inFig 2with
a0= 0.075μM min−1andg0= 0.3 min−1) the oscillation period ranges from 3 to 15 minutes, reaching the maximum frequency at high values of lambda, i.e. high rates of the synthesis/deg-radation processes (left panel). However, in this regime the quality of oscillations is poor, as one can observe in the right panel. TheQ90%-factor shows that there is a particular range for the synthesis/degradation rates, aroundλ= 2, where the NIO become particularly evident.Fig 4Balso shows that the auto-regulatory circuit proposed here can not present clear oscillatory behavior for slow rates of synthesis/degradation processes (λ<2). One also can observe from Fig 4Bthat increasingimproves the NIO phenomena.
We have also studied what happens when we increase the steepness of the effective regula-tory function by increasing the number of binding sites, keeping constant all other parameters. For the case ofN= 5, one observes a slight decrease of the peak frequency when increasing, as shown inFig 5. On the other hand, as expected, theQ90%-factor increases markedly when the number of regulatory binding sites increases, as can be seen inFig 5B. In this sense, forλ= 1 and moderatevalues theQ90%-factor reaches higher values than inFig 3B. An interesting fea-ture shown inFig 5Bis thatQ90%-factor does not increase monotonically with. This behavior can be linked with the fact that fluctuation levels, and probably the width of the peak frequency, increases with[23].
Fig 3. Power spectral densities.Normalized power spectral density of the fluctuations of repressor obtained by averaging 8000 periodograms from stochastic simulations ofFig 2(black dots), and the approximate normalized power spectral density computed by usingEq (4)(red curve).o^indicates the peak frequency, andΔωis the difference of the two frequencies at which the power takes the 90% of the peak value. The frequencyωis given in radians per minute (rad min−1).
Fig 4. Influence of kinetic rates and cooperativity on oscillations.Peak frequencyo^(panel A) and the quality factorQ90%(panel B) as a function ofand λ, for oscillations in the numberfluctuations of repressor. Red dots correspond to the parameter values used in Figs2and3, whereλ= 1. See details of the plot nearλ= 1 inS1 Fig.
doi:10.1371/journal.pone.0151086.g004
Fig 5. The number of binding sites enhances oscillatory behavior.Peak frequencyo^(panel A) and the quality factorQ90%(panel B) as a function of andλ, for oscillations in the numberfluctuations of repressor for the same parameter thanFig 4, but withN= 5 instead ofN= 3.
As illustrated by the previous examples, autorepressive single-gene circuit with multi-site CRS can exhibit oscillatory behavior in a mesoscopic regime without the necessity of explicit time lagged variables, or post-transcriptional step. The oscillatory behavior illustrated above can be explained in terms of transitions between the internal states of the CRS, which are able to buffer time in the same way as additional post-transcripcional steps. In our model the time-buffering capability is determined by the mean number of sites occupied when there is a high number of repressor molecules. Consequently, for a given CRS kinetics the expression level of repressors that reach the system could be an important parameter for NIO development. To illustrate this idea we consider the same parameters for CRS as inFig 5, but increasinga0and decreasingg0parameters by the same factor (a0= 0.15μM min−1andg0= 0.15 min−1), in order to increase the expression level.Fig 6shows that the peak frequencyo^is almost the same asFig 5A, while the quality factorQ90%gives clear evidence that the oscillatory behavior becomes much more apparent. Remarkably, in this regime it is possible tofind good oscilla-tions even in the absence of cooperative binding (i.e.,= 1).
Discussion
In summary, we have presented a model that considers a multi-site CRS architecture and allows to unravel the role of different elements that conform the circuit (binding sites, coopera-tive interactions, kinetic rates) in the development of sustained oscillatory behavior. Our sto-chastic analysis reveals that oscillations in the expression level of repressor are feasible in a broad range of parameters, while the corresponding macroscopic reaction rate equations pre-dict the existence of stable fixed points. To the best of our knowledge, the existence of
Fig 6. Improving oscillations by increasing the occupancy of all binding sites.Peak frequencyo^(panel A) and the quality factorQ90%(panel B) as a function ofandλ, for oscillations in the numberfluctuations of repressor for the same parameter asFig 5, but witha0= 0.15μM min−1andg0= 0.15 min−1.
phenomena NIO has previously been predicted solely in genetic oscillators with explicit time delay [36,37].
We find that, the steepness of the regulatory functionFplays a key role in NIO develop-ment. In this sense, both the intensity of the cooperative interaction between transcription fac-tors and the number of regulatory binding sites on the CRS can enhance the oscillatory behavior. However, the cooperative interaction is not an essential ingredient because we found oscillatory behavior even in a total absence of cooperativity. Not trivial behavior in absence of cooperativity was also reported in genetic toggle switch [38,39]. This fact is in contrast with a recent finding about instabilities on spatially extended systems, where cooperative binding is essential for Turing patterns arising [40]. On the other hand, recent studies have been shown that Turing patterns can also be promoted by chemical noise [41,42], in an equivalent manner to the NIO phenomenon. Furthermore, we show that by increasing the expression level of the system improves the quality of the sustained oscillations. This effect is derived from the multi-site CRS architecture, because at higher levels of repressor, the system have more chance to occupy all binding sites during the resting phase, which in turn increases the implicit delay [43].
Our finding emphasize the role of the multi-site CRS architecture for naturally occurring genetic oscillators, such as genes Hes1 and Hes7. The expression of these genes is inhibited by their own products which can bind to three regulatory binding sites [1], as proposed here. We have shown that in a multi-site promoter the activation/deactivation process contributes to the overall time delay and can drive oscillationsper se. However, though the periods of the oscilla-tions reported here are smaller than the period of the segmentation clocks, we expect that lon-ger periods can be reached by including in the model other time-consuming processes [15–17].
We believe that the use of detailed, and biologically interpretable, CRS model in combina-tion with stochastic analyses, offers new insights into the nature of these oscillacombina-tions, especially in the context of segmentation clocks, as well as potentially aiding in the design of new syn-thetic biological prototypes.
Supporting Information
S1 Fig. Details ofFig 4.Peak frequencyo^(top panel) and the quality factorQ90%(bottom panel) as a function of, for three value ofλ: 0.75 (red), 1.0 (green) and 1.25 (blue). (TIF)
Acknowledgments
We thank Alejandra Ventura and Andrés McCarthy for critical reading of the manuscript. NG and LD are members of CONICET (Argentina). DM is researcher of CICBA (Argentina).
Author Contributions
Conceived and designed the experiments: LD. Performed the experiments: NG DM. Analyzed the data: NG DM LD. Contributed reagents/materials/analysis tools: NG DM LD. Wrote the paper: NG LD.
References
1. Bessho Y, Kageyama R. Oscillations, clocks and segmentation. Current Opinion in Genetics and Development. 2003; 13:379–384. doi:10.1016/S0959-437X(03)00083-2PMID:12888011
2. Shearman LP, Sriram S, Weaver DR, Maywood ES, Chaves I, Zheng B, et al. Interacting molecular loops in the mammalian circadian clock. Science. 2000; 288:1013–1019. doi:10.1126/science.288.
3. Elowitz MB, Leibler S. A synthetic oscillatory network of transcriptional regulators. Nature. 2000; 403:335–338. doi:10.1038/35002125PMID:10659856
4. Kim J, Winfree E. Synthetic in vitro transcriptional oscillators. Molecular Systems Biology. 2011; 7:465. doi:10.1038/msb.2010.119PMID:21283141
5. Stricker J, Cookson S, Bennett MR, Mather WH, Tsimring LS, Hasty J. A fast, robust and tunable syn-thetic gene oscillator. Nature. 2008; 456:516–519. doi:10.1038/nature07389PMID:18971928
6. Mackey MC, Glass L. Oscillation and chaos in physiological control systems. Science. 1977; 197:287–
289. doi:10.1126/science.267326PMID:267326
7. Figueiredo JCBD, Diambra L, Glass L, Malta CP. Chaos in two-loop negative feedback systems. Physi-cal Review E. 2002; 65:051905. doi:10.1103/PhysRevE.65.051905
8. Lewis J. Autoinhibition with transcriptional delay: A simple mechanism for the zebrafish somitogenesis oscillator. Current Biology. 2003; 13:1398–1408. doi:10.1016/S0960-9822(03)00534-7PMID:
12932323
9. Monk NAM. Oscillatory expression of Hes1, p53, and NF-kB driven by transcriptional time delays. Cur-rent Biology. 2003; 13:1409–1413. doi:10.1016/S0960-9822(03)00494-9PMID:12932324
10. Lengyel IM, Soroldoni D, Oates AC, Morelli LG. Nonlinearity arising from noncooperative transcription factor binding enhances negative feedback and promotes genetic oscillations. Papers in Physics. 2014; 6:060012. doi:10.4279/pip.060012
11. Wang J, Lefranc M, Thommen Q. Stochastic oscillations induced by intrinsic fluctuations in a self-repressing gene. Biophysical Journal. 2014; 107:2403–2416. doi:10.1016/j.bpj.2014.09.042PMID:
25418309
12. Goodwin BC. Oscillatory behavior in enzymatic control processes. Advances in Enzyme Regulation. 1965; 3:425–438. doi:10.1016/0065-2571(65)90067-1PMID:5861813
13. Leloup JC, Gonze D, Goldbeter A. Limit cycle models for circadian rhythms based on transcriptional regulation in Drosophila and Neurospora. Journal Biological Rhythms. 1999; 14:433–448. doi:10.1177/
074873099129000948
14. Gonze D, Abou-Jaoudé W. The Goodwin Model: Behind the Hill Function. PLoS ONE. 2013; 8: e069573. doi:10.1371/journal.pone.0069573
15. Hanisch A, Holder MV, Choorapoikayil S, Gajewski M, Özbudak EM, Lewis J. The elongation rate of RNA polymerase II in zebrafish and its significance in the somite segmentation clock. Development. 2012; 140:444–453. doi:10.1242/dev.077230
16. Takashima Y, Ohtsuka T, Gonz×lez A, Miyachi H, Kageyama R. Intronic delay is essential for oscil-latory expression in the segmentation clock. Proc Natl Acad Sci USA. 2011; 108:3300–3305. doi:10.
1073/pnas.1014418108PMID:21300886
17. Hoyle NP, Ish-Horowicz D. Transcript processing and export kinetics are rate-limiting steps in express-ing vertebrate segmentation clock genes. Proc Natl Acad Sci USA. 2013; 110:E4316–E4324. doi:10.
1073/pnas.1308811110PMID:24151332
18. McKane AJ, Newman TJ. Predator-prey cycles from resonant amplification of demographic stochasti-city. Physical Review Letters. 2005; 94:218102. doi:10.1103/PhysRevLett.94.218102PMID: 16090353
19. Ramaswamy R, Sbalzarini IF. Intrinsic noise alters the frequency spectrum of mesoscopic oscillatory chemical reaction systems. Scientific Reports. 2011; 1:154. doi:10.1038/srep00154PMID:22545192
20. Toner DLK, Grima R. Molecular noise induces concentration oscillations in chemical systems with sta-ble node steady states. The Journal of Chemical Physics. 2013; 138:055101. doi:10.1063/1.4788979 PMID:23406149
21. Bessho Y, Miyoshi G, Sakata R, Kageyama R. Hes7: a bHLH-type repressor gene regulated by Notch and expressed in the presomitic mesoderm. Genes to Cells. 2001; 6:175–185. doi:
10.1046/j.1365-2443.2001.00409.xPMID:11260262
22. Gutierrez PS, Monteoliva D, Diambra L. Cooperative Binding of Transcription Factors Promotes Bimodal Gene Expression Response. PLoS ONE. 2012; 7:e044812. doi:10.1371/journal.pone. 0044812
23. Gutierrez PS, Monteoliva D, Diambra L. Role of cooperative binding on noise expression. Physical Review E. 2009; 80:011914. doi:10.1103/PhysRevE.80.011914
24. Erban R, Chapman J, Maini P. A practical guide to stochastic simulations of reaction-diffusion bpro-cesses. ArXiv e-prints. 2007;0704.1908v2. Available from:http://arxiv.org/abs/0704.1908
26. Thomas P, Matuschek H, Grima R. How reliable is the linear noise approximation of gene regulatory networks? BMC Genomics. 2013; 14(Suppl 4):S5. doi:10.1186/1471-2164-14-S4-S5PMID:24266939
27. Cantini L, Cianci C, Fanelli D, Massi E, Barletti L. Linear noise approximation for stochastic oscillation of intracellular calcium. Journal of Theoretical Biology. 2014; 349:92–99. doi:10.1016/j.jtbi.2014.01.
035PMID:24503287
28. Grima R. The linear-noise approximation and the chemical master equation exactly agree up to sec-ond-order moments for a class of chemical systems. Physical Review E. 2015; 92:042124. doi:10. 1103/PhysRevE.92.042124
29. McKane AJ, Nagy JD, Newman TJ, Stefanini MO. Amplified biochemical oscillations in cellular sys-tems. Journal of Statistical Physics. 2007; 128:165–191. doi:10.1007/s10955-006-9221-9
30. Press WH, Teukolsky SA, Vetterling WT, Flannery BP. Numerical Recipes 3rd Edition: The Art of Sci-entific Computing. 3rd ed. New York, NY, USA: Cambridge University Press; 2007.
31. Thomas P, Straube AV, Timmer J, Fleck C, Grima R. Signatures of nonlinearity in single cell noise-induced oscillations. Journal of Theoretical Biology. 2013; 335:222–234. doi:10.1016/j.jtbi.2013.06.
021PMID:23831270
32. Grima R, Thomas P, Straube AV. How accurate are the nonlinear chemical Fokker-Planck and chemi-cal Langevin equations? The Journal of Chemichemi-cal Physics. 2011; 135:084103. doi:10.1063/1.3625958 PMID:21895155
33. Grima R. A study of the accuracy of moment-closure approximations for stochastic chemical kinetics. The Journal of Chemical Physics. 2012; 136:154105. doi:10.1063/1.3702848PMID:22519313
34. Mather W, Bennett MR, Hasty J, Tsimring LS. Delay-induced degrade-and-fire oscillations in small genetic circuits. Physical Review Letters. 2009; 102:068105. doi:10.1103/PhysRevLett.102.068105 PMID:19257639
35. Griffith JS. Mathematics of cellular control processes. II. Positive feedback to one gene. Journal of The-oretical Biology. 1968; 20:209–216. doi:10.1016/0022-5193(68)90189-6PMID:5727240
36. Bratsun D, Volfson D, Tsimring LS, Hasty J. Delay-induced stochastic oscillations in gene regulation. Proc Natl Acad Sci USA. 2005; 102:14593–14598. doi:10.1073/pnas.0503858102PMID:16199522
37. Galla T. Intrinsic fluctuations in stochastic delay systems: Theoretical description and application to a simple model of gene regulation. Physical Review E. 2009; 80:021909. doi:10.1103/PhysRevE.80. 021909
38. Lipshtat A, Loinger A, Balaban NQ, Biham O. Genetic Toggle Switch without Cooperative Binding. Physical Review Letters. 2006; 96:188101. doi:10.1103/PhysRevLett.96.188101PMID:16712399
39. Biancalani T, Assaf M. Genetic Toggle Switch in the Absence of Cooperative Binding: Exact Results. Physical Review Letters. 2015; 115:208101. doi:10.1103/PhysRevLett.115.208101PMID:26613474
40. Diambra L, Senthivel VR, Barcena Menendez D, Isalan M. Cooperativity to increase Turing pattern space for synthetic biology. ACS Synthetic Biology. 2015; 4:177–186. doi:10.1021/sb500233uPMID:
25122550
41. Biancalani T, Fanelli D, Di Patti F. Stochastic Turing patterns in the Brussellator model. Physical Review E. 2010; 81:046215. doi:10.1103/PhysRevE.81.046215
42. Cantini L, Cianci C, Fanelli D, Massi E, Barletti L, Asllani M, Stochastic amplification of spatial modes in a system with one diffusing species, Journal of Mathematical Biology. 2014; 69:1585–1608. doi:10.
1007/s00285-013-0743-xPMID:24337716