iTRAQ-Based Quantitative Proteomics
Analysis of Black Rice Grain Development
Reveals Metabolic Pathways Associated with
Anthocyanin Biosynthesis
Linghua Chen1,2, Yining Huang1,3, Ming Xu1,4, Zuxin Cheng1,4, Dasheng Zhang5,6, Jingui Zheng1,4*
1FujianAgriculture and Forestry University, Fuzhou Fujian, China,2Jinshan College of Fujian Agriculture and Forestry University, Fuzhou Fujian, China,3Department of Food and Biology Engineering, Zhangzhou Institute of Technology, Zhangzhou Fujian, China,4College of Crop Science, Fujian Agriculture and Forestry University, Fuzhou Fujian, China,5Shanghai Chenshan Plant Science Research Center, Shanghai Chenshan Botanical Garden, Chinese Academy of Sciences, Shanghai, China,6Shanghai Key Laboratory for Plant Functional Genomics and Resources, Shanghai, China
Abstract
Background
Black rice (Oryza sativaL.), whose pericarp is rich in anthocyanins (ACNs), is considered as a healthier alternative to white rice. Molecular species of ACNs in black rice have been well documented in previous studies; however, information about the metabolic mechanisms underlying ACN biosynthesis during black rice grain development is unclear.
Results
The aim of the present study was to determine changes in the metabolic pathways that are involved in the dynamic grain proteome during the development of black riceindicacultivar, (Oryza sativaL.indicavar. SSP). Isobaric tags for relative and absolute quantification (iTRAQ) MS/MS were employed to identify statistically significant alterations in the grain proteome. Approximately 928 proteins were detected, of which 230 were differentially expressed through-out 5 successive developmental stages, starting from 3 to 20 days after flowering (DAF). The greatest number of differentially expressed proteins was observed on 7 and 10 DAF, including 76 proteins that were upregulated and 39 that were downregulated. The biological process analysis of gene ontology revealed that the 230 differentially expressed proteins could be sorted into 14 functional groups. Proteins in the largest group were related to metabolic pro-cess, which could be integrated into multiple biochemical pathways. Specifically, proteins with a role in ACN biosynthesis, sugar synthesis, and the regulation of gene expression were upre-gulated, particularly from the onset of black rice grain development and during development. In contrast, the expression of proteins related to signal transduction, redox homeostasis, photo-synthesis and N-metabolism decreased during grain maturation. Finally, 8 representative
a11111
OPEN ACCESS
Citation:Chen L, Huang Y, Xu M, Cheng Z, Zhang D, Zheng J (2016) iTRAQ-Based Quantitative Proteomics Analysis of Black Rice Grain Development Reveals Metabolic Pathways Associated with Anthocyanin Biosynthesis. PLoS ONE 11(7): e0159238. doi:10.1371/journal. pone.0159238
Editor:Tai Wang, Institute of Botany, Chinese Academy of Sciences, CHINA
Received:March 29, 2016
Accepted:June 29, 2016
Published:July 14, 2016
Copyright:© 2016 Chen et al. This is an open access article distributed under the terms of the Creative Commons Attribution License, which permits unrestricted use, distribution, and reproduction in any medium, provided the original author and source are credited.
Data Availability Statement:All relevant data are within the paper and its Supporting Information file.
Funding:This work was supported by the National Key Technology R&D Program (2013BAD01B05) and the Science and Technology Innovation Platform Development Program of Fujian Agriculture and Forestry University (PTJH13001, PTJH12015).
genes encoding different metabolic proteins were verified via quantitative real-time polymerase chain reaction (qRT-PCR) analysis, these genes had differed in transcriptional and transla-tional expression during grain development.
Conclusions
Expression analyses of metabolism-related protein groups belonging to different functional categories and subcategories indicated that significantly upregulated proteins were related to flavonoid and starch synthesis. On the other hand, the downregulated proteins were determined to be related to nitrogen metabolism, as well as other functional categories and subcategories, including photosynthesis, redox homeostasis, tocopherol biosynthetic, and signal transduction. The results provide valuable new insights into the characterization and understanding of ACN pigment production in black rice.
Introduction
Rice (Oryza sativaL.) is one of the primary cereals of the world, serving as a major staple food source to more than half of the global population [1]. The most commonly consumed rice type is white rice; however, several special cultivars of rice consist of colored pigments such as red and black. Black rice presents a dark purple color, which is due to its high anthocyanin (ACN) content that is mainly secreted in the pericarp [2–4]. Black rice has been historically considered as a highly nutritious food in China and other East Asian countries [5]. Today, black rice is becoming increasingly popular in the US, Australia, as well as Europe, particularly in terms of its health benefits.
ACNs pertain to water-soluble flavonoids and are the primary pigments of black and red grains, as well as various other fruits, vegetables, cereals, and flowers [6]. In plants, ACNs serve as pollinators and seed dispersers, as well as photoprotectants that scavenge free radicals that are generated during photosynthesis [7]. Recent interest in ACNs as health-promoting food ingredients has mainly been due to its reported antioxidant activity [8,9], which may contrib-ute to the prevention of chronic and degenerative diseases [10–13]. Previous reports have also shown that ACNs also possess anti-inflammatory properties prevent arteriosclerosis [14] and hyperlipidemia [15,16], lower glycemic indices [17], promote visual acuity[18], and hinder obesity and diabetes [19]. In addition, animal studies showed that an ACN-rich extract derived from black rice showing a relatively high ACN content (43.2%) imparted similar effects [20].
Proteomics studies are generally conducted to obtain a comprehensive evaluation of pro-teins that respond to a specific environment or treatment, and these investigations provide both quantitative and active information, and protein-protein interactions[35]. Proteomic analysis of rice grains was previously reported, and the protein spots were identified by mass spectrometry as 309[36], 298[37], and 54[38], respectively. However, these investigations were performed using gel-based techniques, which limits the detection of proteins within grain pro-teomes. One disadvantage of this gel-based procedure is that the markedly over-represented group of grain-specific proteins may mask low-level proteins, thereby rendering its detection difficult [39]. Moreover, membrane proteins with several membrane spanning domains are dif-ficult to detect on classical two-dimensional electrophoresis (2-DE) gels due to its low abun-dance as well as poor solubility in aqueous media[40]. The recently developed isobaric tags for relative and absolute quantitation (iTRAQ) proteomic method allow the unbiased and simulta-neous observation of relative protein abundances within a cell during harvest [41–43]. There-fore, the iTRAQ method is suitable for investigating proteomic changes under various developmental processes[44]. iTRAQ was recently utilized in plant fruit development research of wheat [45]and grape[46–48]. Interestingly, iTRAQ has been determined to be a potentially useful approach in rice grain development research, as indicated by the results of a recent study on the mechanistic responses of inferior spikelets to drought stress [49].
In the present study, iTRAQ was utilized in the proteomic analysis of black rice grain to reveal the unique genetic profile, as well as identify alterations in the levels of protein expres-sion during development. The goal of this study was to reveal differentially expressed proteins at five time points during the development of black rice grains (O.sativaL.indicavar. SSP), as well as compare these protein expression patterns to identify candidate proteins that may be potentially involved in ACN biosynthesis. Furthermore, specific proteins were selected to cor-relate whether alterations in protein expression may be validated using transcript analysis. The results of the present study provide global insights into proteome modifications in black rice during development.
Materials and Methods
Plant materials and sampling
Black rice (O.sativaL.indicavar. SSP) plants were cultured during the rice growing season (May to September) under natural and normal field conditions at the Fujian Agriculture Uni-versity experimental field and were fertilized (urea, 60 kg/ha) using routine procedures. In rice, developing seeds are categorized as superior or inferior based on its location on spikes[50]. The superior seeds, which are located at the topmost region of the spike, generally show a higher growth rate, as well as simultaneously reach maturity. Therefore, in the present study, superior seeds were selected as experimental samples based on its distinguishing advantage of synchro-nous development [36]. The superior seeds of the topmost 3 spikelets were then labeled at noon during anthesis, when at least 50% of the superior seeds belonging to the corresponding spikelets were at the flowering stage[50]. The labeled spikelets were thus harvested at 2, 3, 5, 7, 10, 13, 15, 17, and 20 days after flowering (DAF). After being dehusked, samples from each of these stages comprised at least 200 seeds derived from 30 spikes that were immediately stored at -80°C until protein extraction.
Total anthocyanin content (TAC) measurement
of acidified ethanol (ethanol and 1.0 N HCl, 85:15, v/v) was then added for total anthocyanin content extraction. The solution was then mixed and adjusted to a pH level of 1 using 4 N HCl. The resulting solution was then shaken for 15 min, readjusted to pH 1 as required, and then again shaken for another 15 min. The tube was then centrifuged at 30,000gfor 15 min, and the supernatant was transferred into a 50-mL volumetric flask, and acidified ethanol was added to top up to volume. Triplicate biological preparations were performed for each sample. Absor-bance was measured at a wavelength of 535 nm against a blank. The TAC (in micrograms per gram) was calculated as follows:
TAC¼A28:82;
whereAis the absorbance reading [51].
Protein extraction and digestion
Seeds (1 g) were ground in ice-cold extraction buffer [20 mMTris-HCl (pH 8.0), 20 mM NaCl, 10 mM phenylmethylsulfonyl fluoride, and 10 mM dithiothreitol]. The supernatant was sepa-rated by centrifugation at 35,000gfor 20 min at 4°C. The pellet was then resuspended in fresh
extraction buffer for another round of extraction, and then again centrifuged at 35,000gfor 20 min at 4°C to separate the supernatant. The proteins in the pooled supernatants were precipi-tated using 4 volumes of ice-cold trichloroacetic acid-acetone (10% trichloroacetic acid mixed in 100% acetone) for 4 h at -20°C,followed by isolation via centrifugation at 35,000gfor 20
min. The protein pellet was then washed with cold 80% acetone with 0.07% (w/v)β -mercap-toethanol, followed by cold acetone with 0.07% (w/v)β-mercaptoethanol, and then vacuum-dried as previously elsewhere[52]. The homogenate was then centrifuged, and the collected pel-lets were air-dried, mixed in 800μL STD buffer (4% SDS, 150 mM Tris-HCl, 100 mM DTT,
pH 7.6), boiled for 5 min, and then sonicated. After centrifugation, the supernatants were then collected, and protein content was measured by using a BCA protein assay reagent (Beyotime Institute of Biotechnology, Shanghai, China). Similar amounts of proteins (120μg from 3, 7, 10
DAF, 15, and 20 DAF) were then mixed and used as reference (REF).
Protein digestion was conducted using the FASP procedure [53]. For each sample, 300μg of
proteins were placed on an ultrafiltration filter (30 kDa cut-off, Sartorius, Gottingen, Germany) that consisted of 200μL of UA buffer (8 M urea, 150 mM Tris-HCl, pH 8.0), centrifuged at
14,000gfor 30 min, and then washed using 200μL of UA buffer. Approximately 100μL of 50
mM iodoacetamide was then added to the filter in order to block any reduced cysteine residues. The samples were then kept at room temperature for 30 min in the dark, which was followed by centrifugation at a speed of 14,000gfor 30 min. The filters were then washed twice with UA buffer (100μL), followed by centrifugation at 14,000gfor 20 min after every wash. Next,
approximately 100μL of a dissolution buffer (Applied Biosystems, Foster City, CA, USA) was
placed on the filter, and then centrifuged at 14,000gfor 20 min, and then repeated twice. Then,
the protein suspensions were subjected to enzyme digestion using 40μL of trypsin (Promega,
Madison, WI, USA) buffer (4μg trypsin in 40μL of dissolution buffer) for 16–18 h at 37°C.
Last, the filter unit was then transferred to a new tube and spun at 14,000gfor 30 min. The col-lected peptides were colcol-lected in the form of a filtrate, and the concentration of the peptides was analyzed at an optical density using a wavelength of 280 nm (OD280)[53].
iTRAQ labeling and strong cationex change
iTRAQ labeling was conducted following the manufacturer’s recommendations (Applied Bio-systems, Foster City, CA, USA). Briefly, the peptide pellet was reconstituted in 30μL of the
Multiplex Kit (AB SCIEX, Framingham, MA, USA) at 3, 7, 10, 15, and 20 DAF samples was performed twice. A REF sample was then added to each group. Then, the labeling reaction was kept at room temperature for 1 h before further analysis. From each group, 7 labeled samples were pooled and then vacuum-dried in a centrifuge at room temperature.
The iTRAQ-labeled peptides were then subjected to the procedure of strong cation exchange fractionation using an AKTA Purifier 100 (GE Healthcare, Little Chalfont, Bucks, UK), which was equipped with a polysulfethyl (PolyLC Inc., Columbia, MD, USA.) column (4.6 mm × 100 mm, 5μm, and 200 A). The peptides were then eluted at a flow rate of 1 mL/min. Buffer A
com-prised 10 mM KH2PO4and 25% v/v can (pH 3.0),whereas Buffer B contained 10 mM KH2PO4,
25% v/v ACN, and 500 mM KCl (pH 3.0). Both buffers were then filter-sterilized. The gradient utilized for separation was as follows: 100% Buffer A for 25 min, 0–10% Buffer B for 7 min, 10%–
20% Buffer B for 10 min, 20%–45% Buffer B for 5 min, 45%–100% Buffer B for 5 min, 100% Buffer B for 8 min, and lastly, 100% Buffer A for 15 min. Monitoring of the elution process was performed by measuring the absorbances at a wavelength of 214 nm, with fractions collected at 1-min intervals. The collected fractions (a total of 30) were then combined into 10 pools and desalted using C18 cartridges (Sigma, Santa Clara, CA, USA). Every fraction was concentrated by vacuum centrifugation, followed by reconstitution in 40μL of 0.1% (v/v) trifluoroacetic acid. The
samples were stored at -80°C until LC-MS/MS analysis.
LC-MSMS analysis
The iTRAQ-labeled samples were then analyzed by using the Easy-nLC nanoflow HPLC sys-tem (Thermo Fisher Scientific, Karlsruhe, BW, Germany), which was connected to an LTQ Orbitrap Elite mass spectrometer (Thermo Fisher Scientific, Karlsruhe, BW, Germany). A total of 1μg of every sample was loaded onto an Thermo Scientific EASY column (two columns)
using an autosampler, using a flow rate of 150 nL/min. Peptide sequential separation using the Thermo Scientific EASY trap column (100μm × 2 cm, 5μm, 100 Å, C18) and analytical
col-umn (75μm × 25 cm, 5μm, 100 Å, C18) was conducted using a segmented 2-h gradient of
Sol-vent A (0.1% formic acid in water) to 35% SolSol-vent B (0.1% formic acid in 100% ACN) for 100 min, which was then followed by 35%-90% Solvent B for 3 min, and finally, 90% Solvent B for 5 min. Then, the column was re-equilibrated to attain its initial highly aqueous solvent compo-sition prior to analysis.
The mass spectrometer was run in a positive ion mode, wherein the MS spectra were acquired within a range of 300–2,000 m/z. The resolution of the MS and MS/MS scan using 200 m/z for the LTQ Orbitrap Elite was set to 60,000 and 15,000, respectively. The 10 signals showing the highest intensities in the acquired MS spectra were then selected for additional MS/MS analysis. The isolation window employed was 1 m/z, with ions fragmented using higher energy collisional dissociation at normalized collision energies of 35 eV. The highest ion injection times utilized were 50 ms for the survey scan and then 150 ms for the MS/MS scans, whereas the automatic gain control target values for the full scan modes were set to 1.0×10⁻⁶,
and that for MS/MS was 5.0×10⁴. The dynamic exclusion duration was 30 s.
Database search and protein quantification
used as fixed modifications; and peptide charges of 2+, 3+, and 4+, as well as methionine oxida-tion were designated as variable modificaoxida-tions. The mass tolerance was 10 ppm for precursor ions and 0.05 Da for fragmented ions. The results were then filtered according to a false discov-ery rate (FDR) of<1%.
The relative quantitative protein analysis of samples according to the ratios of iTRAQ reporter ions derived from all unique peptides that represented each protein was conducted using the Proteome Discoverer software (version 1.4). The relative peak intensities of the iTRAQ reporter ions that were derived from each of the MS/MS spectra were employed, and the REF sample was used as a reference in calculating for the iTRAQ ratios of the reporter ions. The final ratios derived from the relative protein quantifications were then normalized accord-ing to the median protein quantification ratio. The protein ratios represented the median of the unique peptides in the protein. Only proteins identified at all two replicates were consid-ered for further analysis.
Bioinformatics functional analysis
Statistical and hierarchical clustering analyses were performed using Perseus V1.4.1.3 (http:// 141.61.102.17/perseus_doku/)[54,55]. P-values<0.05 by Benjamini-Hochberg FDR in
Per-seus and a ratio fold-change of>1.20 or<0.83 in expression between any two groups were
considered significant. The hierarchical clustering analysis was performed using the following settings: Row, Column distance that was calculated using the Euclidean algorithm; Row, Col-umn linkage–Complete. Functional analysis of the identified proteins was performed using Gene Ontology (GO) annotation (http://www.geneontology.org), and the proteins were cate-gorized based on its biological process, molecular function, as well as cellular localization [56]. The differentially expressed proteins were then further assigned to the Clusters of Orthologous Groups of proteins (COG) database (http://www.ncbi.nlm.nih.gov/COG/) [57].
RNA extraction and qRT-PCR analysis
Total RNA was extracted from leaves by using the TaKaRa RNAiso reagent (TaKaRa Bio, Otsu, Japan) and then treated with RNase-free DNase I (TaKaRa Bio, Otsu, Japan)[58]. The purified RNA was reverse-transcribed by using the M-MLV reverse transcription system (Pro-mega, Madison, WI, USA), following the manufacturer’s instructions. qRT–PCR was
con-ducted in 96-well blocks using an CFX96 Real-time System (BioRad, Hercules, CA, USA) using the SYBR Green I master mix in a volume of 25μL. Each qRT-PCR was run in triplicate. To
normalize the expression data, the gene,Actin(GenBank Accession Number: AY212324) was used as internal reference. Relative expression levels were then calculated by using the 2-ΔΔCT
(cycle threshold) method[59].
Results
Physiological characterization of developing black rice grains
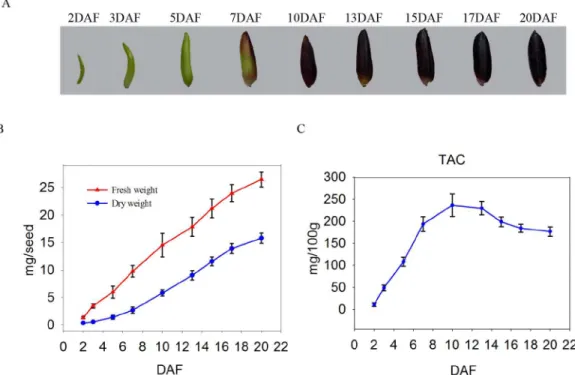
continued to increase until 20 DAF, thereby indicating that the developing seeds had entered the desiccation phase by 17 DAF. The developmental alterations in seed size, fresh weight, as well as dry weight were generally similar with the results of previous investigations [32,60]. Taken together, the results of the present study indicate that developing seeds up to 7 DAF are actively dividing and differentiating, and the grains begin to fill and then ripen at 7 DAF, which then continues on up to 20 DAF. Because the goal of the present study was to conduct protein expression profiling in relation to ACN biosynthesis during grain filling, we deter-mined the dynamic change in the TAC in seeds. The results indicated that TAC content increased from 2 to 10 DAF, which was then followed by a dramatic decrease (Fig 1C), thereby suggesting 2 points: (1) ACNs did not accumulate during the early stages and the grains appeared almost non-pigmented, and (2) the rates of development of the bran outer layers and endosperm differ because ACNs exist almost exclusively at the early and mid-stages, but not at the late stages. Based on these observations, we then divided the development process encom-passing 2 to 20 DAF into early (2–7 DAF), mid (7–13 DAF), and late (13–20 DAF) categories, and used the developing seeds at 3, 7, 10, 15, and 20 DAF for further analysis.
General information on iTRAQ analysis
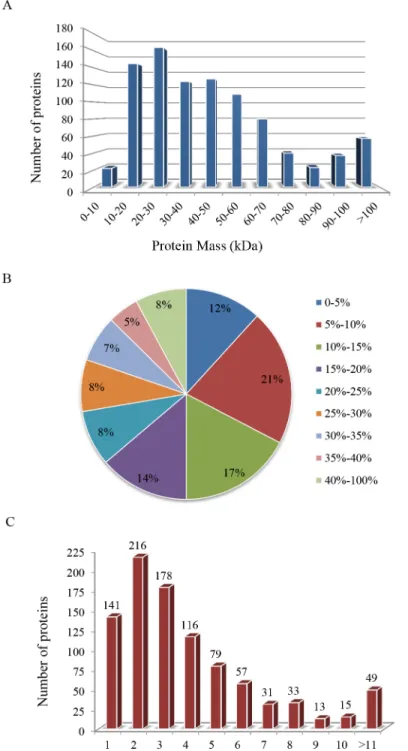
In the present study, a total of 2,084 proteins were identified in the experiments, which included the developmental stages and replicates of the iTRAQ proteomic analysis. Approxi-mately 928 proteins were identified in the 2 biological replicates and were subsequently included in a comparative analysis.Fig 2shows the basic information that was generated from the iTRAQ-LC−MS/MS data. The molecular weights of majority of the identified pro-teins (80%,Fig 2A) were between 20 and 70 kDa. The distribution analysis of the sequence Fig 1. Development of black rice seed.(A) The 9 stages of seed development. (B) Changes in the fresh and dry weights of developing seeds. At least 100 seeds were examined at various stages of development. (C) Changes in total anthocyanin content (TAC) levels in developing seeds.
coverage of the detected peptides indicated that 88% of these proteins have a coverage that was>5% (Fig 2B) and that 84.81% (787) were inferred from at least 2 unique peptides (Fig
2C). These results thus indicate good quality data.
Fig 2. General information on the iTRAQ-LC−MS/MS analysis that was performed using black rice
seed.(A) Distribution of proteins of different molecular weights. (B) Coverage of proteins by using LC-MS/ MS-identified peptides. (C) Unique peptides of the detected proteins. The number of proteins in each of the categories is presented above each bar.
Comparative analysis of protein expression at five developmental stages
Using a cutoff of P-value<0.05 and a ratio fold-change of>1.20 or<0.83 for expression, we
identified 230 differentially expressed proteins after comparing at least 1 sample pair (S1 Table). These 230 proteins were grouped based on fold-change in expression, as visualized in Fig 3. The analysis revealed 2 main branches. DAF 3 was distinct from DAF 7, 10, 15, and 20. Similarly, DAF 7, 10, 15, and DAF 20 were also distinguishable from each other, and could be resolved into 2 separate clusters within the same branch. The maximum number of differen-tially expressed proteins was observed in the sample pair consisting of the time points of 7 and 10 DAF (76 upregulated and 39 downregulated proteins), followed by the sample pair made up of the time points of 10 and 15 DAF (77 unregulated and 28 downregulated proteins) (Fig 4). This finding indicates that a distinct metabolic phase could possibly serve as an indicator of
Fig 3. Hierarchical clustering analysis of the 230 differentially expressed proteins at 5 seed development stages.Green: Reduced expression compared to that observed in the REF. Red: Increased expression compared to that detected in the REF. White: No data.
developmental reprogramming. In contrast, the sample pair consisting of the time points of 15 and 20 DAF presented the lowest number of differentially expressed proteins (25 upregulated and 28 downregulated proteins) (Fig 4), which may be attributable to the low level of metabolic activity in cells during grain development.
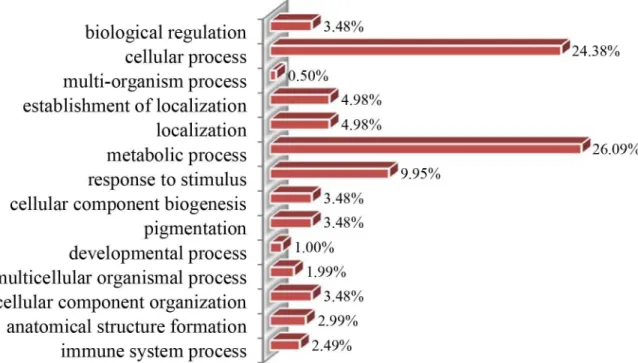
Classification of metabolic process-specific proteins. The 230 differentially accumulated proteins were categorized into 3 groups (biological process, cellular component, and molecular function) based on the results of GO analysis. According to the biological process properties (Fig 5), the main functional categories were metabolic process (26.09%), cellular process (24.38%), response to stimulus (9.95%), localization (4.98%), establishment of localization (4.98%), cellular component organization (3.48%), pigmentation (3.48%), cellular component biogenesis (3.48%), biological regulation (3.48%), anatomical structure formation (2.99%), immune system process (2.49%), multicellular organismal process (1.99%), developmental pro-cess (1.0%), and multi-organism propro-cess (0.5%). The most represented GO term was‘metabolic processes’, with 60 proteins differentially regulated during black rice grain development. Through KEGG (http://www.kegg.jp/), Metacyc (http://metacyc.org/), and UniPathway (http://www.grenoble.prabi.fr/obiwarehouse/unipathway) analyses, as well as a review of litera-ture indicated that the 60 differentially expressed proteins of the metabolic process GO cate-gory were assigned to 9 subgroups (Fig 6).
Validation using quantitative RT-PCR
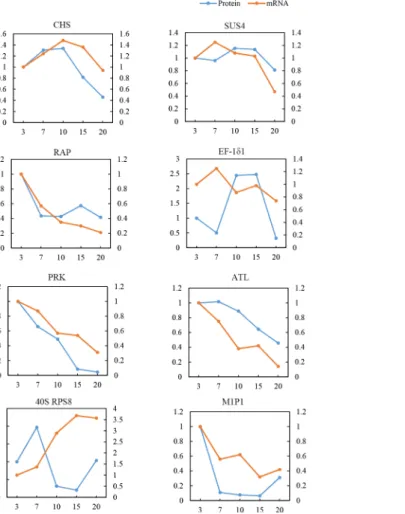
(SUS4), Ras-related protein RIC2(RAP), phosphoribulokinase (PRK), and phosphoribuloki-nase (ALT) showed expression patterns at 5 developmental stages that were similar to its pro-tein expression profiles. On the other hand, 2 genes encoding elongation factor 1-delta 2 (EF-1δ1) and 40S ribosomal protein S8 (40S RPS8) showed expression patterns that were opposite to that of its proteins. The mRNA land protein levels of EF-1δ1 and 40S RPS8 differed and may be attributable to translational or post-translational modifications.
Discussion
The pericarp of black rice seeds consists of high levels of ACN. However, information regard-ing metabolic mechanisms underlyregard-ing ACN biosynthesis is limited. In the present study, iTRAQ-based quantitative proteome analysis indicated the occurrence of dynamic changes in metabolic process proteins of black rice seeds at 5 developmental stages. The number of identi-fied metabolic proteins was significantly higher than that observed in previous reports using traditional gel-based approaches [36,62,63]. These metabolic proteins were mainly involved in C-metabolism, N-metabolism, as well as the flavonoid biosynthesis pathway.
Proteins involved in signal transduction
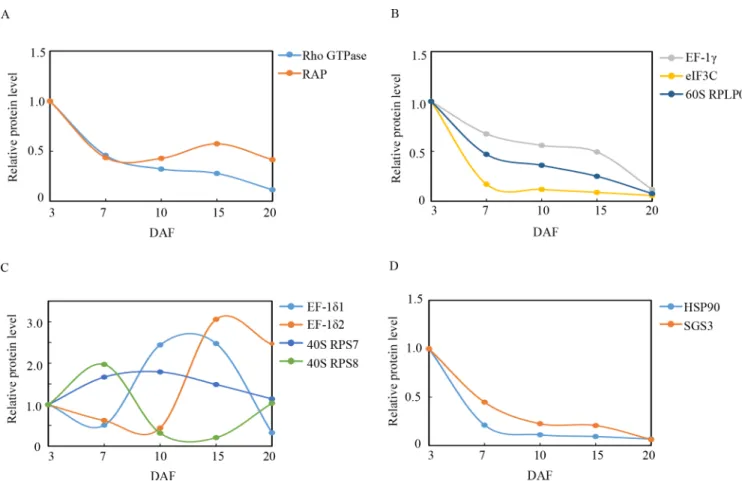
Black rice grains perceive ACN biosynthesis signals by using putative sensors, which are then transmitted to the cellular machinery via signal transduction in order to regulate gene expres-sion. Two proteins involved in signal transduction were detected and quantified in the present study, namely, mitochondrial Rho GTPase (Rho GTPase) and Ras-related protein RIC2 (RAP). These findings suggest that the Rho family GTPases, as well as RAP act as key molecular switches that control a variety of actin-based cellular processes, including the establishment of cell polarity, cellular morphogenesis, and motility of diverse eukaryotic organisms [64]. Rho GTPase and RAP were upregulated at 3 DAF and were downregulated during rice grain ripen-ing (Fig 8A). The observed changes in the characteristics of these 2 proteins and the TAC Fig 5. Biological process classification of differentially accumulated proteins during grain development.
trend were not entirely the same, which may be due to the fact that the signal transduction pathway is relatively complex. The identification of novel components expands our knowledge regarding ACN biosynthesis during black rice grain development.
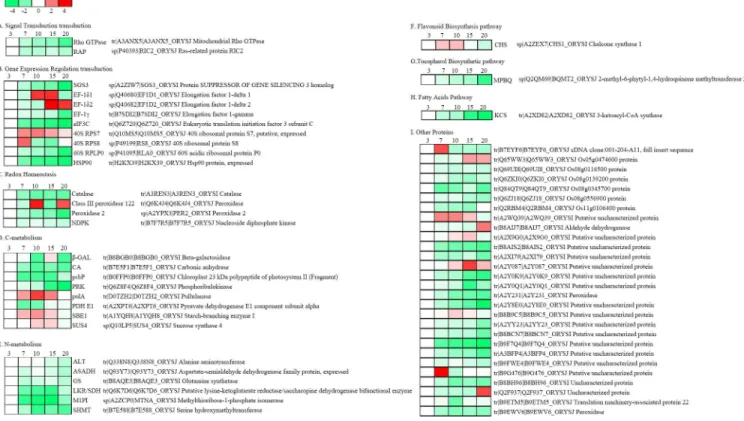
Proteins involved in gene expression regulation. ACN biosynthesis undergoes fine
tem-poral and spatial regulation involving numerous levels of regulation, including transcriptional or translational control [65]. Regulation of gene expression through translational control is common in various organisms. In terms of protein synthesis processes, mRNA translation is controlled at both global as well as message-specific levels, particularly during translation initi-ation [66]. Elonginiti-ation factors 1-delta 1 (EF-1δ1), -delta 2 (EF-1δ2,), 1-gamma (EF-1γ), Fig 6. Profiles of the functional protein clusters in relation to black rice grain development.A heat map representing the log2relative abundance of differentially expressed proteins during grain development in relation to the 3 days after flowering (DAF) stages was generated using Perseus (v1.4.1.3) and using the iTRAQ-derived quantitative data. The abbreviation for each protein is provided, using the gene index accession number as well as the sequence description assigned using UniProt. Proteins were grouped according to their known or putative role in metabolic pathways or cellular processes.
doi:10.1371/journal.pone.0159238.g006
Table 1. Design of primers used for quantitative PCR analysis.
Uniprot ID Genesymbol Forward primer (50-30) Reverse primer (50-30)
A2ZEX7 CHS GGAGGCGAAGGTTGGGCT GTGATGGGGACGCTGTGG
Q10LP5 SUS4 AGGCACACTGACTGTAGGTCCT AGTTACATTCCATTTTATTATCGG
P40393 RAP GCGTTGCTTGTCTATGATGTC AACTATGTTTGGGTCTGTATGGT
Q40680 EF-1δ1 GTCCTCAGTGTTGCTTGATGTC TGGTTCGGTGTAGAAGTAGTCC
Q6Z8F4 PRK AGGACTGGCAGGAAGGAGAAAG TGGGATGTAAGCCCTCAATGAC
Q338N8 ATL ATTGATGTTAGGGCTTTGGTAGTT AGTTCACTGACGCCACTTTGTAGA
P49199 40S RPS8 AGCGAAGAAAAGCAACCAT ACCTCCCACTGCCAAACTG
A2ZCP0 M1PI CTCCAGTCCATCGTCTACCACC ACCCAGAAACCTCTACAGCCAG
eukaryotic translation initiation factor 3 subunit C (eIF3C), 40S ribosomal protein S7(40S RPS7) and S8(40S RPS8), and 60S acidic ribosomal protein P0 (60S RPLP0) were all involved in the trans-lation and processing of proteins. These findings suggest that eukaryotic elongation factors (eEFs) are involved in the translation elongation cycle, which deliver aminoacyl-tRNAs (aa-tRNAs) to the elongation ribosome. Although 1γ, eIF3C, and 60S RPLP0 were downregulated (Fig 8B), EF-1δ1, EF-1δ2, 40S RPS7, and 40S RPS8 were upregulated during DAF10,15,10, and7, respectively (Fig 8C). The differential regulation of various components of the translation machinery is indica-tive of a complicated mechanism of controlling protein synthesis during grain development. Heat shock proteins function in minimizing the aggregation of newly synthesized proteins, thereby facil-itating the folding process s[67]. Heat shock protein 90 (HSP90) was downregulated during grain development (Fig 8D), which in turn may play a critical role in preventing clumping of denatured proteins and in facilitating protein refolding during grain development. In plants, post-transcrip-tional gene silencing (PTGS) involves the reduction in the levels of specific RNAs upon the intro-duction of homologous sequences into the plant genome. This particular reintro-duction is due to an increase in turnover of target RNA species, while transcription levels of corresponding genes are unaltered [68]. In the present study, a protein suppressor of gene silencing 3 (SGS3) was identified Fig 7. Comparative analysis of protein and mRNA profiles of 8 representative metabolic proteins.The x-axis represents days after flowering (DAF). The left y-axis indicates the relative protein level, whereas the right y-axis pertains to the relative mRNA level. The blue line represents the pattern of protein expression, and the orange line indicates the pattern of mRNA expression.
and quantified, which was downregulated during rice grain development (Fig 8D). However, the role of SGS3 in rice grain development remains elusive.
Proteins involved in redox homeostasis
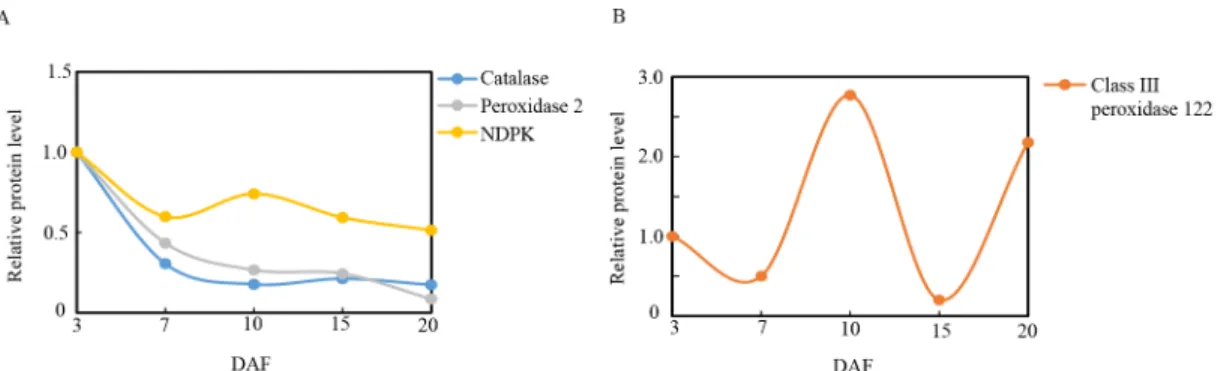
Redox homeostasis pertains to the metabolic interface that links stress perception with physio-logical responses [69]. Previous studies have shown that the early signaling events that control transcription factor expression, which in turn coordinates and regulates the entire flavonoid biosynthesis pathway, are redox-sensitive [70]. Plants regulate redox homeostasis using sophis-ticated mechanisms, including scavenging radicals by using peroxidases, (i.e., catalase, peroxi-dase 2, and class III peroxiperoxi-dase 122) and a nucleoside diphosphate kinase (NDPK), which were all identified in the present study. Nucleoside diphosphate kinase (NDPK) is a multifunctional protein that is involved in cell proliferation, development, as well as differentiation in eukary-otes. Aside from its basic enzymatic role involving phosphor-transfer as well as regeneration of nucleoside triphosphates, NDP kinase 2 is a component of the H2O2-activated MAPK signaling
pathway in plants and its upregulation alters cellular redox conditions. The expression of NDPK2 is induced by H2O2, and knockout of NDPK2 results in increased ROS accumulation
and stress sensitivity. On the other hand, upregulation of NDPK2 results in a decrease in H2O2levels and sensitivity to stress [71]. Catalase, peroxidase 2, and NDPK were
downregu-lated during ripening (Fig 9A), whereas class III peroxidase 122 was upregudownregu-lated by 2.76-fold Fig 8. Relative expression patterns of signal transduction, as well as gene expression regulation proteins during grain development.
The expression level was established in relation to 3 days after flowering (DAF) (vertical axis) at various developmental stages (horizontal axis, DAF).
in DAF10, sharply decreased in DAF15, and then upregulated by 2.18-fold at DAF20 (Fig 9B). The increase in class III peroxidase 122 activity directly correlated with protein abundance in proanthocyanidin-deficientA.thalianaseeds[72], and the increase in class III peroxidase 122 in DAF10 is correlated with changes in ACN levels. The pattern of antioxidant enzyme expres-sion in grain development demonstrates that when the levels of catalase and peroxidase 2 activ-ity decrease, class III peroxidase 122 (PODs) activactiv-ity takes over to maintain redox homeostasis.
Proteins involved in C-metabolism
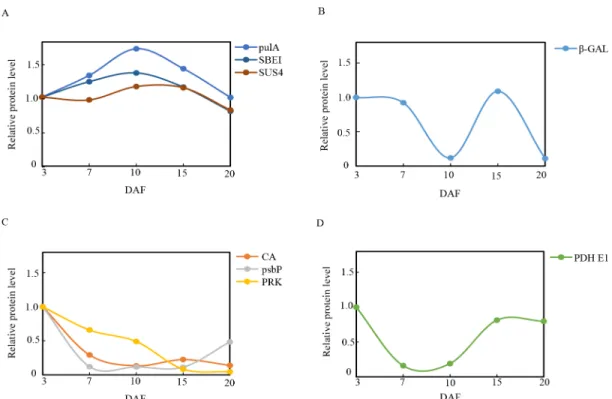
Carbohydrates, or sugars, play a major role in plant growth. Recent studies have shown the stimulatory effects of sugars on the synthesis of ACNs in various organs of numerous plant species [73]. Previous investigations have proven that ACN biosynthesis occurs in plants that are germinated or grown on a sugar-containing medium [74–76]. In particular, theCHSgene of petunia (Petunia hybrida) petals in transgenicArabidopsisleaves is activated by sugars [77], and petunia corollas that are culturedin vitroin the absence of sucrose (Suc) do not develop any pigmentation [78]. Tsukaya and Ohtoreported thatArabidopsiscultured on a Suc-contain-ing medium produced high amounts of ACNs [77,79]. Therefore, sugar content may play an essential role in ACN accumulation. In the present study, proteins involved in sugar metabo-lism included beta-galactosidase (β-GAL), sucrose synthase 4 (SUS4), pullulanase (pulA), and starch-branching enzyme I (SBE I).
Grain development pertains to the synthesis and accumulation of starch in endosperm cells. Sucrose is continuously cleaved into UDP-glucose and utilized in starch synthesis. Starch bio-synthesis is initiated using a substrate of ADP-glucose (ADP-Glu), which is formed by AGPase. ADP-Glu is transported into the cytoplasm via an ADP-glucose brittle-1 transporter. Various classes of sucrose synthase (SS) are recruited in order to lengthen the glucan chain, including SS 1–4 and granule-bound starch synthase, whereas starch-branching enzymes (SBEs) are involved in the formation of alpha-1,6-glucoside, and starch-debranching enzymes (DBEs) hydrolyzeα-(1,6) linkages of a polyglucan[80]. Three enzymes associated with sugar synthesis were detected in the present study, including SS4, SBE1, and Pullulanase[81]. All of these enzymes achieved the highest levels of expression at 10 DAF (Fig 10A). This is in agreement with the observed changes in ACN content. Theβ-GAL enzyme is an O-glycosyl hydrolase that hydrolyzes the glycosidic bond between 2 or more carbohydrates or between a carbohy-drate and a non-carbohycarbohy-drate moiety [82]. The present study demonstrated thatβ-GAL has a higher expression level at 3 DAF, but is dramatically downregulated at 10 DAF (Fig 10B), which could contribute to glucose accumulation and improve sucrose content during grain Fig 9. Relative expression patterns of redox homeostasis proteins during grain development.The expression level was established in relation to 3 days after flowering (DAF) (vertical axis) at various developmental stages (horizontal axis, DAF).
development. This result is concordant with previous reports that indicate that the onset of sucrose accumulation was accompanied by a decrease inβ-GAL activity [83].
During the early grain stage, photosynthesis generates the raw material, triosephosphate, for starch biosynthesis, which plays an essential role in the maintenance of endogenous O2
bal-ance [84]. The results of the present study showed that carbonic anhydrase (CA), chloroplast 23-kDa polypeptide of photosystem II (psbP), and phosphoribulokinase(PRK), which are nec-essary for photosynthesis, were upregulated at 3 DAF, particularly during the early grain devel-opment stages (Fig 10C), which in turn promoted plant photosynthesis as well as grain filling. The decline in the expression of these 3 enzymes during the later state of filling was suggestive of a down regulation of photosynthesis (Fig 10C), which has also been reported in tomatoes [85], apricots [86], grapes [87,88], and palm [89]. The down regulation of proteins related to photosynthesis is correlated to the reduction in pyruvate dehydrogenaseE1 component (PDH E1). The PDH E1 component is a major enzyme that catalyzes oxidative decarboxylation of pyruvate to acetyl CoA, which serves as the entry point of carbohydrates directly into the Krebs cycle [90]. In the present study, PDH E1 was downregulated on DAF7 and10 (Fig 10D). This may indicate that while the photosynthetic rate declined, the decrease in abundance of the PDH E1 component reduced sugar consumption, which might be a signal that induces the acceleration of ACN biosynthesis [73].
Proteins involved in N-metabolism
Plant growth and development are controlled by the concerted activities of signaling pathways, which are triggered by different environmental conditions as well as developmental cues. Nutrient availability, particularly N, is one of the major factors that regulate plant metabolism Fig 10. Relative expression patterns of C-metabolism proteins during grain development.The expression level was established in relation to 3 days after flowering (DAF) (vertical axis) at various developmental stages (horizontal axis, DAF).
and development [91]. N limitation induces ACN accumulation in plants, which in turn influ-ences phenylpropanoid metabolic flux as well as switches ACN biosynthesis to lignin biosyn-thesis [92]. Proteins involved in N-metabolism that were identified in our study included glutamine synthetase (GS), alanine aminotransferase (ATL), aspartate-semialdehyde dehydro-genase (ASADH), lysine-ketoglutarate reductase/saccharopine dehydrodehydro-genase bifunctional enzyme (LKR/SDH), methylthioribose-1-phosphate isomerase (M1PI), and serine hydroxy-methyltransferase (SHMT).
GS is triggers the first step of ammonium assimilation and transformation this into gluta-mine and glutamate, which are the major compounds of the amino acid biosynthetic pathway [93]. More than 95% of inorganic N in higher plants is assimilated and converted to glutamate and glutamine through the glutamine synthetize pathway, and then utilized in the generation of other amino acids during the catalysis of aspartate aminotransferase and alanine amino-transferase (ATL)[94]. The present study demonstrated that GS and ATL had a lower expres-sion level at DAF 7 and 10 (Fig 11A), which was consistent with the findings of a proteomics study conducted by Zhang [95]. The decrease in GS and ATL during grain development may be attributable to N insufficiency and upregulated ACN synthesis and accumulation.
In plants, ASADH produces the branch point intermediate that occurs between the lysine and threonine/methionine pathways [96]. LKR/SDH is a bifunctional enzyme that catalyzes the first two steps of plant lysine catabolism, which controls the accumulation of different cata-bolic products of Lys[97]. M1PI functions in methionine salvage pathways in plants [98]. SHMT is a tetramer that induces the reversible conversion of serine and tetrahydrofolate (THF) into Gly and 5, 10-methylene THF [99]. The expression of 4 proteins (ASADH, LKR/ SDH, M1PI, and SHMT)decreased during grain development(Fig 11A), which may contribute to insufficiency in N and induce ACN accumulation in black rice grains.
Proteins involved in the flavonoid biosynthesis pathway
ACNs are generated by the phenylpropanoid pathway, which is initiated by the conversion of phenylalanine into cinnamic acid via phenylalanine ammonia lyase (PAL), and then diverges into various branches atρ-coumaroyl CoA. One branch involves the flavonoid pathway, where
in chalcone synthase (CHS) catalyzes the formation of the flavonoid skeleton, which is derived fromρ-coumaroyl CoA, and in turn leads to the synthesis of flavonols, cyanidins, and ACNs
[92]. The present study showed that CHS was upregulated, peaking at DAF10, which corre-sponded to the middle of the grain development process. This protein was then downregulated at DAF20, when the development process was completed (Fig 11B). This result was correlated Fig 11. Relative expression patterns of N-metabolism and functional proteins during grain development.The expression level was established in relation to 3 days after flowering (DAF) (vertical axis) at various developmental stages (horizontal axis, DAF).
with the observed expression level of CHS inP.dactylifrea[89], and the changing trends of ACN contents in the present study.
Proteins involved in the tocopherol biosynthetic pathway
Tocotrienols pertain to the primary form of vitamin E present in seeds of majority of monocot plants, including cereals (e.g., rice and wheat) [100]. 2-Methyl-6-phytyl-1,4-hydroquinone methyltransferase 2 (MPBQ MT) is a major component enzyme that is involved in the key meth-ylation step in tocopherol (vitamin E) synthesis, which mediates the conversion of 2-methyl-6-phytyl-1,4-hydroquinone into 2,3-dimethyl-2-methyl-6-phytyl-1,4-hydroquinone and 2-methyl-6-sola-nyl-1,4-benzoquinoneto plastoquinone. Recent studies on the tocopherol-deficientvte1mutants
ofA.thalianaindicated that the down regulation of tocopherol increases jasmonic acid levels in
plants, whereas ACN biosynthesis in epidermal, vascular, and mesophyll cells are upregulated by Fig 12. Quantification of black rice grain proteins that are related to ACN biosynthesis.RAP, Ras-related protein RIC2; NDPK, Nucleoside diphosphate kinase; CA, Carbonic anhydrase; psbP, Chloroplast 23-kDa polypeptide of photosystem II; PRK, Phosphoribulokinase; PDH E1, Pyruvate dehydrogenase E1 component subunit alpha;β-GAL, Beta-galactosidase; pulA, Pullulanase; SBE1, Starch-branching enzyme I; SUS4, Sucrose synthase 4; ALT, Alanine
aminotransferase; ASADH, Aspartate-semialdehyde dehydrogenase family protein; GS, Glutamine synthetase; LKR/SDH, Putative lysine-ketoglutarate reductase/saccharopine dehydrogenase bifunctional enzyme; M1PI, Methylthioribose-1-phosphate isomerase; SHMT, Serine hydroxymethyltransferase; SGS3, Protein SUPPRESSOR OF GENE SILENCING 3 homolog; MPBQ MT, 2-methyl-6-phytyl-1,4-hydroquinone methyltransferase 2; EF-1δ1, Elongation factor 1-delta 1; EF-1δ2, Elongation factor 1-delta 2; EF-1γ, Elongation factor 1-gamma; eIF3C, Eukaryotic translation initiation factor 3 subunit C; 40S RPS7, 40S ribosomal protein S7; 40S RPS8, 40S ribosomal protein S8; 60S RPLP0, 60S acidic ribosomal protein P0; HSP90, Hsp90 protein; CHS, Chalcone synthase 1. The protein levels of deregulated enzymes are indicated by colored squares that represent changes in expression (log2ratio) at various developmental stages in relation to the 3 DAF stage. In a sequence order (left to right), stages are presented from 3, 7, 10, 15, and 20 DAF.
jasmonic acid [101,102]. In the present study, MPBQ MT was increasingly downregulated from 3 to 20DAF (Fig 11B), which may have induced ACN biosynthesis by upregulating jasmonic acid levels.
Proteins involved in fatty acid pathways
Very long-chain fatty acids (VLCFAs) are essential precursors of cuticular waxes as well as ali-phatic suberins in plants. The condensation of C units into an acyl CoA via 3-ketoacyl CoA synthase (KCS) is the first committed step of VLCFA biosynthesis[103]. In the present study, KCS was downregulated during rice grain development (Fig 11B). The observed decrease in KCS was correlated with a reduction in fatty acid synthesis during grain development.
Conclusions
In summary, we investigated the dynamic changes in protein expression levels during five sequential developmental stages that were associated with black rice grain filling, namely from 3 to 20 DAF. The results of the present study indicated that during plant development, proteins involved in both flavonoid and starch synthesis are upregulated, and proteins that were related to other categories and subcategories were downregulated. Importantly, the present study revealed that CHS is a key enzyme in the ACN biosynthetic pathway in black rice. In addition, we determined that a high sugar content and deficiency in N metabolism promoted ACN bio-synthesis. Our results also showed that the coordination of various metabolic and cellular pro-cesses is related to ACN synthesis and accumulation during seed development. A simple model of pathways associated with ACN biosynthesis is presented inFig 12. The results of the present study provide novel clues that facilitate in better understanding the metabolic network that is involved in ACN accumulation in developing seeds.
Supporting Information
S1 Table. Differentially expressed proteins in black rice grains at five developmental stages.
(XLSX)
Acknowledgments
This work was supported by the National Key Technology R&D Program (2013BAD01B05) and the Science and Technology Innovation Platform Development Program of Fujian Agri-culture and Forestry University (PTJH13001, PTJH12015). We gratefully acknowledge Shang-hai Omicsspace Biotechnology Co. Ltd. for technical assistance with the peptide/protein identification.
Author Contributions
Conceived and designed the experiments: JZ LC. Performed the experiments: LC YH. Analyzed the data: MX. Contributed reagents/materials/analysis tools: ZC. Wrote the paper: DZ JZ.
References
1. Wang E, Wang J, Zhu X, Hao W, Wang L, Li Q, et al. Control of rice grain-filling and yield by a gene with a potential signature of domestication. Nature genetics. 2008; 40(11):1370–4. Epub 2008/09/30.
doi:10.1038/ng.220PMID:18820698.
2. Ichikawa H, Ichiyanagi T, Xu B, Yoshii Y, Nakajima M, Konishi T. Antioxidant Activity of Anthocyanin Extract from Purple Black Rice. Journal of medicinal food. 2001; 4(4):211–8. Epub 2003/03/18. doi:
3. Kim CK, Cho MA, Choi YH, Kim JA, Kim YH, Kim YK, et al. Identification and characterization of seed-specific transcription factors regulating anthocyanin biosynthesis in black rice. Journal of applied genetics. 2011; 52(2):161–9. Epub 2011/02/03. doi:10.1007/s13353-011-0027-3PMID:21286901;
PubMed Central PMCID: PMCPmc3088801.
4. Ryu SN, Park SZ, Ho CT. High performance liquid chromatographic determination of anthocyanin pig-ments in some varieties of black rice. Journal of food and Drug Analysis. 1998; 6(4):729–36.
5. Wang Q, Han P, Zhang M, Xia M, Zhu H, Ma J, et al. Supplementation of black rice pigment fraction improves antioxidant and anti-inflammatory status in patients with coronary heart disease. Asia Pacific journal of clinical nutrition. 2007; 16 Suppl 1:295–301. Epub 2007/03/30. PMID:17392122.
6. Wu X, Beecher GR, Holden JM, Haytowitz DB, Gebhardt SE, Prior RL. Concentrations of anthocya-nins in common foods in the United States and estimation of normal consumption. Journal of agricul-tural and food chemistry. 2006; 54(11):4069–75. Epub 2006/05/25. doi:10.1021/jf060300lPMID:
16719536.
7. Hiemori M, Koh E, Mitchell AE. Influence of cooking on anthocyanins in black rice (Oryza sativa L. japonica var. SBR). Journal of agricultural and food chemistry. 2009; 57(5):1908–14. Epub 2009/03/
05. doi:10.1021/jf803153zPMID:19256557.
8. Philpott M, Gould KS, Lim C, Ferguson LR. In situ and in vitro antioxidant activity of sweetpotato anthocyanins. Journal of agricultural and food chemistry. 2004; 52(6):1511–3. Epub 2004/03/20. doi:
10.1021/jf034593jPMID:15030203.
9. Nam SH, Choi SP, Kang MY, Koh HJ, Kozukue N, Friedman M. Antioxidative activities of bran extracts from twenty one pigmented rice cultivars. Food Chemistry. 2006; 94(4):613–20.
10. Renaud S, de Lorgeril M. Wine, alcohol, platelets, and the French paradox for coronary heart disease. Lancet (London, England). 1992; 339(8808):1523–6. Epub 1992/06/20. PMID:1351198.
11. Joseph JA, Shukitt-Hale B, Denisova NA, Bielinski D, Martin A, McEwen JJ, et al. Reversals of age-related declines in neuronal signal transduction, cognitive, and motor behavioral deficits with blue-berry, spinach, or strawberry dietary supplementation. The Journal of neuroscience: the official journal of the Society for Neuroscience. 1999; 19(18):8114–21. Epub 1999/09/10. PMID:10479711. 12. Seeram NP, Adams LS, Hardy ML, Heber D. Total cranberry extract versus its phytochemical
constit-uents: antiproliferative and synergistic effects against human tumor cell lines. Journal of agricultural and food chemistry. 2004; 52(9):2512–7. Epub 2004/04/29. doi:10.1021/jf0352778PMID:15113149. 13. Hou DX, Fujii M, Terahara N, Yoshimoto M. Molecular Mechanisms Behind the Chemopreventive
Effects of Anthocyanidins. Journal of biomedicine & biotechnology. 2004; 2004(5):321–5. Epub 2004/
12/04. doi:10.1155/s1110724304403040PMID:15577196; PubMed Central PMCID: PMCPmc1082887.
14. Xia X, Ling W, Ma J, Xia M, Hou M, Wang Q, et al. An anthocyanin-rich extract from black rice enhances atherosclerotic plaque stabilization in apolipoprotein E-deficient mice. The Journal of nutri-tion. 2006; 136(8):2220–5. Epub 2006/07/22. PMID:16857844.
15. Kwon SH, Ahn IS, Kim SO, Kong CS, Chung HY, Do MS, et al. Anti-obesity and hypolipidemic effects of black soybean anthocyanins. Journal of medicinal food. 2007; 10(3):552–6. Epub 2007/09/25. doi:
10.1089/jmf.2006.147PMID:17887951.
16. Guo H, Ling W, Wang Q, Liu C, Hu Y, Xia M, et al. Effect of anthocyanin-rich extract from black rice (Oryza sativa L. indica) on hyperlipidemia and insulin resistance in fructose-fed rats. Plant foods for human nutrition (Dordrecht, Netherlands). 2007; 62(1):1–6. Epub 2006/12/26. doi:
10.1007/s11130-006-0031-7PMID:17187297.
17. Sasaki R, Nishimura N, Hoshino H, Isa Y, Kadowaki M, Ichi T, et al. Cyanidin 3-glucoside ameliorates hyperglycemia and insulin sensitivity due to downregulation of retinol binding protein 4 expression in diabetic mice. Biochemical pharmacology. 2007; 74(11):1619–27. Epub 2007/09/18. doi:10.1016/j.
bcp.2007.08.008PMID:17869225.
18. Matsumoto H, Nakamura Y, Tachibanaki S, Kawamura S, Hirayama M. Stimulatory effect of cyanidin 3-glycosides on the regeneration of rhodopsin. Journal of agricultural and food chemistry. 2003; 51 (12):3560–3. Epub 2003/05/29. doi:10.1021/jf034132yPMID:12769524.
19. Tsuda T, Horio F, Uchida K, Aoki H, Osawa T. Dietary cyanidin 3-O-beta-D-glucoside-rich purple corn color prevents obesity and ameliorates hyperglycemia in mice. The Journal of nutrition. 2003; 133 (7):2125–30. Epub 2003/07/04. PMID:12840166.
20. Wilmouth RC, Turnbull JJ, Welford RW, Clifton IJ, Prescott AG, Schofield CJ. Structure and mecha-nism of anthocyanidin synthase from Arabidopsis thaliana. Structure (London, England: 1993). 2002; 10(1):93–103. Epub 2002/02/14. PMID:11796114.
22. Mori K, Sugaya S, Gemma H. Decreased anthocyanin biosynthesis in grape berries grown under ele-vated night temperature condition. Scientia Horticulturae. 2005; 105(3):319–30.
23. Lo Piero AR, Puglisi I, Rapisarda P, Petrone G. Anthocyanins accumulation and related gene expres-sion in red orange fruit induced by low temperature storage. Journal of agricultural and food chemistry. 2005; 53(23):9083–8. Epub 2005/11/10. doi:10.1021/jf051609sPMID:16277406.
24. Ubi BE, Honda C, Bessho H, Kondo S, Wada M, Kobayashi S, et al. Expression analysis of anthocya-nin biosynthetic genes in apple skin: effect of UV-B and temperature. Plant Science. 2006; 170 (3):571–8.
25. He F, Pan QH, Shi Y, Duan CQ. Biosynthesis and genetic regulation of proanthocyanidins in plants. Molecules (Basel, Switzerland). 2008; 13(10):2674–703. Epub 2008/10/31. doi:10.3390/
molecules13102674PMID:18971863.
26. Zhang Y, Butelli E, Martin C. Engineering anthocyanin biosynthesis in plants. Current opinion in plant biology. 2014; 19:81–90. Epub 2014/06/08. doi:10.1016/j.pbi.2014.05.011PMID:24907528. 27. Holton TA, Cornish EC. Genetics and Biochemistry of Anthocyanin Biosynthesis. The Plant cell.
1995; 7(7):1071–83. Epub 1995/07/01. doi:10.1105/tpc.7.7.1071PMID:12242398; PubMed Central
PMCID: PMCPmc160913.
28. Lepiniec L, Debeaujon I, Routaboul JM, Baudry A, Pourcel L, Nesi N, et al. Genetics and biochemistry of seed flavonoids. Annual review of plant biology. 2006; 57:405–30. Epub 2006/05/04. doi:10.1146/
annurev.arplant.57.032905.105252PMID:16669768.
29. Kim BG, Kim JH, Min SY, Shin K-H, Kim JH, Kim HY, et al. Anthocyanin content in rice is related to expression levels of anthocyanin biosynthetic genes. Journal of Plant Biology. 2007; 50(2):156–60. 30. Tian Q, Giusti MM, Stoner GD, Schwartz SJ. Screening for anthocyanins using high-performance
liq-uid chromatography coupled to electrospray ionization tandem mass spectrometry with precursor-ion analysis, product-ion analysis, common-neutral-loss analysis, and selected reaction monitoring. Jour-nal of chromatography A. 2005; 1091(1–2):72–82. Epub 2006/01/06. PMID:16395794.
31. Hu C, Zawistowski J, Ling W, Kitts DD. Black rice (Oryza sativa L. indica) pigmented fraction sup-presses both reactive oxygen species and nitric oxide in chemical and biological model systems. Jour-nal of agricultural and food chemistry. 2003; 51(18):5271–7. Epub 2003/08/21. doi:10.1021/
jf034466nPMID:12926869.
32. Abdel-Aal el SM, Young JC, Rabalski I. Anthocyanin composition in black, blue, pink, purple, and red cereal grains. Journal of agricultural and food chemistry. 2006; 54(13):4696–704. Epub 2006/06/22.
doi:10.1021/jf0606609PMID:16787017.
33. Ding M, Feng R, Wang SY, Bowman L, Lu Y, Qian Y, et al. Cyanidin-3-glucoside, a natural product derived from blackberry, exhibits chemopreventive and chemotherapeutic activity. The Journal of bio-logical chemistry. 2006; 281(25):17359–68. Epub 2006/04/19. doi:10.1074/jbc.M600861200PMID:
16618699.
34. Kim C-K, Cho M-A, Choi Y-H, Kim J-A, Kim Y-H, Kim Y-K, et al. Identification and characterization of seed-specific transcription factors regulating anthocyanin biosynthesis in black rice. Journal of applied genetics. 2011; 52(2):161–9. doi:10.1007/s13353-011-0027-3PMID:21286901
35. Anderson NL, Anderson NG. Proteome and proteomics: new technologies, new concepts, and new words. Electrophoresis. 1998; 19(11):1853–61. Epub 1998/09/18. doi:10.1002/elps.1150191103
PMID:9740045.
36. Xu SB, Li T, Deng ZY, Chong K, Xue Y, Wang T. Dynamic proteomic analysis reveals a switch between central carbon metabolism and alcoholic fermentation in rice filling grains. Plant physiology. 2008; 148(2):908–25. Epub 2008/08/30. doi:10.1104/pp.108.125633PMID:18753281; PubMed
Central PMCID: PMCPmc2556828.
37. Xu SB, Yu HT, Yan LF, Wang T. Integrated proteomic and cytological study of rice endosperms at the storage phase. Journal of proteome research. 2010; 9(10):4906–18. Epub 2010/08/18. doi:10.1021/
pr900954pPMID:20712379.
38. Lin SK, Chang MC, Tsai YG, Lur HS. Proteomic analysis of the expression of proteins related to rice quality during caryopsis development and the effect of high temperature on expression. Proteomics. 2005; 5(8):2140–56. Epub 2005/04/27. doi:10.1002/pmic.200401105PMID:15852341.
39. Chu P, Yan GX, Yang Q, Zhai LN, Zhang C, Zhang FQ, et al. iTRAQ-based quantitative proteomics analysis of Brassica napus leaves reveals pathways associated with chlorophyll deficiency. Journal of proteomics. 2015; 113:244–59. Epub 2014/10/16. doi:10.1016/j.jprot.2014.10.005PMID:25317966. 40. Vertommen A, Panis B, Swennen R, Carpentier SC. Challenges and solutions for the identification of membrane proteins in non-model plants. Journal of proteomics. 2011; 74(8):1165–81. Epub 2011/03/
41. Nunn BL, Aker JR, Shaffer SA, Tsai S, Strzepek RF, Boyd PW, et al. Deciphering diatom biochemical pathways via whole-cell proteomics. Aquatic microbial ecology: international journal. 2009; 55 (3):241–53. Epub 2009/10/16. doi:10.3354/ame01284PMID:19829762; PubMed Central PMCID:
PMCPmc2761042.
42. Ryu S, Gallis B, Goo YA, Shaffer SA, Radulovic D, Goodlett DR. Comparison of a label-free quantita-tive proteomic method based on peptide ion current area to the isotope coded affinity tag method. Cancer informatics. 2008; 6:243–55. Epub 2008/01/01. PMID:19259412; PubMed Central PMCID:
PMCPmc2623286.
43. Chen J, Ryu S, Gharib SA, Goodlett DR, Schnapp LM. Exploration of the normal human bronchoal-veolar lavage fluid proteome. Proteomics Clinical applications. 2008; 2(4):585–95. Epub 2008/04/01.
doi:10.1002/prca.200780006PMID:21136857; PubMed Central PMCID: PMCPmc4432467.
44. Du C, Liang JR, Chen DD, Xu B, Zhuo WH, Gao YH, et al. iTRAQ-based proteomic analysis of the metabolism mechanism associated with silicon response in the marine diatom Thalassiosira pseudo-nana. Journal of proteome research. 2014; 13(2):720–34. Epub 2014/01/01. doi:10.1021/pr400803w
PMID:24372006.
45. Ma C, Zhou J, Chen G, Bian Y, Lv D, Li X, et al. iTRAQ-based quantitative proteome and phosphopro-tein characterization reveals the central metabolism changes involved in wheat grain development. BMC genomics. 2014; 15:1029. Epub 2014/11/28. doi:10.1186/1471-2164-15-1029PMID: 25427527; PubMed Central PMCID: PMCPmc4301063.
46. Kambiranda D, Katam R, Basha SM, Siebert S. iTRAQ-based quantitative proteomics of developing and ripening muscadine grape berry. Journal of proteome research. 2014; 13(2):555–69. Epub 2013/
11/21. doi:10.1021/pr400731pPMID:24251720; PubMed Central PMCID: PMCPmc3970428.
47. Martinez-Esteso MJ, Vilella-Anton MT, Pedreno MA, Valero ML, Bru-Martinez R. iTRAQ-based pro-tein profiling provides insights into the central metabolism changes driving grape berry development and ripening. BMC plant biology. 2013; 13:167. Epub 2013/10/25. doi:10.1186/1471-2229-13-167 PMID:24152288; PubMed Central PMCID: PMCPmc4016569.
48. Lucker J, Laszczak M, Smith D, Lund ST. Generation of a predicted protein database from EST data and application to iTRAQ analyses in grape (Vitis vinifera cv. Cabernet Sauvignon) berries at ripening initiation. BMC genomics. 2009; 10:50. Epub 2009/01/28. doi:10.1186/1471-2164-10-50PMID: 19171055; PubMed Central PMCID: PMCPmc2637896.
49. Dong M, Gu J, Zhang L, Chen P, Liu T, Deng J, et al. Comparative proteomics analysis of superior and inferior spikelets in hybrid rice during grain filling and response of inferior spikelets to drought stress using isobaric tags for relative and absolute quantification. Journal of proteomics. 2014; 109:382–99. Epub 2014/07/25. doi:10.1016/j.jprot.2014.07.001PMID:25058577.
50. Ishimaru T, Matsuda T, Ohsugi R, Yamagishi T. Morphological development of rice caryopses located at the different positions in a panicle from early to middle stage of grain filling. Functional Plant Biol-ogy. 2003; 30(11):1139–49.
51. Abdel-Aal E-S, Hucl P. A rapid method for quantifying total anthocyanins in blue aleurone and purple pericarp wheats. Cereal chemistry. 1999; 76(3):350–4.
52. Dai S, Chen T, Chong K, Xue Y, Liu S, Wang T. Proteomics identification of differentially expressed proteins associated with pollen germination and tube growth reveals characteristics of germinated Oryza sativa pollen. Molecular & cellular proteomics: MCP. 2007; 6(2):207–30. Epub 2006/11/30. doi:
10.1074/mcp.M600146-MCP200PMID:17132620.
53. Wisniewski JR, Zougman A, Nagaraj N, Mann M. Universal sample preparation method for proteome analysis. Nature methods. 2009; 6(5):359–62. Epub 2009/04/21. doi:10.1038/nmeth.1322PMID:
19377485.
54. Cox J, Mann M. MaxQuant enables high peptide identification rates, individualized p.p.b.-range mass accuracies and proteome-wide protein quantification. Nature biotechnology. 2008; 26(12):1367–72.
Epub 2008/11/26. doi:10.1038/nbt.1511PMID:19029910.
55. Chong PM, Lynch T, McCorrister S, Kibsey P, Miller M, Gravel D, et al. Proteomic analysis of a NAP1 Clostridium difficile clinical isolate resistant to metronidazole. PloS one. 2014; 9(1):e82622. Epub 2014/01/09. doi:10.1371/journal.pone.0082622PMID:24400070; PubMed Central PMCID: PMCPmc3882210.
56. Conesa A, Gotz S, Garcia-Gomez JM, Terol J, Talon M, Robles M. Blast2GO: a universal tool for annotation, visualization and analysis in functional genomics research. Bioinformatics (Oxford, England). 2005; 21(18):3674–6. Epub 2005/08/06. doi:10.1093/bioinformatics/bti610PMID:
16081474.
58. Oike Y, Tabata M. Angiopoietin-like proteins—potential therapeutic targets for metabolic syndrome
and cardiovascular disease. Circulation journal: official journal of the Japanese Circulation Society. 2009; 73(12):2192–7. Epub 2009/10/31. PMID:19875897.
59. Pfaffl MW. A new mathematical model for relative quantification in real-time RT-PCR. Nucleic acids research. 2001; 29(9):e45. Epub 2001/05/09. PMID:11328886; PubMed Central PMCID: PMCPmc55695.
60. Shao Y, Xu F, Sun X, Bao J, Beta T. Phenolic acids, anthocyanins, and antioxidant capacity in rice (Oryza sativa L.) grains at four stages of development after flowering. Food Chem. 2014; 143:90–6.
Epub 2013/09/24. doi:10.1016/j.foodchem.2013.07.042PMID:24054217.
61. Sompong R, Siebenhandl-Ehn S, Linsberger-Martin G, Berghofer E. Physicochemical and antioxida-tive properties of red and black rice varieties from Thailand, China and Sri Lanka. Food Chemistry. 2011; 124(1):132–40.
62. Xu SB, Yu HT, Yan LF, Wang T. Integrated proteomic and cytological study of rice endosperms at the storage phase. Journal of proteome research. 2010; 9(10):4906–18. doi:10.1021/pr900954pPMID:
20712379
63. He D, Han C, Yao J, Shen S, Yang P. Constructing the metabolic and regulatory pathways in germi-nating rice seeds through proteomic approach. Proteomics. 2011; 11(13):2693–713. Epub 2011/06/
02. doi:10.1002/pmic.201000598PMID:21630451.
64. Lin Y, Wang Y, Zhu J, Yang Z. Localization of a Rho GTPase implies a role in tip growth and move-ment of the generative cell in pollen tubes. The Plant Cell. 1996; 8(2):293–303. PMID:12239385 65. Shan X, Zhang Y, Peng W, Wang Z, Xie D. Molecular mechanism for jasmonate-induction of
anthocy-anin accumulation in Arabidopsis. Journal of experimental botany. 2009; 60(13):3849–60. doi:10.
1093/jxb/erp223PMID:19596700
66. Xia C, Wang YJ, Li WQ, Chen YR, Deng Y, Zhang XQ, et al. The Arabidopsis eukaryotic translation initiation factor 3, subunit F (AteIF3f), is required for pollen germination and embryogenesis. The Plant Journal. 2010; 63(2):189–202. doi:10.1111/j.1365-313X.2010.04237.xPMID:20444226
67. Di Carli M, Zamboni A, Pe ME, Pezzotti M, Lilley KS, Benvenuto E, et al. Two-dimensional differential in gel electrophoresis (2D-DIGE) analysis of grape berry proteome during postharvest withering. Jour-nal of proteome research. 2010; 10(2):429–46. doi:10.1021/pr1005313PMID:20945943
68. Voinnet O, Pinto YM, Baulcombe DC. Suppression of gene silencing: a general strategy used by diverse DNA and RNA viruses of plants. Proceedings of the National Academy of Sciences. 1999; 96 (24):14147–52.
69. Foyer CH, Noctor G. Redox homeostasis and antioxidant signaling: a metabolic interface between stress perception and physiological responses. The Plant Cell. 2005; 17(7):1866–75. PMID:
15987996
70. Page M, Sultana N, Paszkiewicz K, Florance H, Smirnoff N. The influence of ascorbate on anthocya-nin accumulation during high light acclimation in Arabidopsis thaliana: further evidence for redox con-trol of anthocyanin synthesis. Plant, cell & environment. 2012; 35(2):388–404.
71. Moon H, Lee B, Choi G, Shin D, Prasad DT, Lee O, et al. NDP kinase 2 interacts with two oxidative stress-activated MAPKs to regulate cellular redox state and enhances multiple stress tolerance in transgenic plants. Proceedings of the National Academy of Sciences. 2003; 100(1):358–63. 72. Jia L, Xu W, Li W, Ye N, Liu R, Shi L, et al. Class III peroxidases are activated in
proanthocyanidin-deficient Arabidopsis thaliana seeds. Annals of botany. 2013; 111(5):839–47. doi:10.1093/aob/
mct045PMID:23448691
73. Solfanelli C, Poggi A, Loreti E, Alpi A, Perata P. Sucrose-specific induction of the anthocyanin biosyn-thetic pathway in Arabidopsis. Plant physiology. 2006; 140(2):637–46. PMID:16384906
74. Baier M, Hemmann G, Holman R, Corke F, Card R, Smith C, et al. Characterization of mutants in Ara-bidopsis showing increased sugar-specific gene expression, growth, and developmental responses. Plant Physiology. 2004; 134(1):81–91. PMID:14684841
75. Németh K, Salchert K, Putnoky P, Bhalerao R, Koncz-Kálmán Z, Stankovic-Stangeland B, et al. Pleio-tropic control of glucose and hormone responses by PRL1, a nuclear WD protein, in Arabidopsis. Genes & development. 1998; 12(19):3059–73.
76. Mita S, Hirano H, Nakamura K. Negative Regulation in the Expression of a Sugar-Inducible Gene in Arabidopsis thaliana (A Recessive Mutation Causing Enhanced Expression of a Gene for [beta]-Amy-lase). Plant physiology. 1997; 114(2):575–82. PMID:9193090
78. Weiss D. Regulation of flower pigmentation and growth: multiple signaling pathways control anthocya-nin synthesis in expanding petals. Physiologia plantarum. 2000; 110(2):152–7.
79. Ohto M-a, Onai K, Furukawa Y, Aoki E, Araki T, Nakamura K. Effects of sugar on vegetative develop-ment and floral transition in Arabidopsis. Plant Physiology. 2001; 127(1):252–61. PMID:11553753 80. Keeling PL, Wood JR, Tyson RH, Bridges IG. Starch biosynthesis in developing wheat grain Evidence
against the Direct Involvement of Triose Phosphates in the Metabolic Pathway. Plant Physiology. 1988; 87(2):311–9. PMID:16666140
81. Hii SL, Tan JS, Ling TC, Ariff AB. Pullulanase: role in starch hydrolysis and potential industrial applica-tions. Enzyme research. 2012; 2012.
82. Henrissat B, Callebaut I, Fabrega S, Lehn P, Mornon JP, Davies G. Conserved catalytic machinery and the prediction of a common fold for several families of glycosyl hydrolases. Proceedings of the National Academy of Sciences of the United States of America. 1995; 92(15):7090–4. PMID:
PMC41477.
83. Calviño M, Bruggmann R, Messing J. Screen of genes linked to high-sugar content in stems by com-parative genomics. Rice. 2008; 1(2):166–76.
84. Tschiersch H, Borisjuk L, Rutten T, Rolletschek H. Gradients of seed photosynthesis and its role for oxygen balancing. Biosystems. 2011; 103(2):302–8. doi:10.1016/j.biosystems.2010.08.007PMID:
20837098
85. Faurobert M, Mihr C, Bertin N, Pawlowski T, Negroni L, Sommerer N, et al. Major proteome variations associated with cherry tomato pericarp development and ripening. Plant Physiology. 2007; 143 (3):1327–46. PMID:17208958
86. D'Ambrosio C, Arena S, Rocco M, Verrillo F, Novi G, Viscosi V, et al. Proteomic analysis of apricot fruit during ripening. Journal of proteomics. 2013; 78:39–57. doi:10.1016/j.jprot.2012.11.008PMID:
23178875
87. Terrier N, Ageorges A, Abbal P, Romieu C. Generation of ESTs from grape berry at various develop-mental stages. Journal of Plant Physiology. 2001; 158(12):1575–83.
88. Martínez-Esteso MJ, Sellés-Marchart S, Lijavetzky D, Pedreño MA, Bru-Martínez R. A DIGE-based
quantitative proteomic analysis of grape berry flesh development and ripening reveals key events in sugar and organic acid metabolism. Journal of experimental botany. 2011; 62(8):2521–69. doi:10.
1093/jxb/erq434PMID:21576399
89. Marondedze C, Gehring C, Thomas L. Dynamic changes in the date palm fruit proteome during devel-opment and ripening. Horticulture Research. 2014; 1:14039. doi:10.1038/hortres.2014.39PMID: 26504545
90. Budde R, Randall DD. Pea leaf mitochondrial pyruvate dehydrogenase complex is inactivated in vivo in a light-dependent manner. Proceedings of the National Academy of Sciences. 1990; 87(2):673–6. 91. Sato T, Maekawa S, Yasuda S, Yamaguchi J. Carbon and nitrogen metabolism regulated by the ubi-quitin-proteasome system. Plant signaling & behavior. 2011; 6(10):1465–8. Epub 2011/09/08. doi:10.
4161/psb.6.10.17343PMID:21897122; PubMed Central PMCID: PMCPmc3256372.
92. Peng M, Hudson D, Schofield A, Tsao R, Yang R, Gu H, et al. Adaptation of Arabidopsis to nitrogen limitation involves induction of anthocyanin synthesis which is controlled by the NLA gene. Journal of experimental botany. 2008; 59(11):2933–44. Epub 2008/06/17. doi:10.1093/jxb/ern148PMID:
18552353; PubMed Central PMCID: PMCPmc2504352.
93. Ma C, Zhou J, Chen G, Bian Y, Lv D, Li X, et al. iTRAQ-based quantitative proteome and phosphopro-tein characterization reveals the central metabolism changes involved in wheat grain development. BMC genomics. 2014; 15(1):1029.
94. Zhao X-Q, Shi W-M. Expression analysis of the glutamine synthetase and glutamate synthase gene families in young rice (Oryza sativa) seedlings. Plant science. 2006; 170(4):748–54.
95. Zhang Z, Zhao H, Tang J, Li Z, Li Z, Chen D, et al. A proteomic study on molecular mechanism of poor grain-filling of rice (Oryza sativa L.) inferior spikelets. PloS one. 2014; 9(2):e89140. Epub 2014/03/04. doi:10.1371/journal.pone.0089140PMID:24586550; PubMed Central PMCID: PMCPmc3931721.
96. Paris S, Wessel PM, Dumas R. Overproduction, purification, and characterization of recombinant aspartate semialdehyde dehydrogenase from Arabidopsis thaliana. Protein expression and purifica-tion. 2002; 24(1):99–104. Epub 2002/01/29. doi:10.1006/prep.2001.1538PMID:11812229. 97. Miron D, Ben-Yaacov S, Reches D, Schupper A, Galili G. Purification and characterization of
bifunc-tional lysine-ketoglutarate reductase/saccharopine dehydrogenase from developing soybean seeds. Plant physiology. 2000; 123(2):655–64. Epub 2000/06/20. PMID:10859195; PubMed Central
PMCID: PMCPmc59033.
and molecular biology. 2006; 48(1):85–97. Epub 2006/09/16. doi:10.1111/j.1365-313X.2006.02853.x
PMID:16972867.
99. McClung CR, Hsu M, Painter JE, Gagne JM, Karlsberg SD, Salome PA. Integrated temporal regula-tion of the photorespiratory pathway. Circadian regularegula-tion of two Arabidopsis genes encoding serine hydroxymethyltransferase. Plant physiology. 2000; 123(1):381–92. Epub 2000/05/12. PMID:
10806255; PubMed Central PMCID: PMCPmc59012.
100. Cahoon EB, Hall SE, Ripp KG, Ganzke TS, Hitz WD, Coughlan SJ. Metabolic redesign of vitamin E biosynthesis in plants for tocotrienol production and increased antioxidant content. Nature biotechnol-ogy. 2003; 21(9):1082–7. Epub 2003/08/05. doi:10.1038/nbt853PMID:12897790.
101. Li Y, Wang Z, Sun X, Tang K. Current opinions on the functions of tocopherol based on the genetic manipulation of tocopherol biosynthesis in plants. Journal of integrative plant biology. 2008; 50 (9):1057–69. Epub 2008/10/11. doi:10.1111/j.1744-7909.2008.00689.xPMID:18844774.
102. Munne-Bosch S. Linking tocopherols with cellular signaling in plants. The New phytologist. 2005; 166 (2):363–6. Epub 2005/04/12. doi:10.1111/j.1469-8137.2005.01411.xPMID:15819901.
103. Millar AA, Wrischer M, Kunst L. Accumulation of very-long-chain fatty acids in membrane glycerolipids is associated with dramatic alterations in plant morphology. The Plant cell. 1998; 10(11):1889–902.