Myc
Dynamically and Preferentially Relocates
to a Transcription Factory Occupied by
Igh
Cameron S. Osborne*, Lyubomira Chakalova, Jennifer A. Mitchell, Alice Horton, Andrew L. Wood, Daniel J. Bolland, Anne E. Corcoran, Peter Fraser
Laboratory of Chromatin and Gene Expression, The Babraham Institute, Cambridge, United Kingdom
Transcription in mammalian nuclei is highly compartmentalized in RNA polymerase II-enriched nuclear foci known as transcription factories. Genes in cis and trans can share the same factory, suggesting that genes migrate to preassembled transcription sites. We used fluorescent in situ hybridization to investigate the dynamics of gene association with transcription factories during immediate early (IE) gene induction in mouse B lymphocytes. Here, we show that induction involves rapid gene relocation to transcription factories. Importantly, we find that theMyc proto-oncogene on Chromosome 15 is preferentially recruited to the same transcription factory as the highly transcribedIgh gene located on Chromosome 12. Mycand Igh are the most frequent translocation partners in plasmacytoma and Burkitt lymphoma. Our results show that transcriptional activation of IE genes involves rapid relocation to preassembled transcription factories. Furthermore, the data imply a direct link between the nonrandom interchromosomal organization of transcribed genes at transcription factories and the incidence of specific chromosomal translocations.
Citation: Osborne CS, Chakalova L, Mitchell JA, Horton A, Wood AL, et al (2007)Mycdynamically and preferentially relocates to a transcription factory occupied byIgh. PLoS Biol 5(8): e192. doi:10.1371/journal.pbio.0050192
Introduction
Interphase chromosomes are organized in tissue-specific arrangements in nuclei, suggesting that chromosomal posi-tion and juxtaposiposi-tion play a role in gene expression [1–5]. Nonrandom chromosome positioning has also been impli-cated in the frequency of specific chromosomal transloca-tions. For example, Chromosomes 12 and 15, which contain the frequent B cell translocation partnersimmunoglobulin heavy chain (Igh) and the proto-oncogene Myc, are preferred neighbors in mouse splenic lymphocytes [3]. Similarly, in human lymphoid cellsMYC andIGHare found in the same vicinity in about one-third of nuclei [6]. Any process that brings these genes together would obviously be expected to increase the risk of a translocation between them; however, almost nothing is known about the forces that organize chromosomes in the nucleus.
Nascent transcription occurs at RNA polymerase II (RNAPII)-rich nuclear foci known as transcription factories [7–11]. These sites are highly enriched in the hyperphos-phoryated forms of RNAPII involved in transcription initiation and elongation [7,11]. Previous findings suggest that active mammalian genes are transcribed in bursts of activity punctuated by long periods of relative inactivity [9,12–14]. This concept is supported by recent live-cell studies showing that gene expression [15,16], and in particular gene transcription [17], occur in discrete pulses. We and others [9,10] have observed a virtually absolute correspondence between transcriptional activity at individual gene alleles and their positioning within transcription factories, whereas identical inactive alleles, often in the same cell, are clearly positioned away from factories. Collectively, these data could be interpreted to imply that the engagement of genes at factories is dynamic; however, they could equally be con-strued to indicate that a transcription factory nucleates around an individual gene during a transcriptional burst.
Arguing against the latter interpretation is the finding that multiple genes incisandtranscan frequently share the same factory, which strongly suggests that genes migrate to preassembled transcription sites for transcription [9].
In this study, we investigated the positioning of immediate early (IE) genes relative to transcription factories and other B cell expressed genes during IE induction. We found that before activation the majority of IE alleles are not associated with transcription factories, whereas upon induction, IE genes rapidly relocate to preformed transcription factories. Remarkably, we observed preferential recruitment of the proto-oncogeneMycto the same transcription factory that is occupied by its frequent translocation partner, Igh. Our results suggest that this frequent and preferential juxtaposi-tion may provide the opportunity for a chromosomal translocation, and may in part dictate the incidence with which specific chromosomal translocations occur.
Results
Transcriptional Frequencies of IE Gene Alleles Vary during Induction
Resting B cells can be stimulated through the B cell receptor signaling pathway to rapidly increase transcription and
Academic Editor:Susan M Gasser, Friedrich Miescher Institute for Biomedical Research, Switzerland
ReceivedNovember 17, 2006;AcceptedMay 16, 2007;PublishedJuly 10, 2007 Copyright:Ó2007 Osborne et al. This is an open-access article distributed under the terms of the Creative Commons Attribution License, which permits unrestricted use, distribution, and reproduction in any medium, provided the original author and source are credited.
Abbreviations:3C, capturing chromosome conformation; FISH, fluorescent in situ hybridization; IE, immediate early; RNAPII, RNA polymerase II; RT-PCR, reverse transcription PCR
mRNA expression of the IE genesFosandMyc[18]. We used RNA fluorescent in situ hybridization (FISH) with gene-specific intron probes to investigate the transcriptional activity of several genes during IE gene induction in mouse B lymphocytes (Figure 1). We found that transcription frequencies vary for several genes in B cells, similar to our previous observations in erythroid cells [9]. Transcription signals for the B cell-specific gene Igh are present at approximately 90% of alleles both before and after induction (Figure 1A). In the vast majority of cells both alleles are actively transcribed (.80% of cells), whereas a smaller percentage of cells have only single signals, consistent with our previous findings [19]. The immunoglobulin light chain genesIgk and Igl also have transcription signals at approx-imately 90% of alleles, with approxapprox-imately 80% of cells having two transcription signals (Figure 1B and 1C). These data show constitutive transcriptional activity at nearly all alleles that is unchanged upon IE induction. In contrast, transcription of the IE proto-oncogenesFosand Mycis significantly lower in unstimulated cells, with 20% and 26% of alleles, respectively, displaying transcription signals (Figure 1D and 1E). Most cells (;60%) have two silent alleles, some cells have one active allele (;30%), and a minority of cells have two active alleles (,10%). Upon induction, the percentage of loci with tran-scription signals forFos andMycrises dramatically within 5 min to 53% and 75%, respectively. This rise is the result of a dramatic increase in the percentage of cells with two active alleles and, to a lesser extent, an increase in cells with one active allele. The fold increases in the percentage of active alleles are in precise agreement with run-on transcription studies in mouse B cells that demonstrated a 2- to 3-fold induction ofFosandMyctranscription in stimulated cells [18]. These results suggested the possibility that increased IE expression could be accounted for by transcriptional recruit-ment of additional IE alleles rather than an increase in the
‘‘basal’’rate of transcription at all IE alleles.
IE Gene Induction Results from Activation of Previously Inactive Alleles
We questioned whether the increase in nascent tran-scription levels seen in run-ons could be accounted for solely
by the transcriptional recruitment of additional IE alleles. We used a sensitive reverse transcription PCR (RT-PCR) techni-que capable of quantitating the average absolute number of primary transcripts per cell [20]. In this method serial dilutions of a known amount of a spiked competitor RNA that contains a small internal deletion is compared to the amount of endogenous primary transcript in total RNA preps from a known number of cells. We adapted this method by using PCR primers that flank a 59splice donor site. Cleavage of the primary transcript at the 59 donor site occurs soon after the RNA polymerase has passed the 39 splice acceptor site, at the end of the intron sequence [21]. Quantitative detection of RT-PCR products from this part of the primary transcript provides an extremely sensitive measure of the number of transcripts being synthesized over that intron. An estimate of the average number of primary transcripts per gene can be calculated by extrapolating to the full size of the transcription unit.
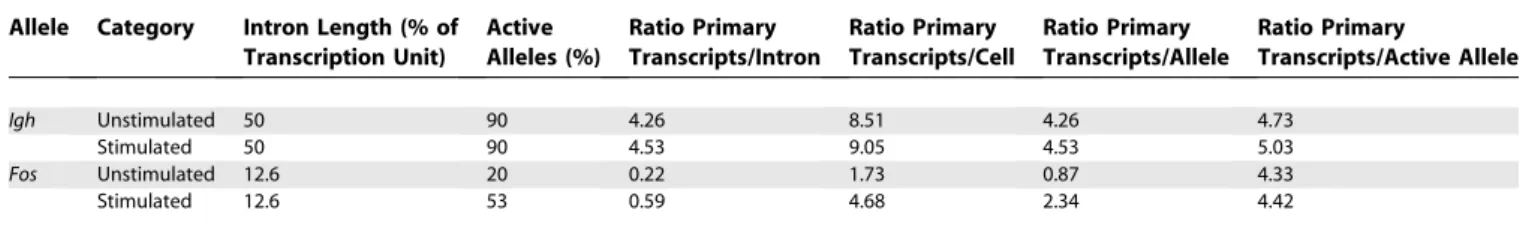
We found that the average number of Igh primary tran-scripts does not change during B cell induction (Figure 1F; Table 1), consistent with our FISH data, which indicate that Igh transcription is unaffected by stimulation. We detected approximately 4.3 and 4.5 unspliced primary transcripts on theIghintron per cell in unstimulated and stimulated cells, respectively. As this intron is approximately half the Igh transcription unit length, we calculated that there are an average of 8.5 and 9.0 primary transcripts being produced from the twoIghtranscription units per cell (4.3 and 4.5 per Ighallele). Since RNA FISH shows that 90% ofIghalleles are transcriptionally active, we estimate that there are approx-imately five transcripts being produced on each active allele. The picture for the IE Fos gene is very different. In unstimulated cells we found that the extrapolated, average absolute number of Fos primary transcripts per cell is 1.73 copies. This is less than one primaryFostranscript per allele, indicating that not allFos alleles are transcriptionally active in unstimulated cells. If we calculate the average number of Fostranscripts per active allele based on our RNA FISH data in which 20% ofFosalleles showed a transcription signal, we arrive at an average number of 4.3Fosprimary transcripts per active allele. In stimulated cellsFosprimary transcript intron copies per cell increase approximately 2.7-fold, consistent with the 2.65-fold increase in the percentage of actively transcribedFosalleles determined by RNA FISH. Comparison of the number of Fos primary transcripts per active allele indicates that the number ofFos transcripts per active allele does not change upon induction (4.3 versus 4.4 copies). These data show that our RNA FISH technique is very sensitive and is capable of measuring very small numbers of primary transcripts at a transcription site. In addition, these results show that when we do not see an RNA FISH signal over a particular allele, it is truly ‘‘off’’ and has no primary transcripts associated with it. Collectively, these results show that Fos IE gene induction occurs via transcriptional activation of additional, previously inactive alleles, rather than by simply increasing the‘‘basal’’rate of transcription of all alleles.
IE Genes Rapidly Associate with Transcription Factories upon Induction
Our previous studies in erythroid cells suggested that gene association with transcription factories is dynamic, with genes
Author Summary
moving to preformed factories in order to transcribe [9]. Inducible gene expression in B cells permitted us to examine the dynamics of transcription in relation to transcription factories. We speculated that the activation of previously quiescent IE alleles upon B cell induction may involve repositioning of alleles to transcription factories. However, theMycgene has a well-characterized attenuation site that is thought to block passage of RNAP II, resulting in a stalled polymerase [22]. This observation leaves open the possibility that silent Myc alleles may be pre-positioned in factories awaiting removal of a transcriptional block.
We first examined the positions of actively transcribed genes relative to transcription factories, using RNA immuno-FISH (Figure 2). We found that 92% ofMycRNA FISH signals are associated with strong RNAP II foci (Figure 2A). Similarly, 90% of transcriptionally activeIghalleles are associated with
strongly staining RNAP II foci (Figure 2B), consistent with previous observations of erythroid-expressed genes [9,10]. Others have shown that the remaining 10% of RNA FISH signals localize to weakly staining RNAPII foci [10], indicating that essentially all transcriptionally active alleles associate with transcription factories. This observation agrees with previous studies that showed a good correspondence between pulse-labeled nascent RNA and RNAPII foci [7,11]. We conclude that all Myc and Igh transcription occurs at transcription factories.
Next, we investigated the position of nontranscribing alleles by DNA immuno-FISH, which detects DNA of both active and inactive alleles and RNAP II proteins. We found that approximately 30% ofMycDNA FISH signals overlapped with RNAP II foci in unstimulated cells, while 70% were not associated with RNAP II foci. These results are consistent with
Figure 1.RNA FISH and Transcription Analysis in Unstimulated and Stimulated B Cells
RNA FISH in splenic B cells forIgh(red) (A),Igk(red) (B),Igl(green) (C),Fos(green) (D), andMyc(green) (E) gene transcription. DAPI staining is blue. Scale bar, 2lm. We have shown nuclei in which both signals are in the same optical plane. The graphs show the percentage of cells with zero (white), one (grey), or two (black) transcription signals by RNA FISH in B cells, unstimulated and stimulated for the times indicated (in minutes). Results shown are from a single experiment, which was repeated three times, with similar results in every case. One hundred nuclei were assessed for each time point. The percentage of transcribing alleles was significantly different between unstimulated and stimulated cells for bothFos(0 min versus 5 min,p¼4.031012;
versus 10 min,p¼1.33107; and versus 15 min,p¼6.33107) andMyc(0 min versus 5 min, 3.931023; versus 10 min, 1.131022; and versus 15 min,
1.131022).
the percentage of transcriptionally active alleles detected by RNA FISH (Figure 3A and 3C), and show that the inactiveMyc alleles are not associated with transcription factories, but are instead positioned away from these sites. Three-dimensional DNA FISH measurements between the inactive Myc alleles and the nearest transcription factory show that on average silentMycalleles are 500 nm from the nearest factory (Figure 3D).
After 5 min of stimulation the percentage of Myc loci associated with transcription factories increased to 65%, in agreement with the increased percentage of actively tran-scribingMycalleles determined by RNA FISH (Figure 3B and 3C). These results show that Myc induction involves an increase in the percentage of Myc alleles associated with transcription factories. The increase of gene association with factories could be achieved in two ways.Myctranscriptional induction could involve the nucleation of transcription factories on newly activatedMyc alleles. Alternatively, tran-scriptional induction could involve the rapid relocation of silentMycalleles to preassembled transcription factories.
IE Genes Relocate to Preexisting Transcription Factories The synchronous induction of IE gene alleles described above allowed us to directly test these alternate scenarios. TheIghlocus on mouse Chromosome 12 is positioned 28 Mb telomeric to theFos locus. Approximately 90% ofIghalleles exhibit RNA FISH signals in B cells (Figure 1A) [19], and are
associated with transcription factories, indicating that theIgh locus undergoes nearly constant transcription, similar to the highly expressed Hbb locus in erythroid cells [9,23]. We therefore used Igh RNA FISH signals as factory reference points and scored the percentage ofIghtranscription signals that have a colocalizing (overlapping)Fos signal, before and after induction using double-label RNA FISH. In unstimu-lated cells approximately 7% ofIghsignals had a colocalizing Fossignal (Figure 4A and 4C). After induction, colocalization nearly tripled, with 20% ofIgh signals having a colocalizing Fossignal. These results suggest that a significant proportion of the newly activated Fos alleles move to a factory that is already occupied by an Ighallele rather than forming their own factory.
Frequent Translocation Partner Genes Often Share the Same Transcription Factory
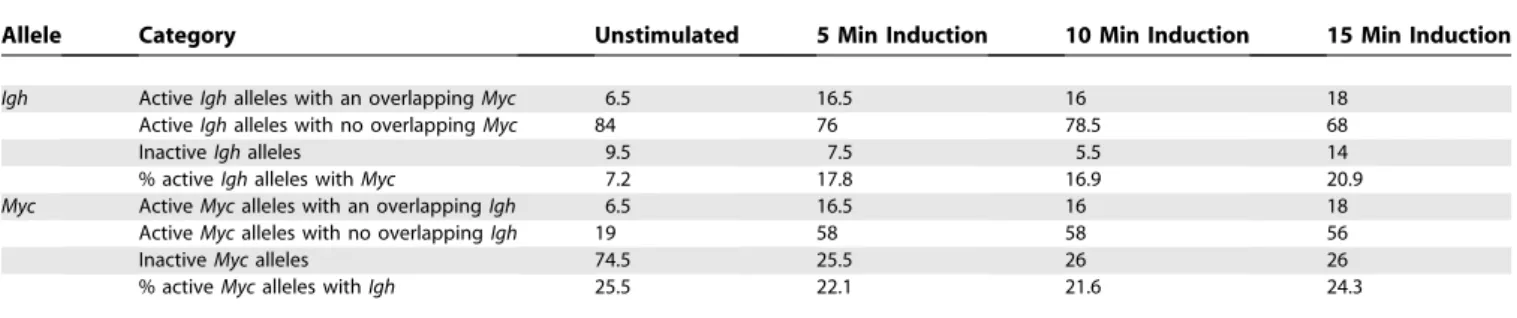
We previously showed a low but significant level of interchromosomal associations between the highly tran-scribed Hbb and Hba genes in erythroid cells [9]. We hypothesized that the preferred neighbor arrangement of Chromosomes 12 and 15 in B cells [3] might allowMycandIgh to co-associate with the same transcription factory intrans. Using double-label RNA FISH as above, we found that approximately 6% of Igh signals have a colocalizing Myc signal in unstimulated cells (Table 2). Comparing the percentage of activeMycalleles that colocalized with an Igh signal to those that did not, we found that a remarkable 25% of the transcribing Myc alleles colocalized with Igh in trans prior to induction. Upon induction, as we observed a 2.9-fold increase in the percentage of transcribing Myc alleles, we found a 2.5-fold increase in the percentage ofIghalleles with a colocalizingMycsignal (Figure 4B and 4C; Table 2). Again, by comparing colocalizing versus noncolocalizingMycsignals we found that approximately one-fourth of the active Myc alleles (22–24%; Table 2) were associated withIghalleles upon induction. Thus, one-fourth of the newly activatedMycalleles, which were previously located away from transcription factories, had moved to a factory occupied by Igh. We confirmed that colocalizingMycandIghtranscription signals co-associated with a shared transcription factory using triple-label RNA immuno-FISH to detect transcriptionally active MycandIghalleles and RNAP II foci (Figure 4D). We found that all colocalizingMycandIghsignals overlapped with the same transcription factory.
In order to put this extraordinarily high frequency of interchromosomalMyc-Ighcolocalization into perspective we compared the colocalization frequencies betweenIghand five Table 1.Quantitation of Primary Transcripts onIghandFosAlleles
Allele Category Intron Length (% of Transcription Unit)
Active Alleles (%)
Ratio Primary Transcripts/Intron
Ratio Primary Transcripts/Cell
Ratio Primary Transcripts/Allele
Ratio Primary
Transcripts/Active Allele
Igh Unstimulated 50 90 4.26 8.51 4.26 4.73
Stimulated 50 90 4.53 9.05 4.53 5.03
Fos Unstimulated 12.6 20 0.22 1.73 0.87 4.33
Stimulated 12.6 53 0.59 4.68 2.34 4.42
doi:10.1371/journal.pbio.0050192.t001
Figure 2.Transcription ofMycandIghOccurs at Transcription Factories in B Cells
RNA immuno-FISH (RNA FISH combined with immunodetection of RNAP II) shows the positions of transcribingMyc(A) andIgh(B) alleles (red) relative to transcription factories (green). Shown are deconvoluted, single optical sections of stimulated B cells. We have presented cells in which both transcribing alleles are in the same focal plane. TheMycand
IghRNA FISH signals show 92% (n¼52) and 90% (n¼89) co-association
other B cell-expressed genes. One gene, Eif3s6, is located approximately 20 Mb fromMycon Chromosome 15, and four other genes,Igk,Igl,Uros,andActb,are on Chromosomes 6, 16, 7, and 5, respectively. Since Chromosomes 12 and 15 are preferred neighbors in B cells [3], we considered the analysis of colocalization betweenEif3s6and Igh to be of particular
interest. If the high level of interchromosomal colocalization between Myc and Igh were simply due to the fact that the genes are on neighboring chromosomes, then we might expectEif3s6andIghto colocalize at similar frequencies when transcribed. We found thatEif3s6 and Ighcolocalize, but at significantly lower levels than Myc-Igh. Only 11% of Eif3s6 signals colocalized withIgh,compared to approximately 25% forMyc.For the other genes we found that 9% ofUros,8% of Igk,6% ofIgl,and 2% ofActbtranscribing alleles colocalized withIgh(Figure 5). These considerably lower frequencies of co-association with Igh clearly demonstrate that trans co-association frequencies between different gene pairs can vary greatly. For example Igh-Myc trans colocalization is over 10-fold higher thanIgh-Actb,indicating that theMycandIgh trans colocalization frequency is statistically highly significant. However, the Myc-Ighco-association is also highly preferen-tial, as indicated in the comparison betweenMycandEif3s6. Myc co-associates with Igh at a greater than 2-fold higher frequency thanEif3s6. This result demonstrates that not all genes on neighboring chromosomes co-associate at equal frequencies and shows that Myc and Igh preferentially co-associate intrans.
MycAlleles Move towardIghupon Induction in B Cells Our results suggest that 5 min after induction, many previously inactive Myc alleles are moving to preformed factories that contain transcriptionally active Igh alleles. If this interpretation is correct we would expect to see a net movement ofMycalleles towardIghalleles upon stimulation of IE gene expression. To directly test this hypothesis we carried out 3D DNA FISH, measuring the separation distances between Myc and Igh alleles in unstimulated and stimulated cells. We found a statistically significant shift in the distribution of measurements upon B cell stimulation, changing from a mean separation distance of 2.16lm to 1.83 lm (p ¼ 0.005) (Figure 6A). This shows that across the
population of cellsMycandIghalleles are significantly closer together 5 min after induction. In contrast, we found no significant change in the distributions of measurements between Igh and two other genes in trans, Actb and Uros (Figure 6B and 6C). These results show there is no net movement between Actb-Igh and Uros-Igh upon B cell activation, indicating that these genes are not significantly changing their location relative to one another. However, there is net movement of Myc alleles toward Igh upon induction. We did not detect any net movement between IghandFos upon induction (Figure 6D), most likely because the range of separation between these physically linked genes is too small to detect subtle changes in relative positioning via light microscopy [9]. We conclude that increased Myc expression during IE gene induction involves the rapid relocation of Myc alleles to preassembled transcription factories, with many alleles migrating to a factory containing theIghgene.
We also assessed separation distances betweenMycandIgh alleles in two other tissue types, adult kidney and fetal liver erythroid cells. We detected much greater separation distances betweenMycandIghin these tissues compared to unstimulated B cells (Figure 6E).MycandIghwere separated by an average of 2.78 and 3.20 lm in kidney and erythroid cells respectively, compared to an average of 2.16 lm in unstimulated B cells. These results are consistent with
Figure 3.Relocation ofMycAlleles to RNAP II Foci upon B Cell Activation (A and B) DNA immuno-FISH ofMyclocus (red) with RNAP II staining (green) in unstimulated (A) and stimulated (B) splenic B cells. Deconvoluted, single optical sections of the nuclei are shown. Scale bar, 2lm.
(C) Comparison of the percentage ofMycloci that overlap with an RNAP II focus by DNA immuno-FISH (black,n¼81 andn¼88 for unstimulated
and stimulated, respectively), and the percentage of transcriptionally activeMycalleles by RNA FISH (gray) in unstimulated (09) and 5 min– stimulated (59) B cells. Comparison of DNA immuno-FISH results in unstimulated versus stimulated cells,p¼6.63106. Comparison of RNA FISH results in unstimulated versus stimulated cells,p¼3.931023.
Comparisons between DNA immuno-FISH and RNA FISH results in unstimulated and stimulated cells yielded p-values of 0.55 and 0.12, respectively.
previously reported observations of tissue-specific position-ing of genes [6,24] and chromosomes [3,25] and show thatMyc andIghare already in the same ‘‘nuclear neighborhood’’in unstimulated B cells, which most likely facilitates their increased proximity and colocalization upon stimulation.
To corroborate the FISH results, we used the capturing chromosome conformation (3C) assay [9,26,27], which meas-ures ligation frequency between in vivo formaldehyde cross-linked chromatin fragments. Ligation products were detected with four different primer pairs within theIghandMycloci in stimulated B cells (Figure S1). The primer pair that produced the most robust product (primer paird/g) was used to detect ligation products in unstimulated and stimulated B cells. Over multiple experiments, ligation products were always detected in stimulated B cells, while in unstimulated cells the products were usually, but not always detected. In contrast, Igh/Myc ligation products were never detected in brain or
kidney cells, indicating that juxtaposition ofMyc and Ighis restricted to tissues in which both genes are expressed.
Co-Association Frequencies of Translocation Partner Genes Are in Line with Their Relative Occurrences in Cancers
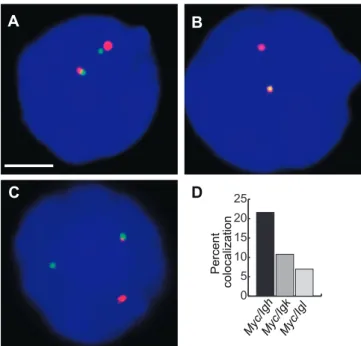
Importantly, Myc and Igh are the two most common translocation partners in Burkitt lymphoma and mouse plasmacytoma. Of these cancers 80% harbor Myc-Igh trans-locations, while the remaining cases containMyc-Igk(15%) or Myc-Igl(5%) translocations [28,29]. To establish whether there is a relationship between the frequency of these trans-locations in plasmacytomas and the co-association frequen-cies of transcriptionally active alleles in normal B cells, we measured the extent to which the transcriptionally activeMyc colocalized withIgkandIglalleles in 10-min stimulated cells by RNA FISH. We found that 11% of transcribingMycalleles
Figure 4.Colocalization of IE Gene Transcription Signals withIgh
(A and B) Double-label RNA FISH in stimulated splenic B cells forIgh(red) andFos(green) (A) orIgh(red) andMyc(green) (B). Scale bar, 2lm. (C) The percentages ofIghsignals with visibly overlapping (colocalizing)FosorMycsignals, before and after B cell stimulation for the times indicated in minutes. One hundred nuclei were assessed for signals in each case. There are significantly more colocalizing signals in stimulated cells compared to unstimulated forFos(0 min versus 5 min,p¼1.23104; versus 10 min,p¼3.33104; and versus 15 min, 1.43103) andMyc(0 min versus 5 min,p¼
2.53103; versus 10 min, 4.23103; and versus 15 min,p
¼1.93104).
(D) A single optical section of a triple-label, RNA immuno-FISH on stimulated B cells showingIgh(red) andMyc(green) transcription, and RNAPII foci (blue). Images on right are enlargements of colocalized transcription signals associating with the same RNAPII focus. Scale bar, 2lm.
colocalized withIgkand 7% colocalized withIgl,compared to 22% with Igh (Figure 7). Thus the frequencies of co-association between Myc and the immunoglobulin loci in transcription factories are in line with the appearance of their respective translocation frequencies in mouse plasma-cytomas.
Discussion
Our results show that IE gene induction involves the rapid nuclear relocation of previously inactive genes to preas-sembled transcription factories. This dynamic transcriptional organization is nonrandom and leads to the preferential juxtaposition of the Myc and Igh genes at transcription factories. Transcriptional colocalization may provide an opportunity and therefore an increased risk of illegitimate recombination resulting in a chromosomal translocation [30,31]. We cannot discount the possibility that differences in oncogenic potential result in selective outgrowth of one type of translocation versus another. However, it is striking that the co-association frequencies echo the appearance of specific translocations in plasmacytomas, suggesting that the juxtaposition frequency of specific genes in a transcription factory has a direct effect on their translocation frequency.
Upon B cell induction, signaling pathways converge upon the IE genes, a process that causes their relocation to transcription factories. Others have shown recently that
upon activation, genes can undergo directed, actin and myosin-dependent relocalization, moving between 1 and 5 lm [32]. We cannot discount the possibility that similar forces may be involved in the relocation of genes to factories. However, we found that inactiveMycalleles are positioned on average 500 nm from the nearest factory, a distance that could conceivably be covered by random chromatin move-ments [33–35].
A key question concerns the basis of the preferred co-associations of specific genes in a common factory. The relative positions of genes in cis or on preferred neighbor chromosomes would be expected to affect the frequency of co-association in a factory [9] as it does recombination frequency [36]. On the other hand, it is possible that tissue-specific chromosomal positioning is driven by the net effect of thousands of preferential interchromosomal interactions between active (and inactive [37]) genes that serve as dynamic anchor points that facilitate chromosome positioning [38]. Preferential co-associations in factories may be the result of 3D spatial clustering of genes with related functions or genes coordinately regulated by common factors [9,37,39]. Genome-wide examination of the subsets of genes that preferentially co-associate may provide valuable information about these influences.
Ightranslocations are presumed to occur through aberrant repair during programmed recombination, by recombinase activating gene protein (RAG) during V(D)J recombination,
Figure 5.Trans Colocalization of Transcriptionally Active Genes
Double-label RNA FISH in unstimulated B cells to detectIgh(red) and (A)Eif3s6(green), (B)Uros(green), (C)Igk(green), (D)Igl(green), and (E) andActb
(green). DAPI staining is blue. Scale bar, 2lm.
(F) The percentage ofMyc, Eif3s6, Uros, Igk, Igl,andActbsignals that overlap with anIghsignal. One hundred nuclei were assessed for each case except
Uros,for which 70 nuclei were examined.Myc-IghversusEif3s6-Igh, p¼0.02; versusUros-Igh, p¼0.01; versusIgk-Igh, p¼5.93104; versusIgl-Igh, p¼5.2
3105; and versusActb-Igh, p
¼1.03106.
doi:10.1371/journal.pbio.0050192.g005
Table 2.Percentage of Transcribing and ColocalizingIghandMycAlleles
Allele Category Unstimulated 5 Min Induction 10 Min Induction 15 Min Induction
Igh ActiveIghalleles with an overlappingMyc 6.5 16.5 16 18
ActiveIghalleles with no overlappingMyc 84 76 78.5 68
InactiveIghalleles 9.5 7.5 5.5 14
% activeIghalleles withMyc 7.2 17.8 16.9 20.9
Myc ActiveMycalleles with an overlappingIgh 6.5 16.5 16 18
ActiveMycalleles with no overlappingIgh 19 58 58 56
InactiveMycalleles 74.5 25.5 26 26
% activeMycalleles withIgh 25.5 22.1 21.6 24.3
and activation-induced deaminase (AID) during somatic hypermutation and class switching [40]. Cleavage by RAG complexes at cryptic RAG recognition sites at other genes, and altered DNA structures have been implicated in the generation of some human IGH translocations [41,42]. However, the current consensus view is that cryptic RAG sites are not present in the majorMycbreakpoint region.Igh translocations within the Igh diversity and joining regions occur in the bone marrow pre-B cells, which undergo V(D)J recombination [40]. However, mostIghtranslocations toMyc are found in theIghclass switch region and are believed to occur in germinal center B cells, the site of class switching
[40]. There is strong evidence to suggest that genes may be susceptible to double-stranded breaks during transcription. The process of transcription creates considerable torsional stress [43], which can be relaxed by topoisomerases via introduction of transient double-stranded breaks. In fact, topoisomerase type IIb-generated double-stranded breaks in the promoter regions of some genes have recently been shown to be required for regulated transcription [44]. Topoisomerase cleavage sites are common features of trans-location hot spots [45]. Significantly, topoisomerase type IIb binding sites have been mapped to the major breakpoint region of the human MYC gene, at the 59 end of the first intron [46]. Further evidence of a link between transcrip-tional organization and recombination is suggested by two papers, one of which showed that actively transcribed yeast tRNA genes cluster in the nucleolus [47], and another which showed that recombination is higher between actively tran-scribed tRNA genes compared to inactive tRNA genes [48]. Interestingly, double-stranded break repair enzymes Ku70/80 are also associated with transcription factories [49]. In summary, the introduction and repair of double-stranded breaks may be commonplace in transcription factories. Therefore, interchromosomal co-associations between genes in factories may be expected to result in a heightened risk of aberrant repair of double-stranded breaks resulting in chromosomal translocations.
It is curious that evolution has allowed the interchromo-somal juxtaposition of theMycand Ighloci in transcription factories to persist, considering the potentially grave risks of such an organization. However, the apparent dangers of illegitimate recombinations may be outweighed by
advan-Figure 7.Co-Association Frequencies of TranscribingMycAlleles with Immunoglobulin Genes
(A–C) Double-label RNA FISH in stimulated B cells (10 min), showingMyc
transcription signals in green, and in red,Igh(A),Igk(B), andIgl(C). DAPI staining is blue. Scale bar, 2lm.
(D) The percentage ofMycsignals that overlap withIgh, Igk,orIglsignals. One hundred nuclei were examined in each case.Myc-IghversusMyc-Igk, p¼0.02; versusMyc-Igl, p¼0.0003.
doi:10.1371/journal.pbio.0050192.g007
Figure 6.3D DNA FISH Measurements of Separation Distances (A–D) 3D DNA FISH separation distances between the Igh and the indicated alleles in unstimulated (black) and 5 min–stimulated (red) B cells. Values were grouped into 0.8lm bins. Graphs show results for Myc-Igh(A),Uros-Igh(B),Actb-Igh(C), andFos-Igh(D). At least 83 gene pairs were measured.p-Values show thatMycalleles are significantly shifted towardIghupon stimulation.
tages of clustering transcribing genes, which may make efficient use of shared resources, or perhaps provide a degree of transcriptional coordination of subsets of genes.
Materials and Methods
B cell collection and stimulation. CD43 resting B cells were
isolated from spleens of 6- to 8-wk-old BALB/c mice by magnetic cell sorting using CD43 microbeads (Miltenyi Biotec, http://www. miltenyibiotec.com) to deplete other cell types. Induction of B cells was done in PBS supplemented with 10 ng/ml recombinant mouse IL-4 (Stemcell Technologies, http://www.stemcell.com), 20lg/ml purified rat anti-mouse monoclonal antibodies to CD40 (clone HM40–3, Serotec, http://www.serotec.com) and 10lg/ml goat anti-mouse IgMl
chain, F(ab9)2 fragment (Jackson Immunoresearch, http://www. jacksonimmuno.com) at room temperature for up to 15 min before fixation for FISH.
RNA, DNA, and immuno-FISH. RNA FISH was carried out as described previously [50,51]. We visualizedIghtranscription with a dinitrophenol-labeled single-stranded DNA probe to the intronic enhancer region [19], followed by Texas Red detection. We prepared digoxygenin or biotin-labeled single-stranded DNA probes to detect
Fos, Myc, Eif3s6, Uros, Actb, Igk,andIgl,intron sequences as described
[19]. Primer sequences used to PCR-subclone the various probes are listed below. DNA FISH was carried out as previously described [52]. The following BAC clones (BACPAC Resources, http://bacpac.chori. org) were used: 234 kb RP23-98D8 forMyc;178 kb RP24-233K8 for
Fos;166 kb RPCI24-258E20 forIgh;151 kb RP24-132K17 forUros;and 213 kb RP23-97O1 forActb. For double-label experiments, we labeled one of the DNA FISH probes directly with AlexaFluor 594 and labeled the other probe with digoxigenin, detected with fluorescein-conjugated antibodies. Immunofluorescence and immuno-FISH was carried out as described [9,52], using a CTD4H8 antibody (Upstate Biotechnology, http://www.upstate.com) that was raised against a Ser5-phosphorylated CTD. This antibody is specific to phosphory-lated forms of RNAP II [53].
Primers used to amplify RNA FISH probes were the following.
Fosintron 1 sense, 59-GCTTTGTGTAGCCGCCAGGT-39; antisense 59 -AGAGGAAAGCGGAGGTGAGC-39. Fosintron 2 sense, 59 -AAGTA-GAGCTGGTGAGCAGCGATT-39; antisense, 59 -AGAAAAGGACCAA-CATTCAGTTAAGG-39. Myc intron 1 sense, 59 -AGCACAGATCTG-GTGGTCTTTC-39; antisense, 59 -CTCCTTCGAGCAGGGACTT-AG-39. Myc intron 2 sense, 59 -CTTCTCCACCACTCATTGGCAT-TA-39; antisense, 59-GGGAGGAAGTGGAAGATCACAGTT-39.Eif3s6
intron 1 sense, 59-GTGAGGAAGCTTTGAGAAGGAGGA-39; anti-sense, 59-ATTAATTTTGCTGTTCCCTGCTGA-39. Uros intron 6 sense, 59-TCAGCGCCACAGCAAGGGTT-39; antisense, 59 -GCCTTCCCTCCTTTGTTCCCAGT-39. Actb intron 1 sense, 59 -TCGCTCTCTCGTGGCTAGTA-39; antisense, 59 -TGGCGAACTAT-CAAGACACA-39. IghIlintron sense, 59 -AGCTGTGGCTGCTGCTC-TTA-39; antisense, 59-AGCCTCGCTTACTAGGGCTCTC-39. Igl J-C intron probe 1 sense, 59-TGAGTGACTCCTTCCTCCTTTG-39; anti-sense, 59-TGGAGGCAGTGTGTAAAGTGTC-39. IglJ-C intron probe 2 sense, 59-GTTGTCTTGCAAGGGTCTTTTT-39; antisense, 59 -GTGCGAATAAAAGAAGGGATTG-39. IgkJ-C intron sense, 59 -AAGA-CACAGGTTTTCATGTTAGGA-39; antisense, 59 -AATAGAATTAT-GAGCAGCCTTTCC-39.
Microscopy and image analysis.We examined RNA FISH signals on an Olympus BX41 epifluorescence microscope, and assessed 200 loci for each probe combination, except forUros-Igh,for which 140 alleles were assessed. Transcription signals scored as colocalizing if the red and green signals overlapped to create a visible yellow signal. To assess the association ofMycDNA FISH signals and RNAP II foci, we captured image stacks of nuclei, using an Olympus BX41 epifluor-escence microscope, equipped with a UPlanApo 1003oil objective to reduce chromatic aberration, and fitted with a motorized stage. Images were captured and analyzed using Analysis 3.2 image capture software, fitted with a RIDE module (SIS, http://www.sis.com). The stacks were deconvoluted using a nearest-neighbor algorithm with 85% haze removal, and analyzed. We analyzed 81 and 88 alleles in unstimulated and stimulated B cells, respectively. Statistical analysis was carried out using a two-sided Fisher exact test. ForMycalleles that were not co-associated with an RNAPII focus, we measured the separation distance from the edge of the gene signal to the edge of the nearest RNAP II immunofluorescence signal, and analyzed 27 alleles.
To measure the distances betweenIghand genes intransby DNA FISH, we collected image stacks using a Zeiss 510 Meta confocal
microscope. Separation distances for eachIghallele and the nearest
Myc, Fos, Uros, or Actb allele were measured on 3D-reconstructed
image stacks using Volocity image analysis software (http://www. improvision.com/products/volocity). In all cases, we made measure-ments from center to center of the two gene signals. We analyzed at least 83 measurements for gene pairs in unstimulated and stimulated B cells, adult kidney cells, and E14.5 fetal liver cells. Changes in the distributions of measurements were assessed by two-sided Studentt -test.
Competitive RT-PCR. The assay was carried out essentially as described [20]. RNA competitor fragments were generated by cloning 230 bp Igh and 236 bp Fos fragments that span 59 exon-intron junctions. The plasmid containing theIghfragment was digested with HindIII and AflII to release a 17 bp fragment, then religated. TheFos
deletion was generated by BsmFI and NheI digestion to remove a 24 bp fragment. RNA was transcribed from linearized plasmids, then checked by gel electrophoresis and quantitated by UV spectrometry. Dilutions of controlled amounts of RNA was spiked into Trizol reagent that contained a known number of cells. RNA was extracted, reverse transcribed, and PCR amplified with nested primers.
To measure the numbers of primary transcripts over the length of the intron, the relative intensity of the endogenous RT-PCR product was compared to the spiked competitor RT-PCR product, measured using AIDA quantitation software. ForIgh,the lanes with four copies of spiked competitor per cell was used for quantitation. For Fos,
quantitation was obtained from the average from the lanes with 1 copy per cell and 0.5 copy per cell.
The primers used were as follows. Igh-f, 59 -CCTGGGAATG-TATGGTT GTGG CTTC-39; I g h-r, 59 -CCCCCTAAAGCAAT-:GACTGAAGACTCA-39;Ighnested-f, 59 -CCTCGGTGGCTTTGAAG-GAACAAT-39;Igh nested-r, 59 -CCCTAAAGCAATGACTGAAGACT-CAGT-39; Fos-f, 59-AGCATCGGCAGAAGGGGCAAAGTA-39;
Fos-r, 59-TGAAGTAGGAAGCTGTCAGGGAAACTG-39;Fosnested-f, 59-AGAAGGGGCAAAGTAGAGCAGGTGA-39; Fos nested-r, 59 -TGTCAAAATCTGACAAGGGAGGGAAAG-39.
3C assay. We carried out the 3C assay as described previous-ly [9]. We fixed B cells that had been stimulated for 5 min in 2% formaldehyde for 10 min at room temperature, and digested 13
106 nuclei overnight with 600 units of BglII. We ligated digested chromatin (2lg) with 2,000 units of T4 DNA ligase in a final vol-ume of 800ll. We cloned ligation product detected by primer paird/g
(see list below)and verified it by DNA sequencing. We tested the specificity of the 3C primers as previously described [9]. The primers used for 3C analysis were the following.Myc aforward, 59 -TCTACACCCCATACACCTCCA-39; Myc a nested, 59 -CGAGAA-TATGCCATGAATTGG-39. Myc b forward, 59 -GGGGAGGGAATT-TTTGTCTATT-39; Myc b nested, 59 -GGACAGTGTTCTCTGCCT-CTG-39. Myc c forward, 59-TGCCCTCTCAGAGACTGGTAA-39;
Myc cnested, 59-TTCCCCTTTCCTCTGTCATCT-39.Myc dforward, 59
-ATTCTTCCAGGTGGTGATGTC-39; Myc d nested, 59 -CTTCCCA-CAGCTCTCTTCCTT-39.Igh eforward, 59 -AACCCATCTACCCATG-TAGCC-39;Igh enested, 59-CCTCTGACTGCCTCTTTTCCT-39.Igh f
forward, 59-ACTGTGATCGGTTTTGGAGTG-39; Igh f nested, 59 -CTGGGAGGGTTTGGTTCTTAC-39.Igh gforward, 59 -CCCAGAACCT-GAGAAGGAAGA-39; Igh g nested, 59 -ACAGAACCGAACCAT-GACTTG-39. Igh h forward, 59-TTGGGCACTAAACACCACTTC-39;
Igh hnested, 59-GGTGTGTGCAGGTTTTTGTCT-39.Hbb-b1forward,
59-CTCAGAGCAGTATCTTTTGTTTGC-39; Hbb-b1 nested, 59 -AG-GATGAGCAATTCTTTTTGC-39. Calreticulin Cal1, 59 -CTCCAGA-TAAACCAGTATGAT-39; Cal2, 59 -AAACCAGATGAGGGCTGAAGG-39.ActbActb 1forward, 59- CGGTGCTAAGAAGGCTGTTCC-39; Actb 1nested, 59- AGCAAGAGAGGTATCCTGACC-39.ActbActb 2forward, 59- TGTGACAAAGCTAATGAGG-39; Actb 2nested, 59 -TGAGTA-GATGCACAGTAGG-39.
Supporting Information
Figure S1.3C Assay
Found at doi:10.1371/journal.pbio.0050192.sg001 (807 KB PDF).
Acknowledgments
We thank Wolf Reik for critical review of the manuscript. JAM was supported by a Natural Sciences and Engineering Research Council of Canada Postdoctoral Fellowship. AH was supported by a Medical Research Council, United Kingdom, studentship. PF is a Senior Fellow of the Medical Research Council, United Kingdom.
the experiments. CSO, LC, JAM, AH, ALW, and DJB performed the experiments. CSO and PF analyzed the data. CSO and PF wrote the paper.
Funding.This work was supported in part by the Medical Research
Council and Biotechnology and Biological Sciences Research Council, United Kingdom.
Competing interests.The authors have declared that no competing interests exist.
References
1. Cremer M, von Hase J, Volm T, Brero A, Kreth G, et al. (2001) Non-random radial higher-order chromatin arrangements in nuclei of diploid human cells. Chromosome Res 9: 541–567.
2. Gerlich D, Beaudouin J, Kalbfuss B, Daigle N, Eils R, et al. (2003) Global chromosome positions are transmitted through mitosis in mammalian cells. Cell 112: 751–764.
3. Parada LA, McQueen PG, Misteli T (2004) Tissue-specific spatial organ-ization of genomes. Genome Biol 5: R44.
4. Bolzer A, Kreth G, Solovei I, Koehler D, Saracoglu K, et al. (2005) Three-dimensional maps of all chromosomes in human male fibroblast nuclei and prometaphase rosettes. PLoS Biol 3: e157. doi:10.1371/journal.pbio.0030157 5. Branco MR, Pombo A (2006) Intermingling of chromosome territories in interphase suggests role in translocations and transcription-dependent associations. PLoS Biol 4: e138. doi:10.1371/journal.pbio.0040138 6. Roix JJ, McQueen PG, Munson PJ, Parada LA, Misteli T (2003) Spatial
proximity of translocation-prone gene loci in human lymphomas. Nat Genet 34: 287–291.
7. Grande MA, van der Kraan I, de Jong L, van Driel R (1997) Nuclear distribution of transcription factors in relation to sites of transcription and RNA polymerase II. J Cell Sci 110: 1781–1791.
8. Iborra FJ, Pombo A, Jackson DA, Cook PR (1996) Active RNA polymerases are localized within discrete transcription‘‘factories’ in human nuclei. J Cell Sci 109: 1427–1436.
9. Osborne CS, Chakalova L, Brown KE, Carter D, Horton A, et al. (2004) Active genes dynamically colocalize to shared sites of ongoing tran-scription. Nat Genet 36: 1065–1071.
10. Ragoczy T, Bender MA, Telling A, Byron R, Groudine M (2006) The locus control region is required for association of the murine beta-globin locus with engaged transcription factories during erythroid maturation. Genes Dev 20: 1447–1457.
11. Zeng C, Kim E, Warren SL, Berget SM (1997) Dynamic relocation of transcription and splicing factors dependent upon transcriptional activity. EMBO J 16: 1401–1412.
12. Kimura H, Sugaya K, Cook PR (2002) The transcription cycle of RNA polymerase II in living cells. J Cell Biol 159: 777–782.
13. Levsky JM, Shenoy SM, Pezo RC, Singer RH (2002) Single-cell gene expression profiling. Science 297: 836–840.
14. Wu J, Iwata F, Grass JA, Osborne CS, Elnitski L, et al. (2005) Molecular determinants of NOTCH4 transcription in vascular endothelium. Mol Cell Biol 25: 1458–1474.
15. Cai L, Friedman N, Xie XS (2006) Stochastic protein expression in individual cells at the single molecule level. Nature 440: 358–362. 16. Raj A, Peskin CS, Tranchina D, Vargas DY, Tyagi S (2006) Stochastic mRNA
synthesis in mammalian cells. PLoS Biol 4: e309. doi:10.1371/journal.pbio. 0040309
17. Chubb JR, Trcek T, Shenoy SM, Singer RH (2006) Transcriptional pulsing of a developmental gene. Curr Biol 16: 1018–1025.
18. Klemsz MJ, Justement LB, Palmer E, Cambier JC (1989) Induction of c-fos and c-myc expression during B cell activation by IL-4 and immunoglobulin binding ligands. J Immunol 143: 1032–1039.
19. Bolland DJ, Wood AL, Johnston CM, Bunting SF, Morgan G, et al. (2004) Antisense intergenic transcription in V(D)J recombination. Nat Immunol 5: 630–637.
20. Sun BK, Deaton AM, Lee JT (2006) A transient heterochromatic state in Xist preempts X inactivation choice without RNA stabilization. Mol Cell 21: 617–628.
21. Beyer AL, Osheim YN (1988) Splice site selection, rate of splicing, and alternative splicing on nascent transcripts. Genes Dev 2: 754–765. 22. Krumm A, Meulia T, Brunvand M, Groudine M (1992) The block to
transcriptional elongation within the human c-myc gene is determined in the promoter-proximal region. Genes Dev 6: 2201–2213.
23. Wijgerde M, Grosveld F, Fraser P (1995) Transcription complex stability and chromatin dynamics in vivo. Nature 377: 209–213.
24. Neves H, Ramos C, da Silva MG, Parreira A, Parreira L (1999) The nuclear topography of ABL, BCR, PML, and RARalpha genes: Evidence for gene proximity in specific phases of the cell cycle and stages of hematopoietic differentiation. Blood 93: 1197–1207.
25. Mayer R, Brero A, von Hase J, Schroeder T, Cremer T, et al. (2005) Common themes and cell type specific variations of higher order chromatin arrangements in the mouse. BMC Cell Biol 6: 44.
26. Dekker J, Rippe K, Dekker M, Kleckner N (2002) Capturing chromosome conformation. Science 295: 1306–1311.
27. Tolhuis B, Palstra RJ, Splinter E, Grosveld F, de Laat W (2002) Looping and
interaction between hypersensitive sites in the active beta-globin locus. Mol Cell 10: 1453–1465.
28. Hecht JL, Aster JC (2000) Molecular biology of Burkitt’s lymphoma. J Clin Oncol 18: 3707–3721.
29. Potter M (2003) Neoplastic development in plasma cells. Immunol Rev 194: 177–195.
30. Radford IR (2002) Transcription-based model for the induction of interchromosomal exchange events by ionizing irradiation in mammalian cell lines that undergo necrosis. Int J Radiat Biol 78: 1081–1093. 31. Forrester HB, Radford IR (2004) Ionizing radiation-induced chromosomal
rearrangements occur in transcriptionally active regions of the genome. Int J Radiat Biol 80: 757–767.
32. Chuang CH, Carpenter AE, Fuchsova B, Johnson T, de Lanerolle P, et al. (2006) Long-range directional movement of an interphase chromosome site. Curr Biol 16: 825–831.
33. Chubb JR, Boyle S, Perry P, Bickmore WA (2002) Chromatin motion is constrained by association with nuclear compartments in human cells. Curr Biol 12: 439–445.
34. Heun P, Laroche T, Shimada K, Furrer P, Gasser SM (2001) Chromosome dynamics in the yeast interphase nucleus. Science 294: 2181–2186. 35. Vazquez J, Belmont AS, Sedat JW (2001) Multiple regimes of constrained
chromosome motion are regulated in the interphase Drosophila nucleus. Curr Biol 11: 1227–1239.
36. Silva S, Wiener F, Klein G, Janz S (2005) Location of Myc, Igh, and Igk on Robertsonian fusion chromosomes is inconsequential for Myc trans-locations and plasmacytoma development in mice, but Rb(6.15)-carrying tumors prefer Igk-Myc inversions over translocations. Genes Chromosomes Cancer 42: 416–426.
37. Spilianakis CG, Lalioti MD, Town T, Lee GR, Flavell RA (2005) Interchromosomal associations between alternatively expressed loci. Nature 435: 637–645.
38. Misteli T (2004) Spatial positioning; a new dimension in genome function. Cell 119: 153–156.
39. Kosak ST, Groudine M (2004) Form follows function: The genomic organization of cellular differentiation. Genes Dev 18: 1371–1384. 40. Kuppers R, Dalla-Favera R (2001) Mechanisms of chromosomal
trans-locations in B cell lymphomas. Oncogene 20: 5580–5594.
41. Raghavan SC, Swanson PC, Wu X, Hsieh CL, Lieber MR (2004) A non-B-DNA structure at the Bcl-2 major breakpoint region is cleaved by the RAG complex. Nature 428: 88–93.
42. Vaandrager JW, Schuuring E, Philippo K, Kluin PM (2000) V(D)J recombinase-mediated transposition of the BCL2 gene to the IGH locus in follicular lymphoma. Blood 96: 1947–1952.
43. Liu LF, Wang JC (1987) Supercoiling of the DNA template during transcription. Proc Natl Acad Sci U S A 84: 7024–7027.
44. Ju BG, Lunyak VV, Perissi V, Garcia-Bassets I, Rose DW, et al. (2006) A topoisomerase IIbeta-mediated dsDNA break required for regulated transcription. Science 312: 1798–1802.
45. Zhang Y, Rowley JD (2006) Chromatin structural elements and chromoso-mal translocations in leukemia. DNA Repair (Amst) 5: 1282–1297. 46. Riou JF, Gabillot M, Riou G (1993) Analysis of topoisomerase II-mediated
DNA cleavage of the c-myc gene during HL60 differentiation. FEBS Lett 334: 369–372.
47. Thompson M, Haeusler RA, Good PD, Engelke DR (2003) Nucleolar clustering of dispersed tRNA genes. Science 302: 1399–1401.
48. Pratt-Hyatt MJ, Kapadia KM, Wilson TE, Engelke DR (2006) Increased recombination between active tRNA genes. DNA Cell Biol 25: 359–364. 49. Mo X, Dynan WS (2002) Subnuclear localization of Ku protein: Functional
association with RNA polymerase II elongation sites. Mol Cell Biol 22: 8088–8099.
50. Gribnau J, Diderich K, Pruzina S, Calzolari R, Fraser P (2000) Intergenic transcription and developmental remodeling of chromatin subdomains in the human beta-globin locus. Mol Cell 5: 377–386.
51. Chakalova L, Carter D, Fraser P (2004) RNA fluorescence in situ hybridization tagging and recovery of associated proteins to analyze in vivo chromatin interactions. Methods Enzymol 375: 479–493.
52. Brown KE, Amoils S, Horn JM, Buckle VJ, Higgs DR, et al. (2001) Expression of alpha- and beta-globin genes occurs within different nuclear domains in haemopoietic cells. Nat Cell Biol 3: 602–606.