Adv. Radio Sci., 6, 307–310, 2008 www.adv-radio-sci.net/6/307/2008/
© Author(s) 2008. This work is distributed under the Creative Commons Attribution 3.0 License.
Advances in
Radio Science
Transient measurement results of pulse propagation in large GTEM
cells
H. Thye1, G. Armbrecht2, and M. Koch1
1Institut f¨ur Grundlagen der Elektrotechnik, Leibniz Universit¨at Hannover, Germany
2Institut f¨ur Hochfrequenztechnik und Funksysteme, Leibniz Universit¨at Hannover, Germany
Abstract. This contribution deals with the results of a tran-sient measurement campaign incorporating ultra-wideband (UWB) pulses applied to a large GTEM cell. The main pur-pose is to analyse the distortion effects on such a feeding pulse when transformed into a field pulse inside the cells testing volume. We will investigate if the TEM field distri-bution is interfered by multimode propagation, that may lead to location-dependent pulse distortion and ringing. Finally, conclusions on the applicability of GTEM cells for standard-ized transient EMC measurements will be drawn.
1 Introduction
In recent years there has been an increasing demand for im-munity testing with fast transient signals, especially regard-ing UWB signals (rise time about 400 ps). This particular interest is driven by the increasing application of UWB sig-nals both in military and in civilian applications. The dou-ble exponential pulse (DEP) represents a prominent UWB pulse shape for EMC immunity considerations. Because of the short rise times the pulses have a instantaneous frequency spectrum up to the Gigahertz range.
The abbreviation GTEM cell stands for Gigahertz Transversal ElectroMagnetic cell and implies that the upper frequency limit up to which the TEM mode is dominant ex-tends to the GHz range., so it falls into consideration as a measurement instrument for these signals. However, it is well known, that the GTEM as well as the Crawford cell loses its pure TEM behavior above certain frequencies (Wil-son, 1995). Extensive investigations in the frequency domain have shown that these phenomena are caused by the excita-tion of higher order modes (Koch, 1998). In this article the analysis focus on the consequences of the expected
excita-Correspondence to:H. Thye ([email protected])
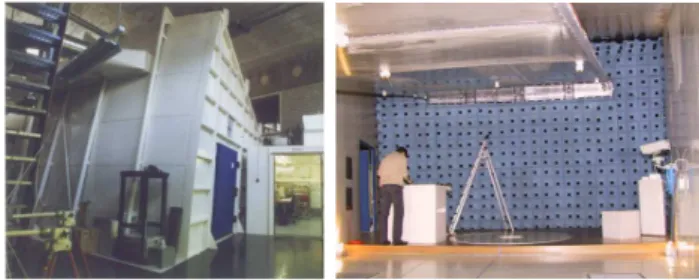
Fig. 1.Outer view and inner view of the GTEM 3750.
tion of higher order modes. Depending on the distinct obser-vation point in the testing volume the measurement results of the feeding pulse are considered by means of pulse distor-tion and ringing effects. The investigated GTEM 3750 oper-ated by armasuisse, locoper-ated in Bern (Switzerland). The total length is 15.51 m and the height of the septum in the testing volume is 3.22 m. Figure 1 illustrates the large dimensions.
The article is structured as follows: In Sect. 2 the used measurement environment setup will be introduced with all hardware components. After the presentation of the defined coordinate systems and the observation points in the cell, the section ends with an introduction of the used excitation sig-nal. After that, Sect. 3 will show selected measurement re-sults. On the basis of these results first general conclusions can be made.
2 Measurement setup
Figure 2 shows the complete drafted measurement setup with all components like probes, cables, sampling oscillo-scope. Inside the cell, E- or H-field sensors are fixed on an electromagnetic non-visible EMC-tripod. The connection to the receiver is provided through optical waveguides in or-der to minimize the additional field distortion as by metal-lic waveguides. The optical receiver transforms the received signals into voltages, which can be displayed in the sampling
308 H. Thye et al.: Pulse propagation in large GTEM cells
pulse generator
oscilloscope optical receiver
field sensor
optical waveguide
Fig. 2.View of the measurement setup.
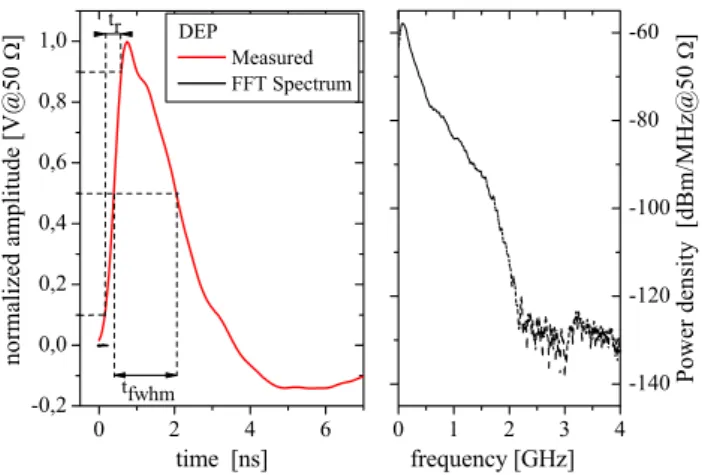
Fig. 3.Applied DEP function in time and frequency domain.
oscilloscope with a maximal resolution of 20 GS/s. The uti-lized signal source is the commercial pulse generator HYPS by Grant Applied Physics. It sends a double exponential pulse (DEP) with a turnable peak value up to nearly 1.5 kV, which is a common pulse form for transient EMC testing procedures. This voltage leads to a maximum electric field strength of approximately 400 V/m in the testing volume of the cell. Figure 3 shows the normalized amplitude in time domain and the spectral power density of the output signal of the introduces signal generator into a 50 match. To measure the signal, attenuators with 60 dB attenuation were placed between the generator and the oscilloscope. The DEP has a rise timetr of about 400 ps and a full width half max value (tf whm) of 1.7 ns. Due to this values the DEP has a limit frequency to noise at about 2.5 GHz. Furthermore the pulse parameters rise time (tr) and full width half max value (tf whm) are each identified.
Figure 4 shows the defined coordinate systems. Due to the practical consideration of the measurement setup the z-axis of the dashed coordinate system (x′, y′, z′) is defined
parallel to the ground of the cell because the field sensor is originally determined in the dashed coordinate system. In the main coordinate system (x, y, z) the z-axis is defined in the geometrical center of the cell. Because of that the xy-cross section, at any z-coordinate, is proportionally scaled, which
A z’
z x
x’ y’
y
Fig. 4.Definition of the used coordinate systems.
Ey
Hx
x y
z
Fig. 5.Main electromagnetic components in the cross section of the cell.
leads to the typical pyramidal shape of a GTEM cell. In the following section all field quantities are specified with this system.
3 Results
In this section the measurement results will be discussed. First, the measurement results are extracted at distinct probe positions in the testing volume of the cell. After that, con-tour plots show the field distribution at one complete cross section. Provided that the TEM mode is dominating the mag-netic x-component (Hx) and the electric y-component (Ey), according to the introduced coordinate system, these are the main field components. As depicted in Fig. 5,Hx encloses the septum of the cell, whereasEyis straight line orientated from the septum to the cells floor. In this paper, exemplarily
HxandHywill be considered for presentation.
As already introduces by Koch (1998) the field is ex-tracted at defined field points (P1–P10) in the testing vol-ume of the cell. The positions are located in two differ-ent xy-planes, varying the first cross-section (y′
1=0.88 m and
z′
1=8.51 m, P7–P10) to the second cross-section (y2′=1.25 m
andz′
2=12.11 m, P7–P10). The points are located in the
cen-ter of the cell in x-direction with an incremental distance
1x=0.5 m.
Figure 7 shows the first results of the normalized magnetic field component Hx at the points P1 and P7, which only differ in the z-coordinate. As predicted the amplitudes of the pulses declines with increasing distance from the feeding
H. Thye et al.: Pulse propagation in large GTEM cells 309
x−coordinate [m]
time [ns]
|Hx|(~A/m)
−1.5 −1 −0.5 0 0.5 1 1.5
690 700 710 720 730 740 750
0 0.1 0.2 0.3 0.4 0.5 0.6 0.7 0.8 0.9 1
x−coordinate [m]
time [ns]
−2.5 −2 −1.5 −1 −0.5 0 0.5 1 1.5 2 2.5
690 700 710 720 730 740 750
turntable
Cross−
Cross− section 2
section 1 Boundaries of the
Cross-section 1 at z′=8.51 m Cross-section 2 at z′=12.22 m Draft of the GTEM cell
Fig. 6.Magnitude of the normalized measured time dependent magnetic x-component in two cross sections of the GTEM cell.
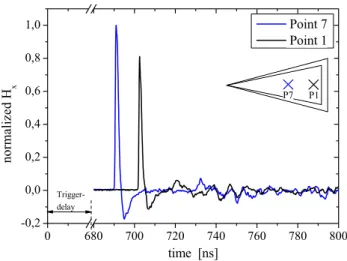
Fig. 7.MeasuredHxin two points with absolute time scaling (DEP
Excitation).
port. Both results are equally retarded by a trigger delay of about nearly 680 ns. Due to the constant trigger delay, that similarly effects empty results, it is possible to measure the time dependent reflections with absolute values.
As mentioned in the introduction, a major interest of the investigation is the distortion of the excited voltage pulse in the testing volume of the cell. Therefore, the normalized ex-citing voltage pulse and the normalized measuredHxat point P1 are compared. As shown in Fig. 8 there is a sound correla-tion of these signals. The rise times and pulse widths of both
Fig. 8. Comparison of normalized incoming pulse and measured
Hxat point 1 (DEP Excitation).
impulses are nearly identical. Only in the area of the falling edge it is noticeable that the measured field pulse is narrower than the excitation pulse. An explanation is the expansion of the excitation pulse through the attenuators which are nec-essary for its measurement (see Sect. 2). Significant dif-ferences arise primarily as reflections arrive (ringing effect). The measurement setup includes the field sensors, which ex-hibit an unknown transfer function. If the field pulse had been broader that the excitation pulse, a field sensor could not have reversed this propagation.
310 H. Thye et al.: Pulse propagation in large GTEM cells
y−coordinate [m]
time [ns]
|Hy|(~A/m)
−1.5 −1 −0.5 0 0.5 1 1.5
690 700 710 720 730 740 750
0 0.1 0.2 0.3 0.4 0.5 0.6 0.7 0.8 0.9 1
y−coordinate [m]
time [ns]
−2.5 −2 −1.5 −1 −0.5 0 0.5 1 1.5 2 2.5
690 700 710 720 730 740 750
Cross-section 1 at z′=8.51 m Cross-section 2 at z′=12.22 m
Fig. 9.Magnitude of the normalized measured time dependent magnetic y-component in two cross sections of the GTEM cell.
In order to get a better impression of the local dispersion of the electromagnetic field in the cell, the field allocation in two defined cross sections are investigated. Hence, Fig. 6 shows a contour plot of the two cross sections, which in-cludes the shown field points P1 and P7. The normalized amplitude ofHxis presented time dependent in Fig. 6a (cross section 1, P7–P10) and Fig. 6b (cross section 2, P1–P6). Due to the symmetry properties of GTEM cells, the results to the yz-level can be mirrored. With these contour figures, the dis-placement in the time domain at the outer regions in the cell and the relationship of the amplitudes (included the reflec-tions) can be analyzed at once. For practical considerations the DUT is placed on the turntable in the testing volume dur-ing the measurements. Figure 6 signifies the dimensions of this turntable with dashed lines. Additionally, Fig. 9a and b shows the magnetic y-component (Hy) in the same cross sec-tions (1 and 2). Because of the lower absolute value ofHyin relation toHx(about 3.8% of the peak value) the amplitude is independently normalized to make the pulse propagation visible.
4 Conclusions
In this paper pulse propagation measurements directly in time domain were conducted in a large GTEM cell. Se-lected electromagnetic field distributions in the testing vol-ume of reflections the cell were presented in one- and two-dimensional plots. It was shown that the primary pulse in the GTEM cell displays a nearly distortionfree transformation of
the voltage pulse. After the primary pulse passes through the cell, a number of reflections with apparent attenuated ampli-tudes are visible. This point and the fact, that the main field components (Hx andEy) are dominating in relation to the other, leads to the conclusion, that the TEM mode dominates by transient measurements in GTEM cells. Further investi-gations are necessary to verify this statement.
Acknowledgements. The authors would like to thank the armasu-isse, especially H. Sch¨ar and A. Horvarth for the supply of the mea-surement setup and the support during the meamea-surements.
References
Camp, M., Garbe, H., and Nitsch, D.: Influence of the technology on the destruction effects of semiconductors by impact of EMP and UWB pulses, IEEE International Symposium on EMC 2002, pp. 87–92, USA, Minneapolis, 2002.
Koch, M.: Analytische Feldberechnung in TEM-Zellen, Disserta-tion Uni Hannover, 1998.
Wilson, P.: On Correlating TEM-cell and OATS Emission Mea-surements, IEEE Transactions on Electromagnetic Compatibil-ity, 1995.