Frequency Domain Analysis for Assessing Fluid
Responsiveness by Using Instantaneous Pulse Rate
Variability
Pei-Chen Lin
Institute of Biomedical Engineering National Chiao Tung University
Hsinchu, Taiwan R.O.C.
Chia-Chi Chang
Department of Electronics Engineering and Institute of Electronics, Institute of Biomedical Engineering, Biomedical Electronics Translational Research Center
National Chiao Tung University Hsinchu, Taiwan R.O.C.
Hung-Yi Hsu
Department of Neurology Chung Shan Medical UniversitySection of Neurology, Department of Internal Medicine Tungs‟ Taichung Metro Harbor Hospital, No.699, Sec. 8,
Taiwan Blvd., Wuqi Dist., Taichung City 435 Taichung, Taiwan R.O.C.
Tzu-Chien Hsiao*
Department of Computer Science, Institute of Biomedical Engineering, Biomedical Electronics Translational Research
Center
National Chiao Tung University Hsinchu, Taiwan R.O.C.
Abstract—In the ICU, fluid therapy is conventional strategy for the patient in shock. However, only half of ICU patients have well-responses to fluid therapy, and fluid loading in non-responsive patient delays definitive therapy. Prediction of fluid responsiveness (FR) has become intense topic in clinic. Most of conventional FR prediction method based on time domain analysis, and it is limited ability to indicate FR. This study proposed a method which predicts FR based on frequency domain analysis, named instantaneous pulse rate variability (iPRV). iPRV provides a new indication in very high frequency (VHF) range (0.4-0.8Hz) of spectrum for peripheral responses. Twenty six healthy subjects participated this study and photoplethysmography signal was recorded in supine baseline, during head-up tilt (HUT), and passive leg raising (PLR), which induces variation of venous return and helps for quantitative assessment of FR individually. The result showed the spectral power of VHF decreased during HUT (573.96±756.36 ms2 in baseline; 348.00±434.92 ms2 in HUT) and increased during PLR (573.96±756.36 ms2 in baseline; 718.92±973.70 ms2 in PLR), which present the compensated regulation of venous return and FR. This study provides an effective indicator for assessing FR in frequency domain and has potential to be a reliable system in ICU.
Keywords—fluid responsiveness (FR); instantaneous pulse rate variability (iPRV); head-up tilt (HUT); passive leg raising (PLR)
I. INTRODUCTION
In intensive care unit (ICU), most of patients shock due to lack amount of blood who are after surgery or during injury situation. Fluid therapy is a frequent therapeutic strategy for the shock. However, fluid loading in the non-fluid response patient will delay definitive therapy and may be harmful. Furthermore, only half of patients have well fluid responsiveness (FR) in the
ICU. Based on these for FR in patients is important in clinical. It is important to develop the reliable prediction method.
Conventional methods usually predict FR by using time domain analysis, such as impedance cardiography (ICG) and pleth variability index (PVI). ICG is a non-invasive method to detect electrical and impedance changes in the thorax by using dual sensors. The electrical and impedance changes are used to calculate hemodynamic parameters for evaluating fluid response. The reliability of hemodynamic parameters in ICG is based on placed position of dual sensors, which needs to operate by professional paramedic. PVI is a time domain analysis for predicting FR in mechanically ventilated patients. It adopts pulse oximeter waveform and then calculates dynamic change in perfusion index (PI) during respiratory cycle. Nevertheless, time domain analysis effects by motion artifact easily. For avoiding inaccuracy in time domain analysis by motion artifact, this study proposed a reliable method which predict FR by frequency domain analysis.
replace ECG recording in HRV and has been examined as a surrogate of HRV during non-stationary conditions in previous study [2]. Moreover, the arterial pulse wave is regulated from complex physiological controls which make PRV provide much more information than HRV.
However, frequency domain analysis of HRV and PRV are both limited by the timescale of RRi and pulse wave time intervals. Since timescale limitation, the indication of high frequency range in spectral analysis was restricted by time resolution. For breaking timescale limitation, a novel adaptive method, named instantaneous pulse rate variability (iPRV), was proposed [3]. It adopted the frequency range extension method based on ensemble empirical mode decomposition (EEMD) [4] and instantaneous period (iPR) projecting technique [5] help for PRV spectral analysis. Therefore, iPRV provides a new indication, named very high frequency (VHF) range (0.4-0.8Hz) for the neural regulatory estimation and peripheral responses [6]. The literature has proposed that VHF of HRV is as a novel index of left ventricular function evaluation [7], which further indicates the cardiac function, venous return, and FR. However, the variation and interpretation of VHF of iPRV still needs further exploration and examination. There is a common clinical experiment, named passive leg raising (PLR), which induces the increase of venous return and helps for the quantitative assessment of FR [8]. Previous study has examined that iPRV is reliable by using PPG during non-stationary condition, such as head-up tilt (HUT) [9]. This study performed the clinical experiment, known as HUT and PLR, for the further exploration and examination. Since several studies revealed that the VHF index of HRV is a reliable evaluation of cardiovascular diseases [7]. VHF of iPRV has potential to indicate more physiological responses.
The aim of this study is to 1) explore the potential indication of VHF of iPRV during HUT and PLR, and 2) interpret the physiological meaning of VHF of iPRV in different non-stationary conditions.
II. METHODS
A. Subjects and Data Collection
Twenty six healthy subjects (male: 14; age: 24±1), who had no history of cardiovascular disease, participated this study. All recruited subjects performed four trials in whole experiment. First, subjects were rest in supine position with 10-minute recording as baseline. Second, subjects were tilting up passively (HUT) on the automatic tilting table and kept in tilt-up position for 10 minutes. Then, subjects were back to the supine position with 5 minutes for recovering to baseline. Finally, subjects were raising leg passively (PLR) for 10 minutes. All measurements were performed in a quiet temperature controlled room and the experiment was approved by institutional review board of the hospital. This study was approved by institutional review board of Tungs‟ Taichung Metro Harbor Hospital. Informed consent was obtained from all participants before the experiment.
The ECG signal was recorded by BEST-C-04056 (BioSenseTek Corp., Taiwan) and the PPG signal was recorded
by Nonin 8500 (Nonin Medical Inc., Plymouth, MN) with a sampling frequency 200Hz.
B. Instantaneous Pulse Rate Variability
The algorithm of iPRV analysis shows at Fig. 1. At first, the blood pulse signal was extracted from PPG signal as the pulse wave component by sifting process in EEMD. Sifting process is an iteratively detrending operation which uses to compute finite set of components, named intrinsic mode functions (IMFs), from source non-stationary data. Moreover, before sifting process, EEMD provides noise-assisted method into original data for eliminating multiple characteristic problem in IMFs. After mixtures of added noise and source data, detrending operation contains several steps. First, local extrema of data are identified by peak-valley detection. The upper envelope and lower envelope are generated by cubic spline interpolation according to the local maxima and local minima. The trend in current timescale is computed by calculating the mean of and , as .
The new timescale is representation after detrending operation by data subtracting the trend.
(2) Where After times detrending operation, if the trend of satisfies the criterion as the steady constant trend, then the components were extracted from as IMF. After sifting process, was decomposed into IMFs, , and one residue .
∑ (3)
Since IMFs were decomposed from different mixtures, the ensemble IMFs are computed by averaging each corresponding IMF. However, the resolution of timescale still limit spectral analysis. For breakthrough timescale limitation, iPRV adopts iPR of blood pulse signal for proposing variation by using normalized direct quadrature (NDQ) [5]. NDQ contains several steps. First, the amplitude modulation of main component
was eliminated by iteratively normalization. Then, the empirical frequency modulation (FM) signal of
is assumed to be cosine function, and its quadrature
can be computed directly.
√ (4) The instantaneous phase is calculated by taking
of FM signal and its quadrature, then the iPRinstan is obtained from inverse of the derivative of instantaneous phase.
Fig. 1. The flow illustration of the algorithm of instantaneous pulse rate variability (iPRV)
C. Time Domain Sequential Analysis
This study used a correlation analysis to time domain sequential for ensuring similarity between iPRV and HRV during non-stationary conditions. Correlation analysis has several steps as follows (Fig. 2). First, low frequency band of iPR was filtered by low-pass filter in order to receive instantaneous pulse rate (iPRLF) series for comparing with interpolated time series of RRi . Then, cross correlation and mean square error between iPRLF and RRi were calculated to measure the similarity between iPRV and HRV as time domain sequential analysis.
∑ ̅̅̅̅̅̅̅ ̅̅̅̅̅̅̅ √∑ ̅̅̅̅̅̅̅ √∑ ̅̅̅̅̅̅̅
(6)
Where presents data length number of iPRLF and RRi. is the time shift. ̅̅̅̅̅ and ̅̅̅̅̅̅ are the means of the corresponding series.
D. Statistic Analysis
Variation of spectral power in each frequency band were compared between different analysis method and different condition using paired-sample t test for significant difference. P value less than 0.05 was considered statistically significant. Results of spectral power are reported as mean ± standard deviation. Statistical analysis was performed using commercial statistics software.
III. RESULTS
A. Time Domain Sequential Analysis Between Baseline and Non-stationary States
The comparison of time series between iPRLF and RRi was presented in Fig. 3 in one of the participants as an example. The iPRLF and RRi were similar fluctuation in different conditions sequentially in time domain.
Fig. 2. The flow illustration of the algorithm of correlation analysis
The results of the time domain sequential analysis were summarized in Table I. The results of all participants‟ cross correlation between iPRLF and RRi were high correlation (0.667±0.109 in baseline; 0.672±0.096 in HUT; 0.675±0.105 in PLR). Mean square error between iPRLF and RRi were quite small (0.005±0.004 in baseline; 0.004±0.005 in HUT; 0.005±0.005 in PLR). There is no significant difference between each condition.
TABLE I. THE RESULT OF CROSS CORRELATION AND MEAN SQUARE
ERROR IN DIFFERENT CONDITIONS
Baseline Head-up tilt (HUT)
Passive leg raising (PLR) Cross
correlation 0.667±0.109 0.672±0.096 0.675±0.105 Mean square
error 0.005±0.004 0.004±0.005 0.005±0.005
The form is (mean ± standard deviation). B. Spectral Analysis of Different Conditions in HRV and
iPRV
Fig. 3. The comparison of fluctuation of time series during different conditions. (a) RRi from ECG, (b) iPRLF from PPG
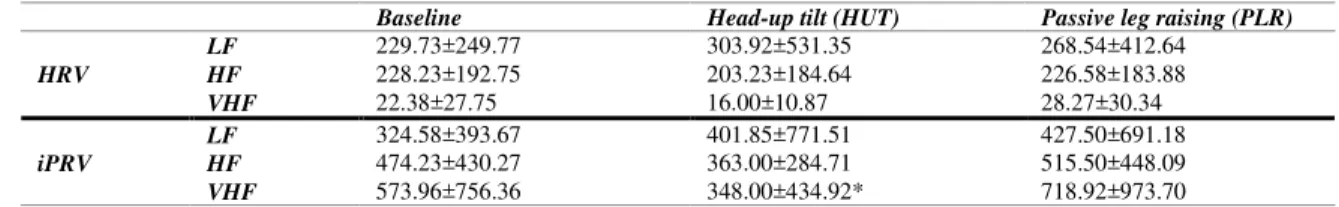
TABLE II. THE RESULT OF HRV AND IPRV SPECTRUM
Baseline Head-up tilt (HUT) Passive leg raising (PLR)
HRV
LF 229.73±249.77 303.92±531.35 268.54±412.64
HF 228.23±192.75 203.23±184.64 226.58±183.88
VHF 22.38±27.75 16.00±10.87 28.27±30.34
iPRV
LF 324.58±393.67 401.85±771.51 427.50±691.18
HF 474.23±430.27 363.00±284.71 515.50±448.09
VHF 573.96±756.36 348.00±434.92* 718.92±973.70
The form is (mean ± standard deviation); * means p<0.05 compared with HRV. LF denotes low frequency band (0.04-0.15Hz); HF denotes high frequency band (0.15-0.4Hz); VHF denotes very high frequency band (0.4-0.8Hz).
Fig. 4. The illustration of the iPRV spectrum during (a) baseline, (b) head-up tilt (HUT), and (c) passive leg raising (PLR) in one of the participant as an example
IV. DISSCUSSION
The component represents pulse wave was extracted from PPG signal by using EEMD. As a result, NDQ is a reliable technique to transform pulse wave component into iPR, which indicates the regulation of ANS in spectral analysis [3]. The reliability of iPRV in frequency domain had been examined in the literature [9]. In addition, the information from iPR is more than from RRi by using frequency extension method to break limitation of time resolution in RRi. For the verification of the reliability of iPR in time domain, this study performed time sequential comparison of iPRLF and RRi for further examination. The result illustrated that the time series of iPR is similar with RRi and contains much more intrinsic components with high frequency component, which provides much more physiological information for the assessment. Moreover, iPRV has high positive correlation with HRV in time domain. It has the potential usefulness as an indicator for cardiovascular circulation assessment.
This study applied the clinical experiment, known as HUT and PLR, for the further examination. HUT and PLR served as the simple clinical experiments for cardiovascular circulation evaluation. HUT causes temporarily decrease of blood volume in upper body and then causes the decrease of venous return. These changes induce the auto-regulation for the compensation. The sympathetic activities increased during HUT, and the power of LF in HRV also increased, which quantitatively assessed the sympathetic activation. On the other hand, the parasympathetic activities decreased, and so did the power of HF in HRV. The LF and HF in iPRV shows the same variation with HRV during HUT. Furthermore, it offers information in the power of VHF decreased when venous return decreased. In another experiment, PLR causes the increase of blood volume in upper body and then causes the increase of venous return. The cardiac function was increased temporarily and induces the peripheral FR. The PLR induces sympathetic activation [10] and the power of LF both in HRV and iPRV also increased. The power in VHF in iPRV increased when venous return increased during PLR. However, the power of HF in iPRV during PLR had different variation with HRV. This is probably due to effect of respiratory frequency. Even respiratory influence, the iPRV spectrum still demonstrated similar variation along with HRV spectrum in LF and HF during HUT and PLR. Besides, the results showed that VHF has potential to indicate the relevant change of venous return and monitor the FR. It is reliable to observe FR in frequency domain analysis during different status of venous return. Predict FR also can be simple and intuitive by data acquisition from PPG and using method of iPRV to analyze.
Though iPRV analysis provided more information of venous return and FR in VHF, it has some limitations. First, it needed to combine with clinical trial (PLR) for observing variation, and it is improper as a real-time application. Second, the data acquisition depends on PPG sensor, which is sensitive and easy to be influenced by body movement and unstable measurement.
However, arterial blood pressure signal can substitute as another source signal for iPRV analysis [3], but the relavant measurement instrument is expensive and is not simple for usage. Third, the iPRV analysis based on the EEMD method which needed to set appropriate parameters and the results are mainly influenced by the parameters setting, which is different while the source signal and the signal properties, such as sampling rate, are different. In addition to these limitations, VHF in iPRV is reliable indicator for FR. The indicator would be examined on non-responders to verify the effectiveness and quantify level of variation of VHF, such as the threshold for the diagnostic reference that evaluate patient who has well FR or not.
V. CONCLUSION
This study provides an effective indicator for assessing FR in frequency domain. It has potential to be a reliable system for ICU which avoid delaying definitive therapy or additional damage to patient. In the future, this indicator needs to implement on the patients for further exploration.
ACKNOWLEDGMENT
This work was fully supported by the Taiwan Ministry of Science and Technology under grant numbers MOST-103-2218-E-009-016, MOST-103-2221-E-009-139, and MOST 104-2220-E-009-003, and in part by „Aim for the Top University Plan‟ of the National Chiao Tung University and Ministry of Education, Taiwan, R.O.C. This work was also supported in part by the UST-UCSD International Center of Excellence in Advanced Bioengineering sponsored by the Taiwan National Science Council I-RiCE Program under grant number NSC-101-2911-I-009-101.
REFERENCES
[1] M. V. Højgaard, N. H. Holstein-Rathlou, E. Agner, and J. K. Kanters,
“Reproducibility of heart rate variability, blood pressure variability and baroreceptor sensitivity during rest and head-up tilt,” Blood Pressure Monitoring, vol. 10, pp. 19–24, February 2005.
[2] E. Gil, M. Orini, R. Bailón, J. M. Vergara, L. Mainardi, and P. Laguna,
“Photoplethysmography pulse rate variability as a surrogate
measurement of heart rate variability during non-stationary conditions,”
Physiological Measurement, vol. 31, pp. 1271–1290, August 2010. [3] C. C. Chang, T. C. Hsiao, and H. Y. Hsu, “Frequency range extension of
spectral analysis of pulse rate variability based on Hilbert–Huang
transform,” Medical & Biological Engineering & Computing, vol. 52, pp. 343–351, April 2014.
[4] Z. Wu, and N. E. Huang, “Ensemble empirical mode decomposition: a noise-assisted data analysis method,” Advances in Adaptive Data Analysis, vol. 1, pp. 1–41, January 2009.
[5] N. E. Huang, Z. Wu, S. R. Long, K. C. Arnold, X. Chen, and K. Blank,
“On instantaneous frequency,” Advances in Adaptive Data Analysis, vol. 1, pp. 177–229, April 2009.
[6] C.C. Chang, H.Y. Hsu, and T. C. Hsiao, “The interpretation of very high frequency band of instantaneous pulse rate variability during paced
respiration,” Biomedical engineering online, vol. 13, pp. 46–56 , April 2014.
[7] S. Babaeizadeh, et al., “A novel heart rate variability index for evaluation of left ventricular function using five-minute
electrocardiogram,” Computers in Cardiology, vol. 34, pp. 473–476, September 2007.
[8] X. Monnet, et al., “Passive leg raising predicts fluid responsiveness in the critically ill*,” Critical care medicine, vol. 34, pp. 1402–1407, May 2006.
[9] P. C. Lin, K. C. Hsu, C. C. Chang, and T. C. Hsiao, “Reliability of
instantaneous pulse rate variability by using photoplethysmography,” Workshop on Biomedical Microelectronic Translational Systems Research (WBMTSR 2014), August 2014.
[10] P. G. Guinot, et al., “Passive leg raising can predict fluid responsiveness in patients placed on venovenous extracorporeal membrane oxygenation,