A Comparison Study of Different Kernel Functions for SVM-based Classification of
Multi-temporal Polarimetry SAR Data
B. Yekkehkhany1,*, A. Safari1, S. Homayouni2, M. Hasanlou1
1 Dept. of Geomatics Engineering, College of Eng., U. of Tehran, Iran – (byekkehkhany, asafari, hasanlou)@ut.ac.ir 2 Dept. of Geography, University of Ottawa, Ottawa, Canada - [email protected]
KEY WORDS: Full-polarimetric SAR data, multi-temporal data, SVM, kernel functions, cop classification.
ABSTRACT:
In this paper, a framework is developed based on Support Vector Machines (SVM) for crop classification using polarimetric features extracted from multi-temporal Synthetic Aperture Radar (SAR) imageries. The multi-temporal integration of data not only improves the overall retrieval accuracy but also provides more reliable estimates with respect to single-date data. Several kernel functions are employed and compared in this study for mapping the input space to higher Hilbert dimension space. These kernel functions include linear, polynomials and Radial Based Function (RBF).
The method is applied to several UAVSAR L-band SAR images acquired over an agricultural area near Winnipeg, Manitoba, Canada. In this research, the temporal alpha features of H/A/α decomposition method are used in classification. The experimental tests show an SVM classifier with RBF kernel for three dates of data increases the Overall Accuracy (OA) to up to 3% in comparison to using linear kernel function, and up to 1% in comparison to a 3rd degree polynomial kernel function.
1. INTRODUCTION
Crop classification and mapping using synthetic aperture radar (SAR) is an important application of remote sensing and earth observation technology. The main advantage SAR observation compared with optical sensors is the all-weather mapping capability of these systems. The discrimination potential of SAR data is based on the sensitivity of the radar backscatter to the dielectric properties of the objects and their structure (i.e., the size, shape, and orientation distribution of the scatterers) [1], [2]. The possibility of identifying the individual classes is based on the fact that the dielectric properties and the structure of the different crop types are different. A distinct variation is seen for these properties through the growing season due to the development of crops [2]. Therefore, the discrimination capabilities may vary through the season, and it may also be improved by performingmulti-temporal classification [3], [4]. The radar backscatter is also sensitive to, e.g., the dielectric properties of the soil, the surface roughness, the terrain slope, and the vegetation canopy structure (e.g., the row direction and spacing, and the cover fraction) [1]. These properties are not necessarily specific for the individual classes and may therefore cause variability of the backscatter within the classes. Also, differences in the development stages at a specific point in time due to, for instance, differences in sowing time may cause such variability [2].
The full-polarimetric SAR observation contain very important source information about the terrestrial targets in the form of scattering matrix [5]. Therefore, such data may be used to assess the capabilities of SAR for classification in general and crop mapping where the backscattering models are more complex. Various methods have been used for SAR data classification such as the statistical methods based on the Wishart distribution [4], [6]-[7], or covariance matrix elements transformed into backscatter coefficients [4], [7]-[8], methods based on the scattering mechanisms [9], [10], and knowledge-based methods [11]-[12]. In the latter methods, it is possible to include scattering model results and common knowledge about the targets. Therefore, these approaches are normally relatively more robust and easy to adjust to different growing conditions due to, for example, various sowing time, soil, and weather
conditions. The number of different classes that can be determined is normally relatively small using this type of methods. The statistically based methods, on the other hand, will normally provide a larger number of classes, but the classifiers will then normally be specifically adjusted to the data set at hand, and it is difficult to adopt the classifier to other environmental conditions [13].
In this paper, we have developed a framework for the classification of the temporal alpha features of H/A/α decomposition method, using SVM classifier and studied the effect of various kernel function on classification accuracy and performance.
This paper is structured as follows. First, in Section 2, the SAR data and the test site will be described. Section 3 outlines the theoretical background for the classification methodology used in the study. The results are given in Section 4, together with the discussion. Section 5 contains the conclusions. Finally, section 6 is the acknowledgement.
2. METHODOLOGY
2.1 Polarimetric SAR data structure
A polarimetric SAR acquires data at the four linear polarizations, HH, HV, VH, and VV, and these measurements are formed into a scattering matrix. For a reciprocal medium in the monostatic case, the scattering matrix transforms into a scattering vector
� = [��� ��� ���]� ( )
where the superscript T denotes the matrix transpose and the ��� elements are the complex scattering amplitudes for transmitting t-polarization and receiving r-polarization. In the reciprocal case, �ℎ� equals ��ℎ, and in that case, an averaged element, i.e.,
matrix format and multi-looked for speckle reduction, and hence:
� =�∑� � � � � ∗�=
�=
[|���| ���
���∗ ������∗
������∗ |���| ������∗
������∗ ������∗ |���|
] (2)
where n is the number of pixels multi-looked, ∗ is the complex conjugate, and ‹› denotes spatial averaging. All elements in (2) are normalized with the factor � � cos �⁄ , where A is the ground resolution area and θ is the incidence angle. Hence, all data correspond to the γ0 backscatter coefficient in order to reduce the influence of the incidence angle.
2.2 Support Vector Machines (SVM)
A brief description of SVM is made here and more details can be found in [3].
1) Linear case: We should now consider the case of two classes’ problem with N training samples. Each samples are described by a Support Vector (SV) Xi composed by the different “band” with n dimensions. The label of a sample is Yi. For a two classes case we consider the label -1 for the first class and +-1 for the other. The SVM classifier consists in defining the function
= sign �, � + � ( )
which finds the optimum separating hyperplane as presented in Figure 1, where ω is normal to the hyperplane, and |�|
‖�‖ is the perpendicular distance from hyperplane to the origin.
Figure 1. SVM classifier; linear case
The sign of f(x) gives the label of the sample. The goal of the SVM is to maximize the margin between the optimal hyperplane and the support vector. So we search the min ‖�‖.
To do this, it is easier to use the Lagrange multiplier. The problem comes to solve:
= sign(∑��=� �. �� . � + �) (4)
where αi is the Lagrange multiplier.
2) Nonlinear case: If the case is nonlinear as the Figure 2 the first solution is to make soft margin that is particularly adapted to noised data. The second solution that is the particularity of SVM is to use a kernel. The kernel is a function that simulates the projection of the initial data in a feature space with higher dimension Φ: Κn→ H. In this new space the data are considered as linearly separable. To
apply this, the dot product x , x is replaced by the function:
� , � = ∅ , ∅ �
Then the new function to classify the data are:
= sign(∑��=� �. ��. � , � + �) (5)
Three kernels are commonly used:
The polynomial kernel:� , � = x. � + � The sigmoid kernel: � , � = tanh x. � + The RBF kernel: � , � = �−|�−��|
2
2�2
Figure 2. SVM classifier; nonlinear case
3) Multiclass case: The principle of SVM was described for a binary classification, but many problems have more than two-class problem. There exists different algorithms to multiclass problem as “One Against All” (OAA) and “One Against One” (OAO).
If we consider a problem with K class, OAA algorithm consists in the construction of k hyperplanes that separate respectively one class and the (k-1) other classes. OAO algorithm consists in the construction of � �− hyperplane which separate each pair of classes. In the two cases the final label is that mainly chosen.
4) Wishart classification: The Wishart classification involved only the T matrix elements especially dedicated to SAR data as it accounts for the Wishart distribution observed due to the presence of speckle noise [15].
3. FULL-POLARIMETRIC L-BAND SAR DATA
We have utilized several full-polarimetric L-band UAVSAR datasets. Several airborne L-band full polarimetry SAR data sets with a short revisit time have been acquired by the JPL UAVSAR system over an agriculture region near Winnipeg, Manitoba, Canada in the summer of 2012. The data acquisition was to support the future Soil Mapping Active Passive (SMAP) mission of JPL-NASA [14]. UAVSAR is an L-band SAR with a bandwidth of 80 Mhz. The antenna measures 0.5 meters in range by 1.5 meters in azimuth and is contained within a pod that hangs beneath the fuselage of the Gulfstream G-III aircraft. The antenna may be electronically steered along track; typically, it is steered to zero Doppler. The power transmitted is greater than 2 kW, and the noise equivalent for most of the swath is better than -45 dB. The single-look-complex data (SLC) have a pixel spacing of 0.6 m x 1.6 m. The Rosamond Calibration Array is used to calibrate the UAVSAR data to the required accuracy of one dB.
cross-track image swath is about 20 km, and a typical flight line is 100 km in length.
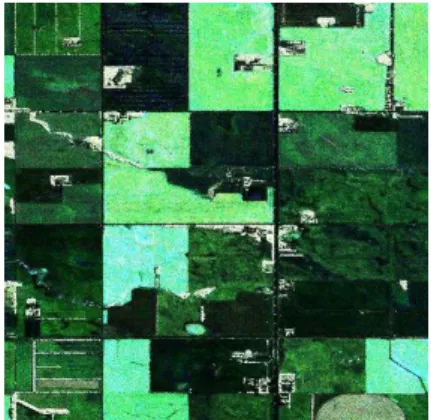
Several researches have shown that among various radar bands for crop classification, L-Band radar with wavelength of 24 cm, has the proper amount of penetration power, producing better distinguished scattering characteristics between crop classes [7]. As a result, the L-band observations have potential information for crops discrimination and classification, due to the specific typical structure and canopy of annual crops. A color composite representation of coherency matrix elements is shown in Figure 3.
Figure 3. color composite of coherency matrix (RGB: T11, T22, T33), acquired on 2012/07/17
4. RESULTS AND DISCUSSION
The proposed method is applied to the extracted multi data polarimetric features. Based on the available rreference crop map, (See Figure 4), several types of crop classes are considered and the training and test data are collected. They are Soybeans, Wheat, Canola/Rapeseed, Corn, Oats, Broadleaf and Unknown classes.
Color description soybeans
wheat canola/ rapeseed corn oats broadleaf unclassified
Figure 4. reference crop map (left) and its legend (right)
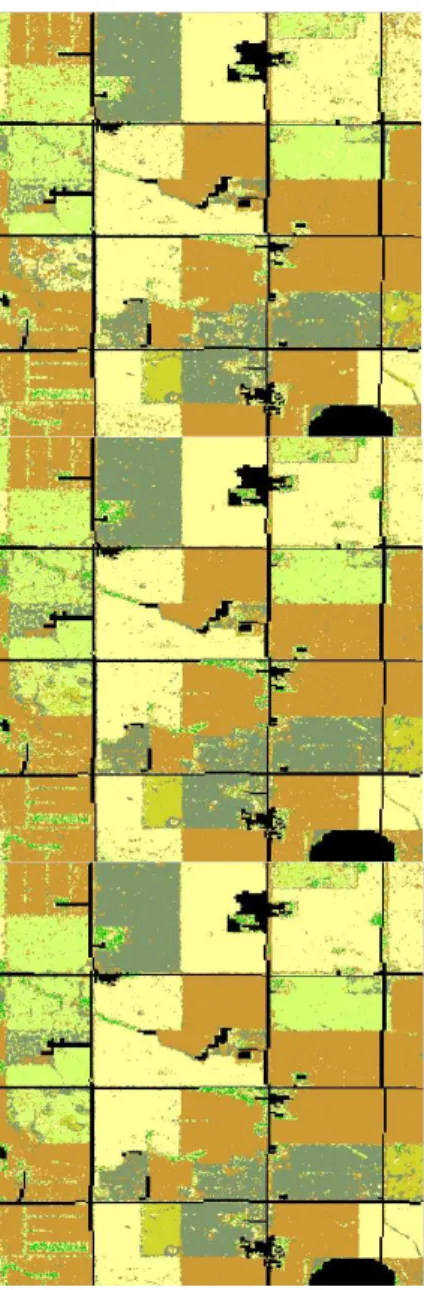
Figure 5 shows the result of the classification of alpha feature from H/A/α decomposition method using SVM classification with different kernels. The upper one shows the result of SVM classification with linear kernel. It is the basic kernel which is the simplest one and takes the least time to process.I have used it to have a comparison between the simplest kernel and other more complicated ones. The one which is in the middle is related to 3rd degree Polynomial kernel which is more advanced than the linear one. It uses the non-linear equations for transition inputs to feature space. As a result, it is more time consuming and complicated than the previous kernel but release more reliable results with higher accuracies. Since the more degree the polynomials are, the more complicated and time taking the process will be, I just used the 3rd degree to get to a better performance with regard to complication, time taking, number of training data which is needed and the accuracy. And the downer one is the outcome of the RBF kernel. It is the most
popular kernel among other researches on SAR data. The more usage is due to the RBB kernel’s relevance to the nature of SAR data which is in Gaussian contribution. It is obvious that a Gaussian kernel will be more related to such these data. So the higher performance of algorithm is the result of using this kernel. The results of these processes with use of three-time data and 0.1% of training data are brought in Table 1.
In addition, we used different number of data times with RBF kernel to examine the effects of several time uses in crop classification (Table 2). The percentage of utilized training data was again 0.1%. Multi-temporal data is useful to employ the agricultural different phonological behaviors in classification process. It is obvious that although different kinds of crops may have same scattering in one time, it differs in another time [16].
Table 3 also shows the effect of using different percentage of training data on three-time data using RBF kernel for classification. Despite the fact that using the more training data brings with it the more accuracy results, it is obvious that it is expensive, time consuming and sometimes impossible to use a considerable amount of training data.
Kernel type OA (%) Kappa
RBF 82.28 0.79
Linear 79.12 0.75
3rd deg. polynomial 81.37 0.78 Table 1. Using different kernel functions
# of dates OA (%) Kappa
1 63.34 0.55
2 77.36 0.73
3 82.28 0.79
Table 2. Using different number of dates
% of training data OA (%) Kappa
0.1 82.28 0.79
1 85.52 0.83
Table 3. Using different ratio of training data
Figure 5. crop classification using linear kernel (up), polynomial kernel (middle) and RBF kernel (down)
5. CONCLUSION
This paper presented a comparison study on the performance of different SVM’s kernels for classification of multi-temporal full-polarimetric L-band SAR data in agricultural region. A statistical-based decomposition method, namely, Entropy/Anisotropy/Alpha is applied to filtered orthorectified SAR data of different dates. Then various combination feature time series have been generated using these features. For classification, different SVMs classifiers based on several well-known kernel functions (i.e. RBF, Linear and polynomial) are applied to multi-temporal polarimetric features.
The experimental evaluations demonstrated that the accuracies of RBF-based SVM classifier for various crop types are relatively better than other two kernel functions. In other words, RBF obtains almost 1 and 3 percent better OA compared with linear and 3rd degree polynomial kernels respectively. In addition, RBF kernel shows the best results with respect to the speed of its convergence. It is obtained with regard to the time of process. Indeed, RBF is the most frequently used kernel in optical remote sensing data.
The results also show that using two-data data increases the OA of classification up to 14%, and using another date, i.e. three multi-temporal dataset, increases the overall accuracies about 5% in comparing to two-date imagery. The effect of multi-temporal data in crop classification is much more than even using more training data, which sometimes is expensive and time consuming. As an example, using even ten-fold of training data in each class, just has an increase about 3% in overall accuracy.
For the future works, we planned to use different kinds of polarimetric target decompositions for incoherent classes. Also, it is expected that a future work would be to develop a new kernel accounting for the distribution of the data, such the one which would be due to the presence of speckle in SAR data.
6. ACKNOWLEDGEMENTS
The authors would like to thank the JPL-NASA UAVSAR and SMAPVEX 2012 team for the data used in this research.
REFERENCES
[1] F. T. Ulaby, R. K. Moore, and A. K. Fung, Microwave
Remote Sensing, Active and Passive, vol. 3.
Addison-Wesley, 1986.
[2] H. Skriver, M. T. Svendsen, and A. Thomsen, “Multitemporal C- and L-band polarimetric signatures of crops,” IEEE Geosci. Remote Sens., vol. 37, no. 5, pp. 2413–2429, 1999.
[3] C. G. J. Schotten, W. W. L. Van Rooy, and L. L. F. Janssen, “Assessment of the capabilities of multi-temporal ERS-1 SAR data to discriminate between agricultural crops,” Internaional J. Remote Sens., vol. 16, no. 14, pp. 2619– 2637, 1995.
[4] H. Skriver, F. Mattia, S. Member, G. Satalino, A. Balenzano, V. R. N. Pauwels, N. E. C. Verhoest, and M. Davidson, “Crop Classification Using Short-Revisit Multitemporal SAR Data,” JSTARS, vol. 4, no. 2, pp. 423–431, 2011.
[5] J. J. van Zyl and F. T. Ulaby, “Scattering matrix representation for simple targets,” in in Radar
Polarimetry for Geoscience Applications, F. T. Ulaby
and C. Elachi, Eds. Norwood, MA: Artech House, 1990.
[6] J. S. Lee, D. L. Schuler, R. H. Lang, and K. J. Ranson, “K-distribution for multi-look processed polarimetric SAR imagery,” in Geoscience and Remote Sensing
Symposium, 1994. IGARSS’94. Surface and
Atmospheric Remote Sensing: Technologies, Data
Analysis and Interpretation, International, 1994, vol.
4, pp. 2179–2181.
[7] J. Lee, M. R. Grunes, and E. Pottier, “Quantitative Comparison of Classification Capability : Fully Polarimetric Versus Dual and single polarization SAR,” IEEE Trans. Geosci. Remote Sens., vol. 39, no. 11, pp. 2343–2351, 2001.
agricultural crops in a tropical semi-arid region of Brazil based on L-band polarimetric airborne SAR data,” ISPRS J. Photogramm. Remote Sens., vol. 64, no. 5, pp. 458–463, 2009.
[9] J. S. Lee, M. R. Grunes, T. L. Ainsworth, L. Du, D. L. Schuler, and S. R. Cloude, “Unsupervised classification of polarimetric SAR images by applying target decomposition and complex Wishart distribution,” IEEE Trans. Geosci. Remote Sens., pp. 37(5):2249–2258, 1999.
[10] J.-S. Lee, M. R. Grunes, E. Pottier, and L. Ferro-Famil, “Unsupervised Terrain Classification Preserving Polarimetric Scattering Characteristics,” IEEE TTGRS, vol. 42, no. 4, 2004.
[11] L. E. Pierce, F. T. Ulaby, K. Sarabandi, and M. C. Dobson, “Knowledge-based classification of polarimetric SAR images,” IEEE Trans. Geosci.
Remote Sens., vol. 32, no. 5, pp. 1081–1086, 1994.
[12] H. Skriver, “Land-cover map information from polarimetric SAR using knowledge-based techniques,”
in 3rd Int. Symp. Retrieval of Bio- Geophys.
Parameters SAR Data Land Appl., 2001, pp. 105–110.
[13] H. Skriver, “Crop Classification by Multitemporal C- and L-Band Single- and Dual-Polarization and Fully Polarimetric SAR,” IEEE Trans. Geosci. Remote Sens., vol. 50, no. 6, pp. 2138–2149, 2012.
[14] H. McNairn, T. J. Jackson, G. Wiseman, S. Bélair, A. A. Berg, P. Bullock, A. Colliander, M. H. Cosh, S.-B. Kim, R. Magagi, M. Moghaddam, J. R. Adams, S. Homayouni, E. Ojo, T. Rowlandson, J. Shang, K. Goïta, and M. Hosseini, “The Soil Moisture Active Passive Validation Experiment 2012 (SMAPVEX12): Pre-Launch Calibration and Validation of the SMAP Satellite,” IEEE Trans. Geosci. Remote Sensing, in
press, 2014.
[15] C. Lardeux, P.-L. Frison, J.-P. Rudant, J.-C. Souyris, C. Tison, and B. Stoll, “Use of the SVM Classification with Polarimetric SAR Data for Land Use Cartography,” IEEE Int. Symp. Geosci. Remote Sens., pp. 493–496, Jul. 2006.
[16] B. Yekkehkhany, S. Homayouni, H. McNairn, and A.
Safari, “MULTI-TEMPORAL FULL
POLARIMETRY L-BAND SAR DATA
CLASSIFICATION FOR AGRICULTURE LAND COVER MAPPING,” in IGARSS, 2014, p. 4.
[17] G. Mountrakis, J. Im, and C. Ogole, “Support vector machines in remote sensing : A review,” ISPRS J.
Photogramm. Remote Sens., vol. 1, no. 315, pp. 1–13,