THE IMPACT OF EXCHANGE RATE, FISCAL DEFICIT AND
TERMS OF TRADE ON EXTERNAL DEBT OF PAKISTAN
A Cointegration and Causality Analysis
Asma Awan M. Phil. Scholar
Department of Economics, University of the Punjab, Lahore (Pakistan)
Nabeela Asghar M. Phil. Scholar
Scholar at GC University, Faisalabad (Pakistan)
&
Hafeez ur Rehman (Corresponding author) Chairman/Associate Professor
Department of Economics, University of the Punjab, Lahore-54590 (Pakistan). E-mail: [email protected]
ABSTRACT
The massive debt burden of Pakistan calls for a detailed analysis of trends in the foreign debt levels, its causative factors and implications for economic growth. The present study is an attempt to analyze the relationship between external debt and exchange rate, fiscal deficit and deterioration of terms of trade for the period 1974-2008. Using Johansen approach, the study found significant long-run relationship between external debt and exchange rate and deterioration of terms of trade. The results of the study revealed that fiscal deficit had no significant impact on external debt. In the short-run all the variables failed to establish relationship with external debt. However, the existence of long-run causality was observed and three channels of uni-directional causalities were found actively running from (i) fiscal deficit to external debt, (ii) terms of trade to exchange rate, and (iii) fiscal deficit to terms of trade. Diagnostic test confirmed the validity of the model and CUSUM and CUSUMSQ test revealed the stability of the model.
Keywords: Foreign debt, Exchange rate, Fiscal deficit, Terms of trade. JEL Classification: F 34, F 31, H 62
I. INTRODUCTION
Since 1950s despite of large inflows of external resources in Pakistan its development indicators remained poor in its region. Now-a-days high surge in growth of foreign debt burden has become a critical issue for the policy
makers and a threat to Pakistan’s sovereignty that in turn signals that there is a need to reinvestigate
determinants of foreign debt. As at the end of year 2010, Pakistan’s total stock of outstanding foreign debt was
over $ 50 billion. It reflects high burden of external debt on the economy not only in nominal terms but also in
real terms. Furthermore, IMF has projected that Pakistan’s total stock of external debt will reach at $ 75 billion
in fiscal year 2015-16. Therefore, the question of debt default has generated debates among scholars and it has exerted bad impact on economic growth by creating uncertainty, reducing investment and productivity. Thus, foreign indebtedness has become one of the major economic problems that need to be tackled on priority basis. Literature available on external debt has identified various factors responsible for debt build up in Pakistan. As a result there emerged various economic problems like low economic growth, high fiscal deficit, continuous depreciation of exchange rate, rising external debt servicing, widespread corruption, lack of domestic resource mobilization and reduced share of concessional loans. These problems have hampered economic growth of the country.
of countries, three approaches, namely growth cum debt, debt dynamics and fiscal dimension of debt are available in literature. The growth cum approach lays emphasis on the impact of external debt on economic growth. Debt dynamic approach stresses the comparison of trade performance of a country with the cost of borrowing.1 Fiscal dimension of debt compares debt with public revenue.2 For assessing the debt capacity of Pakistan it can be observed that its growth rate and export performance never have been much impressive.
Furthermore, Pakistan’s inability to generate revenue has aggravated the problem of external debt.
The analysis of past trend of debt accumulation of Pakistan revealed that there was a substantial rise in the inflow of foreign resources during 1950s and 1960s. As a result total foreign debt had increased from 500 million dollars during 1950s to 2700 million dollars at the end of 1960s. During 1972-77, Pakistan received foreign debt for financing larger oil import bills. The total external debt of Pakistan reached at 8625 million dollars by the end of 1970s. Pakistan received hard loans and short-term loans for balance of payments support
and the country’s total external debt reached to 16885 million dollars by the end of 1980s. The number of
factors like increased reliance on short-term loans, sanctions imposed on Pakistan after nuclear test, rapid turn over of governments, large accumulated debt servicing obligations, poor governance, and rising corruption forced the country to receive heavy doses of foreign loans. Pakistan external debt had reached at unsustainable level during 1990s. This alarming situation called for immediate measures for reducing the dependence on foreign loans. As a step towards this end debt management office was established in the country. The key task of this office was monitoring debt and implementing debt strategy approved by the Government of Pakistan.
During first half of 2000s, reduction in external debt burden was observed due to significant debt rescheduling
by Paris and London clubs, debt management and increased inflow of worker’s remittances after 9/11 which in
turn raised foreign exchange reserves. Because of Pakistan’s support to US in war against terrorism heavy inflow of foreign aid was observed during 2001-2005. During the period of 2006-2010 Pakistan received heavy loans from IMF that forced the country to face the danger of both liquidity and solvency problems. The rising burden of debt calls for immediate formulation and implementation of appropriate trade and saving policies for a significant reduction of foreign dependence.
Besides external debt, external debt servicing also causes number of problems as it crowds out public finance and results in non-availability of enough funds for the other affairs of the economy. It also imposes severe burden on the BOP problem. Historical statistics of external debt servicing (long and medium term external debt) as a percentage of exports receipts indicated high burden of external debt. During 1960s, on average, external debt servicing as a percentage of exports receipts was 28.98% per annum, during 1970s it was 23.11% per annum, during 1980s it was 25.52%, during 1990s it was 23.47% whereas from 2000 to 2004 on average, it was 16.14% per annum. This calls for prudent and vigilant debt management in order to mitigate adverse effects of accumulated external debt and its servicing on economy.
The issue of severe foreign indebtedness of developing countries attracted a lot of attention of the academia and policy makers. As a result research work had brought up various causes that are responsible for high indebtedness of the developing countries like Pakistan. These causes were identified as poverty, fiscal deficit, unfavourable balance of payments, capital flight, negative impact of foreign loans on domestic savings, corruption and poor governance. Keeping in view the significance of foreign debt build up the main objective of the study is to provide conceptual framework and detailed analysis of the problem of foreign debt faced by Pakistan economy. In this regard, this study is an attempt to investigate the impact of fiscal deficit, depreciation and deterioration of terms of trade on the rising level of external debt.
The study is organized as follows: following the introduction, section II presents review of literature, section III contains research design, section IV establishes empirical results and discussions and section V concludes.
1
II. REVIEW OF LITERATURE
During the 1980s a severe foreign indebtedness and low level of economic growth were observed in many less developed countries. There is a wide range of causes of debt crisis of the developing countries which attracted the attention of academia and policy makers. Therefore, a lot of literature is available on the issue of external indebtedness of the developing countries. These studies on external debt have revealed various factors that were held responsible for high indebtedness of the developing countries.3
Eichengreen and Portes (1986) find openness and export instability responsible for foreign indebtedness of the developing countries in 1930s. Ferraro and Rosser (1994) attempt to explain causative factors that are responsible for accumulation of foreign debt of third world countries.4 They conclude that poverty, oil price shocks of 1973 and 1979, sharp rise in interest rates and deterioration in terms of trade are key determinants of third world foreign debt.5
Stambuli (1998) identifies the responsible channels for the Third World debt crisis. According to him high interest rates, appreciation of the US dollar, oil price shocks, fungibility of funds, low export receipts and poor terms of trade are possible channels of foreign indebtedness.6
Tiruneh (2004) uses panel data approach and finds poverty, debt servicing, foreign exchange gap, capital flight and income instability as main causes of foreign indebtedness of developing countries during 1980s and 1990s. He points out that sluggish economic growth, income instability, reliance on external loans to finance import bills and past debt service payments are responsible for their indebtedness.
Hasan (1999) concludes that mounting burden of foreign debt is mainly due to current account deficits and patterns of financing in Pakistan. Ishfaq and Chaudhry (1999) find that continuous fiscal deficit over the years have caused foreign indebtedness accompanied by the burden of debt servicing. They argue that fiscal deficit and foreign debt can be considered as cause and effect for each other. Higher deficits create higher loan requirements which further enhance debt burden of a country.
Kemal (2001) finds that balance of payments and fiscal deficit are major determinants of foreign indebtedness in Pakistan. He points out that for financing deficits borrowed funds are used which adds fuel to the debt burden in Pakistan. Bilquees (2003) concludes that growth in external debt with respect to exchange rate changes, primary budget deficits, and interest rate are responsible for debt accumulation in Pakistan.
Mohey-ud-din (2005) concludes that foreign aid is a major factor responsible for growth of foreign debt because aid is substituted for domestic savings in Pakistan. Zafar et al. (2008) examine the implications of trade
liberalization on Pakistan’s foreign debt burden from 1972 to 2007 by employing recent econometric
developments. They find that trade liberalization is a causative factor of accumulation of external debt in Pakistan.
After reviewing the existing literature related to the issue of foreign indebtedness it can be concluded that there are many factors responsible for the accumulation of foreign debt of developing countries like Pakistan. These factors vary with the changing economic and political conditions of the developing countries. The economic and political conditions of Pakistan have changed drastically during the past two decades. There is a need to identify
3Several developing countries faced high accumulation of external debt during 1980’s due to oil price shock,
low growth rates, heavy reliance on foreign borrowings due to low foreign exchange earnings, current account deficit and deteriorating terms of trade. Gulf oil crisis of 1990-91 also contributed to heavy external borrowing.
4
Algeria, Argentina, Bolivia, Brazil, Bulgaria, Congo, Cote d’Ivoire, Ecuador, Mexico, Morocco, Nicaragua, Peru, Poland, Syria and Venezuela.
5
UNCTAD (United Nations Conference on Trade and Development) has calculated that sharp rise in interest rates during 1976-79 and 1980-82 added $41 billion to the third world external debt (Inter American Development Bank, 1985).
6
the factors responsible for high indebtedness of the country. This study is an attempt to identify the causative factors of high indebtedness of Pakistan by using recent econometric developments with larger data set. On the basis of the results, the study highlights the policy options that may become helpful for the government in reducing the dependence on foreign loans and creating improved conditions for development.
III. DATA DESCRIPTION AND MODEL SPECIFICATION
This study uses annual data for analyzing the relationship between fiscal deficit, depreciation, terms of trade and external debt for the period 1972-2008. Data has been collected from Pakistan Economic Survey, various issues, and Federal Bureau of Statistics.
MODEL SPECIFICATION
To analyze the relationship between external debt and its causative factors (nominal exchange rate, fiscal deficit and terms of trade) various forms have been tested and the most appropriate form, i.e. log linear form, for the variables was specified as:
ln EDt = β0 + β1 ln EXR1t + β2 ln FD2t + β3 ln TOT3t + εt
(+) (+) (–)
Where
EDt = External Debt (in $ millions)
EXRt = Nominal Exchange Rate
FDt = Consolidated Fiscal Deficit (in $ millions)
TOTt = Terms of Trade (2000-01=100)
All variables are reported in log form and theoretical expected signs of the variables are reported in the parentheses.
Growth of external debt and nominal exchange rate are expected to be positively related to each other. It may be due the reason that Pak Rupee had been depreciated for the last several years. Another possible argument in this regard is that the domestic currency had become weaker due to depreciation that discouraged foreign investment and forced the country to rely on foreign borrowing.
Relationship between fiscal deficit and external debt is also direct and positive one. The existence of high fiscal deficit, due to lack of domestic resource mobilization in Pakistan, leads to the problem of accumulation of external debt. Islam (1998), Aqeel and Nishat (2008) confirm that fiscal deficit has caused current account deficit in Pakistan.
The expected sign of the terms of trade and foreign debt burden is negative which means that deterioration in
terms of trade leads to high indebtedness. Pakistan’s terms of trade have been continuously deteriorated over
time because of the country’s dependence on the export of primary and low value added products. Deterioration
in terms of trade means less foreign exchange earnings. In the absence of proper domestic resource mobilization the country has to depend on the external resources.
ECONOMETRIC METHODOLOGY 1. Unit Root Tests
inferences and hence it is very important that series should be stationary.7 The study uses two unit root tests namely ADF and Ng-Perron tests for observing the order of integration of the variables.
Ng-Perron test is considered to be more powerful because Ng-Perron (2001) uses generalized least square detrended procedure to develop four efficient test statistics for overcoming the problems of power distortions and poor size related to ADF. According to Dejong et al. (1992), Ng-Perron (2001) and Harris (2003), ADF is not reliable test in case of small sample because it seems to accept the null hypothesis when actually it is false and over reject when actually it is true.
2. Cointegration Test
The study uses Johansen’s and Juselious (1990) cointegration approach for observing the long-run relationship among the variables. Before applying this approach there is a need to decide optimal lag length in order to have gaussian error terms (i.e. free from autocorrelation, heteroskedasticity and normally distributed). The Johansen and Juselius approach of cointegration is based on VAR model which can be written as:
t m
k
k t k
t
W
W
1 Where Wt is a j-vector of four variables used in the study which should be integrated of order 1,
is a j-vectorof constants and
t is a j-vector of white noise residuals having zero mean and constant variance.The above VAR model can be rewritten in the following first difference form:
t t
m
k
k t k
t
W
W
W
11
1
Where Wt represent vector of four variables,
t is a white noise error term. k is a lag length.
is known as impact matrix. The impact matrix is 4*4 as we have four variables in Wt. The impact matrix provides information related to long run relationship. The rank(r) of impact matrix will be the number of co-integrating vectors. Johansen (1995) introduced two likelihood ratio methods in order to investigate co-integrating vectors which are illustrated below.3. Trace Statistics (
trace(
r
)
)
jr l
l
trace
r
N
1
)
1
ln(
)
(
Where N is the number of observations, r is the number of co-integrating vectors, j is the number of variables
and
'
s
are the eigen values.The null and alternative hypotheses of trace statistics are as follows.
H0: number of C.I. ≤ r against H1: number of C.I > r
Where C.I (co-integrating relations)
Maximal Eigen Value Test Statistics (
m(
r
)
))
1
ln(
)
1
,
(
r1m
r
r
N
The null and alternative hypothesis of maximal eigen value test statistics are as follows:
7
H0: number of C.I. = r against H1: number of C.I = r + 1
4. Vector Error Correction Model (VECM)
According to Engle and Granger (1987) if two series are co-integrated of order one, i.e. I(1), then there must exists VECM representation in order to govern joint behavior of the series of the dynamic system. In VECM specification, short run as well as long run adjustments are made. VECM also provides information about the causal factors that may affect variables. Pre-requisites for the application of VECM are that all variables should be integrated of order 1 and there exists at least one co-integrating relationship among the variables. VECM specification in case of our model related to determinants of foreign debt is as follows.
)
1
(
ln
ln
ln
ln
ln
1 1 1 1 , 4 , 141 1 1
, 3 , 13 , 2 , 12 . 1 , 11 10 1
p i t t i t i p i p i p i i t i i t i i t i tECT
TOT
FD
EXR
ED
ED
)
2
(
ln
ln
ln
ln
ln
1 2 1 2 , 4 , 241 1 1
, 3 , 23 , 2 , 22 . 1 , 21 20 2
p i t t i t i p i p i p i i t i i t i i t i tECT
TOT
FD
EXR
ED
EXR
)
3
(
ln
ln
ln
ln
ln
1 3 1 3 , 4 , 341 1 1
, 3 , 33 , 2 , 32 . 1 , 31 30 3
p i t t i t i p i p i p i i t i i t i i t i tECT
TOT
FD
EXR
ED
FD
)
4
(
ln
ln
ln
ln
ln
1 4 1 4 , 4 , 441 1 1
, 3 , 43 , 2 , 42 . 1 , 41 40 4
p i t t i t i p i p i p i i t i i t i i t i tECT
TOT
FD
EXR
ED
TOT
Where“Δ” is the first difference operator, “P” is the lag length, and “ECTt-1” is the lagged error correction term. The term ECTt-1 shows degree of disequilibrium levels of the variables in the previous period. Thus above specification of the VECM states that change in a variable depends on other variables, on its own past values as well as on the degree of disequilibrium among the variables. The term ECTt-1 should be negative and statistically significant in order to have stable long run equilibrium path.
5. VECM Based Causality
Granger (1988) states in Granger Representation Theorem that if two variables are stationary of order one and co-integrated then either first variable granger cause second variable or second variable granger cause first variable. In this study multivariate granger causality test based on VECM is utilized in order to capture all possible channels of the causality among variables. By adding error correction term in vector error correction model, it provides an additional channel for long run causality which is ignored by Sims and Granger standard causality tests. Long run causality is confirmed through the significance of the coefficient of lagged error term
6. Toda Yamamoto Causality
According to Reimers (1992), Toda and Philips (1993) and Zapata and Rambaldi (1997), causality inferences constructed from first differenced VAR models are unreliable and can lead to incorrect results because these models are very sensitive to the presence of nuisance parameters and also demands preliminary test of stationarity and cointegration.8 The pre-test biases can be severe and carried over onto the causality test therefore in order to address this problem an alternative approach proposed by Toda and Yamamoto (1995) is robust for stationarity and cointegration properties. In order to check causal relationship among hypothesized determinants of debt-build up in the spirit of Toda-Yamamoto causality following system of equations is formulated and equations are jointly estimated by SUR (seemingly unrelated regression) technique because Rambaldi and Doran (1996) shows that because of SUR estimation, Wald test experiences an improvement in efficiency. t d k i i t i d k i i t i d k i i t i d k i i t i
t
ED
EXR
FD
TOT
ED
1 1 1 1 1 1 1 1 1 1 max max max maxln
ln
ln
ln
ln
t d k i i t i d k i i t i d k i i t i d k i i t i
t
ED
EXR
FD
TOT
EXR
2 1 2 1 2 1 2 1 2 2 max max max maxln
ln
ln
ln
ln
t d k i i t i d k i i t i d k i i t i d k i i t i
t
ED
EXR
FD
TOT
FD
3 1 3 1 3 1 3 1 3 3 max max max maxln
ln
ln
ln
ln
t d k i i t i d k i i t i d k i i t i d k i i t i
t
ED
EXR
FD
TOT
TOT
4 1 4 1 4 1 4 1 4 4 max max max maxln
ln
ln
ln
ln
7. Diagnostic Tests
Diagnostic tests are utilized for checking the validity of the fitted model. In this study VECM based diagnostic tests are reported. VEC residual serial correlation Langragian multiplier test is used for investigating possible serial correlation in the error term. The null hypothesis for this test is reported below:
H0: E (
t,
tq) = 0 for t ≠ q, q = 1, 2, ….., pVEC residual normality test is carried out in order to investigate whether residuals are normally distributed or not? The null hypothesis for this test is reported below:
H0: residuals are normal.
VEC residual heteroskedasticity test is applied in order to check whether there is heteroskedasticity or not? The null hypothesis for this test is reported below:
H0: variance of the residuals is constant (absence of heteroskedasticity).
8. Stability Tests
Brown et al. (1975) recommended two tests for parameter constancy.9 These tests are based on recursive residuals and known as CUSUM and CUSUMSQ test. Plot of recursive residuals provides useful insights for the analysis of parameter variations. They are also used to test null hypothesis of parameter constancy over the sample. The CUSUM test depends on cumulative sum of recursive residuals. In visual plot of CUSUM test 5
8
Nuisance parameters are itself of no primary interest but used in the analysis of those parameters
which are of particular interest. They are also called as intermediate parameters.
9
percent critical lines and cumulative sum both are plotted. If the cumulative sum crosses the 5 percent critical lines it means parameters are not stable.
The second test to check parameter constancy is CUSUMSQ test which is based on cumulative sum of squared recursive residuals. In CUSUMSQ test squared residuals are plotted against time and critical lines. Just like CUSUM test, in CUSUMSQ test the significance of deviation from mean value line is checked by parallel critical lines around the mean value. A movement outside the lines indicates instability of the regression parameters.
IV. EMPIRICAL RESULTS AND DISCUSSION STATIONARITY RESULTS OF THE VARIABLES
A summary of the unit root test regarding order of integration based on ADF is presented in Table 1.
Table 1
ADF Test Statistic Results 1974-2008
Variables Levels/ First Difference ADF test statistic
Without trend With trend
LnED Level –2.54 –1.85
LnEXR Level –0.45 –1.96
LnFD Level –1.39 –2.25
LnTOT Level –0.25 –3.18
∆ LnED First Diff –5.38* –6.01*
∆ LnEXR First Diff –3.82* –3.73**
∆ LnFD First Diff –7.34* –7.17*
∆ LnTOT First Diff –6.70* –7.34*
Mac-Kinnon Critical Values
1℅ -3.64 -4.26
5℅ -2.95 -3.55
NOTE: *shows significance at 1 percent level, **show significant at 5 percent level whereas ∆ is used as difference operator.
The ADF results presented in Table 1 revealed that all the variables were non-stationary at level. However, stationary property was found in first differencing of the variables. This indicated that all the variables were I(1). For further confirmation Ng-Perron test was employed and test results are reported in Table 2.
Table 2
Ng-Perron Test Results 1974-2008
Variables MZα MZt MSB MPT
Deterministic terms Deterministic terms Deterministic terms Deterministic terms
c c,t c c,t c c,t c c,t
Ng-Perron in Levels
LnED 0.66 –2.41 0.49 –0.98 0.74 0.40 0.38* 33.1
LnEXR 0.27 –2.41 0.18 –0.99 0.67 0.41 31.0 33.7
LnFD –0.83 –8.12 –0.35 –2.01 0.42 0.24 13.5 11.2
LnTOT –4.39 –8.51 –1.04 –1.89 0.23*** 0.22 6.19 11.2
Ng-Perron in First Differences
∆LnED –17.4* –16.6*** –2.92* –2.7*** 0.16* 0.16** 1.49* 6.08***
∆LnEXR –12.9* –14.05 –2.54** –2.62 0.19** 0.18 1.89** 6.64***
∆LnFD –7.8*** –11.5 –1.94*** –2.39 0.24*** 0.20 3.24*** 7.91
Critical valuesa
1% –13.8 –23.8 –2.58 –3.42 0.17 0.14 1.78 4.03
5% –8.10 –17.3 –1.98 –2.91 0.23 0.17 3.17 5.48
10% –5.70 –14.2 –1.62 –2.62 0.27 0.18 4.45 6.67
NOTE: *denotes significance at 1%, ** denotes significance at 5% and *** denotes significance at 10% level.
a Asymptotic critical values taken from Ng-Perron (2001, Table 1).
c denotes constant and c, t denotes constant and trend.
The results revealed that all variables were not stationary at their levels except external debt and terms of trade but their stationarity at level was confirmed only by one test of Ng-Perron whereas first difference stationarity of the variables was supported by all four test statistics therefore it can be decisively concluded that all variables were integrated of order 1, i.e. I(1).
COINTEGRATION RESULTS
Since stationarity results confirmed that all variables were integrated of order 1 therefore variables might have long-run relationship. Before identifying the number of co-integrating vectors we first applied VAR test in order to determine the optimal lag length. The Schwartz Baysian Criterion statistic indicated that one year lag was the optimal lag length for Johansen Cointegration Test. Table 3 reports cointegration results.
Table 3
Johansen and Juselius Cointegration Test Results 1974-2008 Part A Trace Statistic
Null Hypothesis
Alternative Hypothesis
Test statistic Critical Value (5%) Probability**
Ho: r ≤ 0 HA: r > 0 65.69* 47.85 0.00
Ho: r ≤ 1 HA: r > 1 38.09* 29.79 0.00
Ho: r ≤ 2 HA: r > 2 14.39 15.49 0.07
Ho: r ≤ 3 HA: r > 3 0.18 3.841 0.66
Part B Maximal Eigen Value Statistic Null
Hypothesis
Alternative Hypothesis
Test statistic Critical Value (5%) Probability**
Ho: r = 0 HA: r = 1 27.59* 27.58 0.04
Ho: r = 1 HA: r = 2 23.70* 21.13 0.02
Ho: r = 2 HA: r = 3 14.20 14.26 0.05
Ho: r = 3 HA: r = 4 0.186 3.84 0.66
Part C Normalized Co-integrating Vector
LnED Constant LnEXR LnFD LnTOT
1.00 –5.29 –0.79 –0.02 0.38
t-statistic – [9.48]* [0.18] [1.72]***
NOTE: Variables included in the co-integrating vector are ED, EXR, FD, and TOT. ** P-values are taken from MacKinnon-Haug-Michelis (1999). In part c, * denotes significance at 1%, ** denotes 5% and *** denotes at 10% level.
Both test
trace(
r
)
and
m(
r
)
indicated two significant co-integrating vectors as null hypothesis r ≤ 0 and r ≤ 1 in case of trace statistic and null hypothesis r = 0 and r = 1 in case of maximal eigen value test were rejected because both test statistics were greater than their respective critical values. With this evidence it can beinterpreted that Pakistan’s external debt and exchange rate, fiscal deficit and terms of trade were moving
normalized by external debt. The results of the estimated long-run external debt function are reported in equation form:
t t
t
t
EXR
FD
TOT
ED
5
.
29
0
.
79
ln
0
.
02
ln
0
.
38
ln
ln
t-values (9.48) (0.18) (–1.72)
It was observed that variables had their expected signs and they were statistically significant too except fiscal deficit however their significance levels varied from variable to variable.
With regard to long run parameter of exchange rate, it can be concluded that exchange rate was positively related to growth in external debt. Increase in exchange rate means depreciation of the Pak rupee. This variable was highly significant with an elasticity of 0.79 which indicated that 1% rise in exchange rate, on average, led to 0.79% increase in external debt burden in the long run. The result is consistent with the finding of Bilquees (2003) who found that depreciation had increased debt burden in Pakistan.
The positive relationship between exchange rate and external debt in the context of Pakistan economy was due to the continuous depreciation of Pak rupee over time. As a result cost of external debt obligation increased which in turn increased demand for external borrowing. Furthermore, because of depreciation domestic currency became weaker which discouraged foreign investment raised the demand for external debt for financing the ongoing and new projects in the country.
With regard to long run parameter of fiscal deficit, the study found that fiscal deficit resulted in accumulation of external debt but surprisingly long-run parameter of fiscal deficit was not significant therefore no valid inferences could be drawn from this result.
However, long-run parameter of terms of trade was marginally significant at 10 percent significance level and was negatively associated with the external debt having coefficient 0.38 indicating 1% decrease (deterioration) in terms of trade, on average, led to 0.38% increase in growth of external debt in the long-run. Pakistan’s terms of trade had been deteriorating for the last several years. As a result there emerged trade deficit which had been increasing over time and was also responsible for the accumulation of debt in Pakistan.
VECTOR ERROR CORRECTION MODEL RESULTS
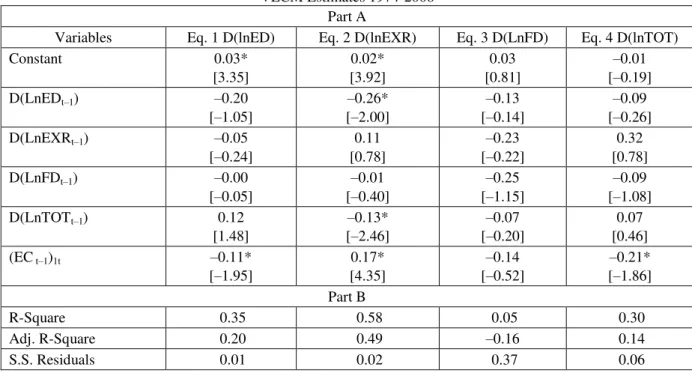
Table 4 reports VECM results in two parts. Part A reports results of four equations used for the short run and long run dynamics and part B reports summary statistics.
Table 4
VECM Estimates 1974-2008 Part A
Variables Eq. 1 D(lnED) Eq. 2 D(lnEXR) Eq. 3 D(LnFD) Eq. 4 D(lnTOT)
Constant 0.03*
[3.35]
0.02* [3.92]
0.03 [0.81]
–0.01 [–0.19]
D(LnEDt–1) –0.20
[–1.05]
–0.26* [–2.00]
–0.13 [–0.14]
–0.09 [–0.26]
D(LnEXRt–1) –0.05
[–0.24]
0.11 [0.78]
–0.23 [–0.22]
0.32 [0.78]
D(LnFDt–1) –0.00
[–0.05]
–0.01 [–0.40]
–0.25 [–1.15]
–0.09 [–1.08]
D(LnTOTt–1) 0.12
[1.48]
–0.13* [–2.46]
–0.07 [–0.20]
0.07 [0.46]
(EC t–1)1t –0.11*
[–1.95]
0.17* [4.35]
–0.14 [–0.52]
–0.21* [–1.86] Part B
R-Square 0.35 0.58 0.05 0.30
S.E. equation 0.02 0.01 0.12 0.04
F-statistic 2.39 6.20 0.25 1.93
Mean Dependent 0.02 0.02 0.02 0.01
S.D. Dependent 0.02 0.02 0.11 0.05
NOTE: * denotes significance of the variable and t–statistic values are reported in brackets
From the results of equation 1, it can be deduced that no regressor was establishing significant short-run relationship with the external debt but the (ECt–1)1t was significant and carried negative sign that indicated the existence of significant long-run relationship among external debt and its determinants. The coefficient of (ECt-1)1t was –0.11 which showed low speed of adjustment towards long-run equilibrium. This indicated whenever there was any disturbance in the system in the long-run, in every short period only 11% correction to disequilibrium would take place. With respect to equation 2, the coefficient of error correction term of exchange rate was statistically significant but it carried a positive sign which indicated that in case of any disturbance there would be divergence from the equilibrium making the whole system helpless in achieving equilibrium position.
The coefficient of error correction term of equation 3 was insignificant but correctly signed which showed absence of significant long-run relationship between the variables. However, the long-run relationship existed in equation 4 as coefficient of error correction term was correctly signed and significant.
VECM BASED GRANGER CAUSALITY RESULTS
Since our variables were co-integrated, therefore there existed causal relationship at least in one direction. Long-run causality depends on the significance of lagged error term and significant short Long-run causality depends on
overall significance of Σχ2
as well as individual significance of lagged independent variable. VECM based granger causality results are presented in Table 5.
Table 5
VECM Based Granger Causality Estimates 1974-2008 Dependent
Variables
Independent Variables (EC t–1)1t Σχ2
DLnEDt DLnEXRt DLnFDt DLnTOTt
2
(
i= 0)t
(
0
)
DLnEDt – 0.059 0.002 2.20 [–1.95]* 2.32
DLnEXRt 4.01* – 0.166 6.05* [4.35]* 11.70*
DLnFDt 0.02 0.05 – 0.042 [–0.52] 0.115
DLnTOTt 0.07 0.62 1.18 – [–1.86]* 2.28
Critical Values of
22
(1) at 1% = 6.643,
2(1) at 5% = 3.841,
2(1) at 10% = 2.705,2
(3) at 1% = 11.344,
2(3) at 5% = 7.814,
2(3) at 10% = 6.251NOTE: * indicates significance of the variable.
The results showed that in case of our first dependent variable D(lnEDt) lagged residual term was statistically significant that indicated stable long-run relationship among dependent and independent variables. By significant long-run relationship we mean that variables may not drift too much and in the long-run convergence is achieved. Statistical significance of lagged error term was confirmed through t-statistic. Insignificant Σχ2 is an indication of the absence of short-run causality.
In case of our second dependent variables, i.e. D(lnEXRt) both (ECt–1)1t and Σχ2 were statistically significant but
The coefficient of lagged residual term of the dependent variable D(lnFD) carried negative sign but was statistically insignificant showing the absence of long-run relationship between the variables. Furthermore, the
statistically insignificant Σχ2
showed the absence of short-run relationship between the variables.
The results showed that the coefficient of lagged residual term of the dependent variable D(lnTOT) was marginally significant at 10%, confirming the existence of long-run relationship between the variables while on
the other hand, statistically insignificant Σχ2
led to conclude the absence of short-run causality.
TODA YAMAMOTO CAUSALITY RESULTS
Granger (1988) pointed out that the existence of cointegrating relation means at least one direction of causation for maintaining the presence of long-run relationship. The direction of causation helps the policy makers in formulating effective policies for the country. For this reason the present study uses Toda Yamamoto Causality test for observing the causal relationship between the dependent and independent variables.
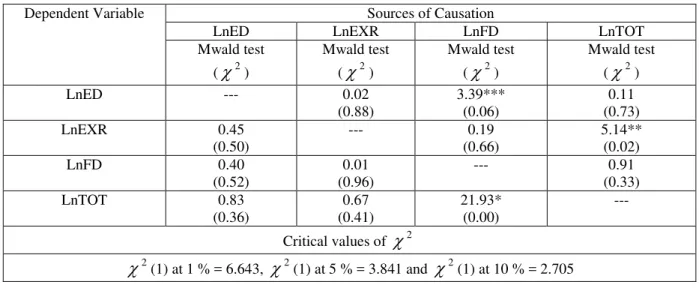
Table 6
Toda Yamamoto Causality Estimates 1974-2008 (Mwald Causality Test)
Dependent Variable Sources of Causation
LnED LnEXR LnFD LnTOT
Mwald test (
2)Mwald test (
2)Mwald test (
2)Mwald test (
2)LnED --- 0.02
(0.88)
3.39*** (0.06)
0.11 (0.73)
LnEXR 0.45
(0.50)
--- 0.19
(0.66)
5.14** (0.02)
LnFD 0.40
(0.52)
0.01 (0.96)
--- 0.91
(0.33)
LnTOT 0.83
(0.36)
0.67 (0.41)
21.93* (0.00)
---
Critical values of
22
(1) at 1 % = 6.643,
2(1) at 5 % = 3.841 and
2(1) at 10 % = 2.705Note: * denotes significance at 1%, **denotes significance at 5% and *** denotes significance at 10%. Probability values are given in parenthesis.
Table 6 presents statistic of modified wald test along with probabilities and critical values of Chi-square. Selection of optimal lag length of the model was based on Schwartz Baysian criterion and maximal order of integration was confirmed through Ng-Perron test. Since k = 1 and dmax = 1 therefore VAR was estimated with 2 lags by SUR estimation method. But wald test was applied only on first “k” coefficients in the model to check linear restrictions on the parameters.
The results of causality test showed that fiscal deficit consistently Granger caused external debt in Pakistan but there was no evidence on the reverse causation. This causal relationship was marginally significant, which showed that fiscal deficit does matter in forecasting of foreign debt because whenever fiscal deficit occurred (revenues < expenditures), government borrowed to fill this gap and when this short fall occurred again and again over the number of years debt of the government increased. This result is in contrast to VECM based causality where we found evidence of no causality.
DIAGNOSTIC TESTS RESULTS
Table 7
Diagnostic Test Results 1974-2008
Test statistic
Prob.
Conclusion
LM-stat (14.474)
0.56
Residuals are free from serial correlation.
Jarque-Bera (9.48)
0.30
Residuals are normally distributed.
Chi-square (122.72)
0.41
There is no hetro-skedasticity.
Since probability values were greater than 0.05 in diagnostic tests, it was concluded that residuals were not serially correlated and were normally distributed and also homoskedastic which in turn confirmed the validity of the fitted model. This implied that estimated parameters of the model were accurate and could provide useful insights for the implication of economic policy.
CUSUM AND CUSUM SQUARE TEST OF STABILITY Figure 2
CUSUM and CUSUM Square Plots
-20 -15 -10 -5 0 5 10 15 20
1980 1985 1990 1995 2000 2005
CUSUM 5% Significance
-0.4 0.0 0.4 0.8 1.2 1.6
1980 1985 1990 1995 2000 2005
CUSUM of Squares 5% Significance
The plots of both the CUSUM and CUSUMSQ did not cross the critical value line, which was an indication of the stability of estimated parameters and hence these parameters could be used for policy purposes safely.
V. CONCLUSION AND POLICY PRESCRIPTIONS
The main objective of the present study was to analyze the relationship between external debt, exchange rate, terms of trade and fiscal deficit for Pakistan over the period 1974-2008. After confirming stationarity through ADF and Ng-Perron tests, Johansen and Juselius cointegration test was used to investigate long-run relationship among foreign debt and exchange rate, fiscal deficit and terms of trade. VECM was utilized for exploring the short-run and long-run relationship. Toda Yamamoto causality test was used to check causal relationship between the variables included in the model.
Key findings of the study pointed out that depreciation of domestic currency and deterioration in terms of trade are significant factors responsible for foreign indebtedness in Pakistan. The study found positive relationship between foreign debt and fiscal deficit as expected but insignificant coefficient apparently indicates that no valid conclusion can be drawn regarding the relationship between foreign debt and fiscal deficit in the context of Pakistan economy. In short-run none of the variables has established relationship with foreign debt. VECM results show significant long-run causality among the variables. Toda Yamamoto causality test has identified three significant uni-directional causalities. Diagnostic test revealed absence of serial correlation, heteroskedasticity and non-normality. Stability of the proposed model was also confirmed by CUSUM and CUSUMSQ.
Keeping in view the results of the study, following policy prescriptions may be helpful for policy makers in curbing foreign indebtedness of Pakistan. Government of Pakistan should follow the policy of trade and not aid strictly. Depreciation of exchange rate and excessive borrowing are most conspicuous distressing and perplexing economic problems and these must be tackled on priority basis. Exchange rate stability is required for minimizing the adverse effects of exchange rate volatility on burden of external debt. For reducing the dependence on foreign debt, effective steps need to be taken for mobilizing the domestic resources. Furthermore, government should play its role in providing an environment that may encourage private investment and foreign direct investment. There is a need to improve performance of external sector by increasing production of value added products.
For overcoming the problems emerging in the economy due to increasing external debt there is a need to have national consensus among major political parties of Pakistan on an irreversible or unchangeable economic programmes or policies that must heavily depend on self-reliance at least for next ten years. Beside this, promotion of transparency, accountability and mitigation of rising trend of corruption are required in order to ensure good governance which is indispensable for accelerating economic growth through the efficient and proper use of external resources. Furthermore, sustained efforts on economic, social and institutional fronts are required to remove all the bottlenecks that have resulted in high growth of foreign debt in Pakistan.
REFERENCES
1. Agenor et al. (1996), Development Macro Economics. Princeton University Press, Princeton.
2. Aqeel, A & Nishat, M. (2000), The Twin Deficit Phenomenon: Evidence for Pakistan. The Pakistan Development Review, 39 (4): pp. 535-550
3. Bevilaqua, A. S. (1994), Dual Resource Transfers and the Secondary Market Price of Developing Countries External Debt. Mimographed, Washington D.C. IMF.
4. Bilquees, F. (2003), An Analysis of Budget Deficits, Debt Accumulation, and Debt Instability. The Pakistan Development Review, 42:3 pp. 177-195.
5. Brown, R. L., Durbin, J. & Evans, J. M. (1975), Techniques for testing the constancy of regression relationship over time. Journal of Royal Statistical Society, Volume 37, pp. 149-163.
6. Brown, R. L., Durbin, J. & Evens, J. M. (1975), Techniques for Testing the Constancy of Regression Relationships over Time. Journal of the Royal Statistical Society, Series B, 35, pp. 149-192
7. Dejong, D. N., Nankervis, J. C. & Servin, N. E. (1992), Integration versus Trend Stationarity in Time Series with a Unit Root. Econometrica, 60, pp. 423-33.
8. Dickey, D. & Fuller, W. A. (1979), Distribution of the Estimates for Autoregressive Time Series with a Unit Root. Journal of American Statistical Association, 74, pp. 427-431.
9. Dittus, P. (1989), The Budgetary Dimension of the Debt Crises in Low Income Sub-Saharan Countries. Journal of Theoretical and Institutional Economics, 145 (2).
10. Eichengreen, B. & Portes, R. (1995), Debt and Default in the 1930’s: Causes and Consequences. National Bureau of Economic Research. Working Paper no 1772.
12. Ferraro, V. & Rosser, M. (1994), Global Debt and Third World Development. World Security:
Challenges for a New Country. New York: St. Martin’s Press, pp. 332-335
13. Government of Pakistan, Economic Survey (Various issues), Finance Division, Economic Advisor’s Wing, GOP, Islamabad.
14. Granger, C. W. J. & Newbold, P. (1974), Spurious Regression in Econometrics. Journal of Econometrics, 2, pp. 111-120.
15. Granger, C. W. J. (1988), Some Recent Developments in a Concept of Causality. Journal of Econometrics, Vol 39, pp. 199-211
16. Harris, R & Sollis, R. (2003), Applied Time Series Modelling and Forecasting. West Sussex: Willey. 17. Hasan, P. (1999), Pakistan’s Debt Problem: Its changing Nature and Growing Gravity. The Pakistan
Development Review, 38:4 part 1, pp. 435-470
18. Husain, I. (2003), Economic Management in Pakistan. Oxford University Press, Oxford.
19. Ishfaq, M. & Chaudhary, M. A. (1999), Fiscal Deficit and Debt Dimensions of Pakistan. The Pakistan Development Review, 38: 4 Part II, pp.1067-1080
20. Islam, M. (1998), Brazil’s Twin Deficits: An Empirical Examination. Atlantic Economics Journal. 26(2), pp. 121-129
21. Johansen, S. & Juselius, K. (1990), Maximum Likelihood Estimation and Inference on Co-integration with Application to the Demand for Money. Oxford Bulletin of Economics and Statistics, 52. pp. 169-210.
22. Johansen, S. (1995), Likelihood Based Inference in Cointegrated Vector Autoregressive Models. Oxford University Press, Oxford.
23. Kemal, A. R. (2001), Debt Accumulation and its Implications for Growth and Poverty. The Pakistan Development Review, 40:4 pp. 263-281
24. Kharas, H. (1981), Constrained Optimal Foreign Borrowing by Less Developed Countries, World Bank Domestic Finance Study 75, Washington D.C.: World Bank.
25. McDonald, D. C. (1982), Debt Capacity and Developing Country Borrowing: A Survey of the Literature. IMF Staff Papers 29(4).
26. Mohey-ud-din, G. (2005), Impact of Foreign Aid on Economic Development in Pakistan (1960-2000). Munich Personal RePEC Archive (MPRA)
27. Ng, S. & Perron, P. (2001), Lag Length Selection and the Construction of Unit Root Test with Good Size and Power. Econometrica, 69, 1519-54.
28. Patillo, C., Poirson, H. & Rici, L. (2002), External Debt and Growth. IMF Working Paper 02/69. 29. Phillips, P. & Perron, P. (1988), Testing for a Unit Root in Time Series Regression. Biometric, 75, pp.
335-346
30. Pindyck, R. S. & Rubinfeld, D. L. (1998), Econometric Models and Economic Forecasts. Fourth Edition. Irwin McGraw- Hill
31. Rambaldi, A. N. & Doran, H. E. (1996), Testing for Granger non-causality in cointegrated system made easy. Working Papers in Econometrics and Applied Statistics, No. 88, Department of Econometrics, University of New England, pp. 1-22.
32. Rodrik, D. (1997), TFPG Controversies, Institutions and Economic Performance in East Asia, NBER Working Paper 5914. Cambridge, Mass.
33. Simonson, M. H. (1985), The Developing-Country Debt Problem. In G. W. Smith and J. T. Cuddington (eds), International Debt and the Developing Countries. Washington D.C. World Bank.
34. Stambuli, P. K. (1998), Causes and Consequences of the 1982 World Debt Crises? Pre-Doctoral Research Paper. Department of Economics, University of Surrey Guildford, UK.
35. The World Bank (1985), World Development Report 1985, Washington D.C.
36. The World Bank (2002), Global Development Finance, Analysis and Summary Tables, Washington D.C.
37. Tiruneh, M. W. (2004), An Empirical Investigation into the Determinants of External Indebtedness. PRAGUE Economic Papers.
38. Toda, H. Y. & Phillips, P. C. B. (1993), Vector autoregression and causality. Econometrica, Volume 61, pp. 1367-1393.
39. Toda, H. Y. & Yamamoto, T. (1985), Statistical inference in vector autoregressive with possible integrated process. Journal of Econometrics, Volume 66, pp. 225-250.
40. Zafar, S. & Butt, M. S. (2008), Impact of Trade Liberalization on External Debt Burden: Econometric Evidence from Pakistan. MPRA Paper No. 9548