0103 - 5053 $6.00+0.00
* e-mail: [email protected]
Electroanalytical Investigations on Formation of Thallium(I) Molybdates as a Function of pH
Shiva Prasad*,a, André L.F. Britoa, Valderí D. Leiteb and Antônio G. Souzac
a
Departamento de Engenharia Química, Centro de Ciências e Tecnologia, Universidade Federal da Paraíba, CP 10108, 58109-970 Campina Grande - PB, Brazil
b
Departamento de Química, CCT, Universidade Estadual da Paraíba, 58100-000 Campina Grande - PB, Brazil
c
Departamento de Química, CCEN, Universidade Federal da Paraíba, 58059-900 João Pessoa - PB, Brazil
A formação de molibdatos de tálio obtidos a partir de interação de nitrato de tálio(I) e molibdato de sódio nos valores específicos do pH 7,6; 5,5 e 4,1 foi estudada através de técnicas eletrométricas envolvendo titulações potenciométricas e condutométricas, em meios aquoso e alcoólico, com cada reagente usado alternadamente como titulante. As inflexões e degraus bem definidos nas curvas de titulação fornecem evidências incontestáveis sobre a formação de molibdatos normal-Tl2O.MoO3, para-3Tl2O.7MoO3 e octa-2Tl2O.8MoO3 de tálio(I) nas vizinhanças de pH 6,8; 5,9 e 5,2 respectivamente. Estudos analíticos também foram realizados sobre os precipitados de molibdatos de tálio(I) confirmando os resultados obtidos pelas técnicas eletrométricas.
The formation of thallium(I) molybdates obtained by interaction of thallium(I) nitrate and sodium molybdate at specific pH levels 7.6, 5.5 and 4.1 has been studied by electrometric techniques involving potentiometric and conductometric titrations, in aqueous and alcoholic media using each reagent as titrant. Well defined breaks and inflections in the titration curves provide cogent evidence for formation of thallium normal-Tl2O.MoO3, para-3Tl2O.7MoO3 and octa-2Tl2O.8MoO3 molybdates in the vicinity of pH 6.8, 5.9 and 5.2, respectively. Analytical investigations of the precipitates of thallium(I) molybdates have also been carried out, which substantiate the results of the electrometric study.
Keywords: molybdates, thallium(I) molybdates, electrometry
Introduction
The chemistry of molybdenum is very prominent in both biological and industrial systems.1,2 Recent studies
have shown that certain molybdates have antiviral, including anti-AIDS, and antitumor activity.3 Although a
large number of studies have been done in the field of molybdate chemistry, the chemical state of isopolymolybdates, obtained on acidification of a molybdate solution, is not well understood because of the complexity in polymerization. Jander et al. claimed existence of Mo3O114-, HMo
3O11 3-, HMo
6O21 5-, H
2Mo6O21 4-,
H3Mo6O213-, H
7Mo12O41 3-, H
7Mo24O78
5- and H
9Mo24O78
3-from diffusion and optical experiments.4 Bye claimed the
existence of Mo7O246-, Mo 6O20
4-, Mo 4O13
2- and HMo 6O20
3-by cryoscopic study.5 In 1959, Sasaki et al. deduced from
potentiometry that the main complex formed is Mo7O246-.6
Subsequently mathematical analysis was applied to potentiometric equilibrium curves, and Sasaki et al. claimed the existence of Mo7O246-, HMo
7O24 5-, H
2Mo7O24
4-and H3Mo7O243- up to a value of Z (average number of H+
being consumed by MoO42-) of around 1.4.7,8 Aveston et
al.9 by centrifuge data could only tell that in the range
studied, the species probably contain more than 6 and less than 9 Mo atoms. Sasaki et al. proposed the presence of large isopolymolybdate anions of the order of 20 Mo in the solution of Z >1.5.7 Numerous species such as HMoO
4 -,
H2MoO4 , Mo2O72-, HMo 3O11
3-, Mo 6O19
2-, Mo 7O24
6-,
HMoO245-, H 2Mo7O24
4-, Mo 8O26
4-, HMo 8O26
3-, Mo 12O37
2-,
H7Mo24O785-, Mo 36O112
8- etc. have been reported in many
recent publications.10-12
earlier workers seem to be overstrained and hence it was considered worthwhile to make a careful and precise study on the formation of molybdates as a function of pH by electrometric techniques, which have provided more conclusive evidence on the condensation process of vanadate,13 antimonite14 thiotungstate15 and tungstate
anions.16 In an earlier publication17 Prasad and Gonçalves
have reported the effect of pH change on composition of thorium molybdate. The results on formation of thallium molybdates as a function of pH are presented here.
Experimental
All the reagents including TlNO3, Na2MoO4.2H2O, HNO3 and ethanol of extra-pure grade were used, and their solutions were prepared with deionized distilled water. Concentration of sodium molybdate solutions was further verified by determining molybdenum with oxime as MoO2(C9H6ON)2.18 The variations of pH of Na
2MoO4
solutions were obtained by progressive additions of determined quantities of nitric acid. pH measurements were carried out using a Metrohm Herisau pH-meter and Schott Gerate glass combined electrode. Stoichiometric points were obtained from the sharp inflections in the titration curves. The conductometric measurements were performed on a Metrohm conductometer. Conductivity values after
correcting for dilution effect were plotted as a function of mL of titrant solution added and the end-points were judged from the breaks in titration curves. For each experiment, 25 mL of solution were taken in the cell and thermostated at 25±0.1oC. The same concentrations of
reactants were employed in both techniques for the sake of comparison of results. The potentiometric and conductometric titration curves are plotted together in the same figure for similar reasons and also for the sake of brevity. The titrations were performed both by direct and reverse methods at three different concentrations. The electrometric titration results on formation of different thallium molybdates are summarized in Table 1.
Analytical investigations on precipitates were also carried out with a view to substantiate the electrometric results. Different molybdates of thallium(I) were prepared by mixing stoichiometric amounts of thallium nitrate solution with the respective sodium molybdate solutions at specific pH levels 7.6, 5.5 and 4.1. The precipitates obtained were washed several times with aqueous 30% (v/v) ethanolic solution and dried in a vacuum dessicator for 36 h. A known amount (ca. 2 g) of each of the above precipitates was dissolved in a minimum quantity of nitric acid and then analyzed quantitatively for molybdenum18
with dithiol and for thallium18 with thionalide. The results
are summarized in Table 2.
Table 1. Summary of results of electrometric study on formation of thallium molybdates. Volume of titre solution taken in the cell = 25 mL
Concentration of solutions Equivalence points (mL) Formula
(x 103 mol L-1) Calcd. Observed from Supported
p H Conductance
TlNO3 Na2MoO4 Direct titrations. Figure 2, curves 1 and 2
100.00 4.00 2.00 2.00 2.00 Tl2O.MoO3
50.00 2.50 2.50 2.48 2.50
33.33 1.43 2.14 2.14 2.12
Reverse titrations. Figure 2, curves 3 and 4
16.67 100.00 2.08 2.10 2.10 Tl2O.MoO3
10.00 50.00 2.50 2.50 2.52
5.71 33.33 2.15 2.15 2.15
TlNO3 Na6Mo7O24 Direct titrations. Figure 3, curves 1 and 2
100.00 1.33 2.00 2.00 2.00 3Tl2O.7MoO3
50.00 0.71 2.14 2.15 2.15
33.33 0.50 2.25 2.25 2.20
Reverse titrations. Figure 3, curves 3 and 4
12.50 25.00 2.08 2.10 2.10 3Tl2O.7MoO3
6.67 12.50 2.22 2.20 2.25
4.00 8.33 2.00 2.00 2.05
TlNO3 Na4Mo8O26 Direct titrations. Figigure 4, curves 1 and 2
100.00 2.00 2.00 2.00 2.00 2Tl2O.8MoO3
50.00 1.11 2.22 2.20 2.20
33.33 0.71 2.14 2.12 2.15
Reverse titrations. Figure 4, curves 3 and 4
16.67 50.00 2.08 2.10 2.10 2Tl2O.8MoO3
7.41 20.00 2.33 2.35 2..35
Results and Discussion
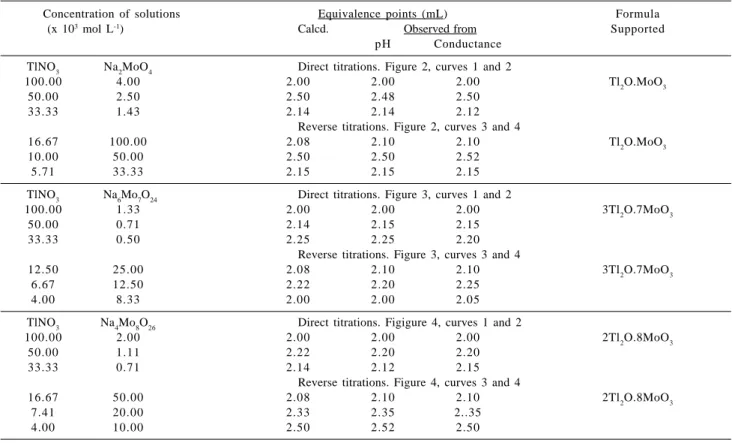
When nitric acid is gradually added to Na2MoO4
solution, it changes to para-molybdate Mo7O246- and
octa-molybdate Mo8O264- polyanions around pH 5.5 and 4.1,
respectively. Figure 1 illustrates the curves of pH and conductometric titrations of Na2MoO4 solution with nitric acid. The titration curves of both the techniques show two inflections at 7Mo:8H and 8Mo:12H corresponding to the formation of the polyanions para-Mo7O246- and
octa-Mo8O264-, respectively (see Figure 1, points A, B and A’,
B’). The results are similar to those obtained for the interaction of hydrochloric acid with sodium molybdate17
and are also in conformity with the results of the temperature-jump studies by Honing and Kustin19 and the
Raman spectra studies by Ozeki et al.20 The stepwise
condensation of MoO42- by gradual addition of nitric acid
can be represented by the following equations:17
8H+ + 7MoO 4
2- Mo 7O24
6- + 4H
2O (1)
12H+ + 8MoO 4
2- Mo 8O26
4- + 6H
2O (2)
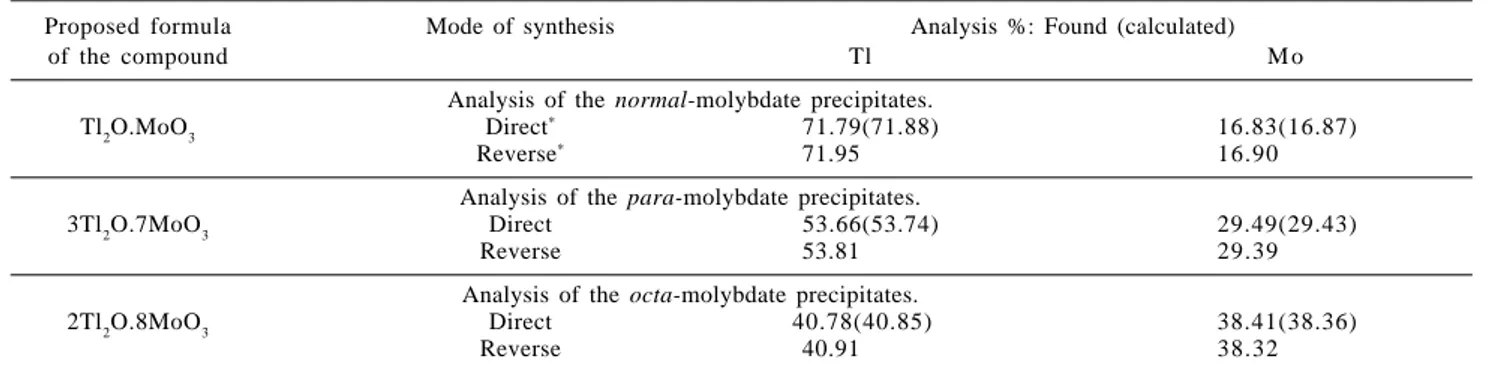
Thallium normal-molybdate
Using different concentrations of Na2MoO4 (pH 7.6) and thallium(I) nitrate (pH 6.1) solutions, a series of potentiometric titrations was carried out. In direct titrations (Figure 2, curve 1), when Na2MoO4 solution was used as titrate, a gradual decrease in pH value was observed till at the stoichiometric end-point (the stage at which the Table 2. Summary of analytical results of the precipitates of thallium molybdates
Proposed formula Mode of synthesis Analysis %: Found (calculated)
of the compound Tl M o
Analysis of the normal-molybdate precipitates.
Tl2O.MoO3 Direct
* 71.79(71.88) 16.83(16.87)
Reverse* 71.95 16.90
Analysis of the para-molybdate precipitates.
3Tl2O.7MoO3 Direct 53.66(53.74) 29.49(29.43)
Reverse 53.81 29.39
Analysis of the octa-molybdate precipitates.
2Tl2O.8MoO3 Direct 40.78(40.85) 38.41(38.36)
Reverse 40.91 38.32
* Direct - Thallium nitrate solution added to sodium molybdate solution. Reserve - Sodium molybdate solution added to mercuric nitrate
solution.
Figure 2. Normal-molybdate direct (1 and 2) and reverse (3 and 4) titrations. 1, 2: 25 mL of 4.00 x 10⁻³ mol L-1 Na
2MoO4 titrated with
1.00 x 10⁻¹ mol L-1 TlNO
3. 3, 4: 25 mL of 1.67 x 10
-2 mol L-1 TlNO 3
titrated with 1.00 x 10⁻¹ mol L-1 Na
2MoO4 (stoichiometric points: A,
B and A’,B’). Figure 1. Potentiometric (curve 1) and conductometric (curve 2)
titrations of acid-molybdate system. 25 mL of 1.33 x 10⁻² mol L-1
Na2MoO4 titrated with 1.00 x 10
-1 mol L-1 HNO
3 (stoichiometric
reaction ends if simple double decomposition takes place) a sharp fall in pH was observed (see point A in Figure 2) when the molar ratio of Tl+:MoO
4
2- is 2:1 corresponding
to the formation of thallium normal-molybdate, Tl2O.MoO3, in the neighborhood of pH 6.8. In case of inverse titrations (Figure 2, curve 3), the pH at first gradually increases till in the vicinity of stoichiometric end-point when the last traces of thallium ions have been removed by precipitation, further addition of alkali molybdate causes a marked upward jump in pH and the inflection corresponds to the molar ratio for the formation of Tl2O.MoO3 according to the reaction:
2TlNO3 + Na2MoO4 Tl
2O.MoO3 + 2NaNO3 (3)
Employing similar concentrations of the reactants, direct (Figure 2, curve 2) and reverse (Figure 2, curve 4) conductometric titrations between the solutions of thallium nitrate and sodium molybdate gave well-defined breaks at 2:1 molar ratio of Tl+:MoO
4
2- confirming the formation of
the same compound Tl2O.MoO3 as indicated by the pH study.
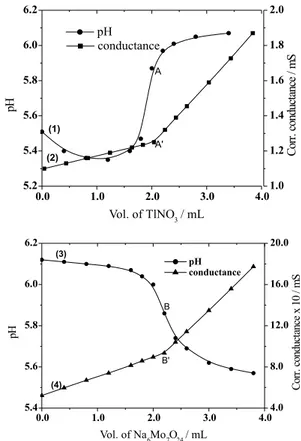
Thallium para-molybdate
Sodium para-molybdate solution was prepared by addition of nitric acid to Na2MoO4 in molar ratio 8H:7Mo. Using different concentrations of sodium para-molybdate (pH 5.5) and thallium(I) nitrate (pH 6.1) solutions, a series of potentiometric titrations was carried out. In direct titrations (Figure 3, curve 1), when the para-molybdate solution was used as titrate, a gradual change in pH value was observed till at the stoichiometric end-point a sharp upward jump in pH was observed when the molar ratio of Tl+:Mo
7O24
6- is 6:1 corresponding to the formation of
thallium para-molybdate, 3Tl2O.7MoO3, in the
neighborhood of pH 5.9. In case of inverse titrations (Figure 3, curve 3), when thallium nitrate solution was used as titrate, a gradual decrease in pH was observed till at the stoichiometric point a downward jump in pH was noted and the inflection corresponds to the molar ratio for formation of 3Tl2O.7MoO3. The formation of the para-molybdate can be represented as follows:
6TlNO3 + Na6Mo7O24 3Tl
2O.7MoO3 + 6NaNO3 (4)
Employing similar concentrations of the reactants a series of direct (Figure 3, curve 2) and reverse (Figure 3, curve 4) conductometric titrations was performed between the solutions TlNO3 and Na6Mo7O24. The titration curves provide well-defined breaks at a point where the molar
ratio of Tl+:Mo 7O24
6- is 6:1 (Table 1), thus confirming
formation of para-molybdate, as suggested by the pH study.
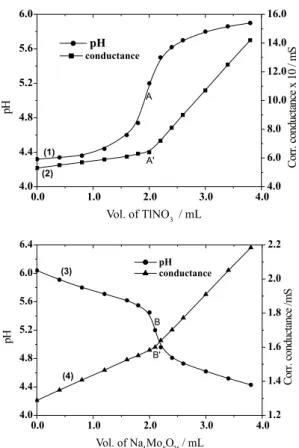
Thallium octa-molybdate
Sodium octa-molybdate solution was prepared by addition of nitric acid to Na2MoO4 in molar ratio 3H:2Mo. Using different concentrations of the solutions of TlNO3
and Na4Mo8O26, a series of potentiometric and
conductometric titrations was carried out. The slope and nature of these titration curves (Figure 4) are similar to those of the para-molybdate. The curves provide well-defined inflections at molar ratio 4:1 of Tl+:Mo
8O26
4- (see points A,
B and A’, B’ in Figure 4) corresponding to stoichiometry for formation of thallium octa-molybdate 2Tl2O.8MoO3 in the vicinity of pH 5.2, according to the reaction:
4TlNO3 + Na4Mo8O26 2Tl
2O.8MoO3 + 4NaNO3 (5)
It was noted that after each addition of the titrant, it takes a little time for the pH and conductance values to become steady. A thorough stirring in the neighborhood Figure 3. Para-molybdate direct (1 and 2) and reverse (3 and 4) titrations. 1, 2: 25 mL of 1.33 x 10⁻³ mol.L-1 Na
6Mo7O24 titrated with
1.00 x 10⁻¹ mol L-1 TlNO
3. 3, 4: 25 mL of 6.67 x 10
-3 mol L-1 TlNO 3
titrated with 1.25 x 10⁻² mol L-1 Na
6Mo7O24 (stoichiometric points: A,
of the equivalence point has a favorable effect. The presence of ethanol (30%) improves the position of end-point and increase the magnitude of the jump in pH curves as it decreases the solubility of the precipitates formed and minimizes hydrolysis and adsorption. The results obtained were precise. The relative standard deviation of the results reported in Table 1 was <1%.
Quantitative analysis of precipitates
The results of the quantitative elemental analyses of the precipitates were used to calculate the proportions of the elements present in the compounds. From these proportions, the composition of the compounds was established which was found to be the same as obtained by the electrometric techniques (see Table 2).
The present electroanalytical investigations and the quantitative analysis of the precipitates confirm the formation and precipitation of three thallous molybdates
viz. normal-Tl2O.MoO3, para-3Tl2O.7MoO3 and
octa-2Tl2O.8MoO3 in the vicinity of pH 6.8, 5.9 and 5.2, respectively.
Figure 4. Octa-molybdate direct (1 and 2) and reverse (3 and 4) titrations. 1, 2: 25 mL of 2.00 x 10⁻³ mol L-1 Na
4Mo8O26 titrated with
1.00 x 10⁻¹ mol L-1 TlNO
3. 3, 4: 25 mL of 1.67 x 10
-2 mol L-1 TlNO 3
titrated with 2.00 x 10⁻² mol L-1 Na
4Mo8O26 (stoichiometric points: A,
B and A’,B’).
As the structure of these compounds are not known they are represented as double oxides, the manner which is usually adopted for such compounds.21,22
Acknowledgement
The authors are indebted to CNPq for financial assistance.
References
1. Haber, J.; The Role of Molybdenum in Catalysis; Climax
Mo-lybdenum Co.: London, 1981.
2. Simpson, C.H.; Amer. Paint. Coating J. 1992, 66.
3. Kopf-Maier, P.; Klopotke, T.; J. Cancer Res. Clin. Oncol.
1992, 118, 216.
4. Jander, G.; Jahr, K.F.; Henkesheshoven, W.; Z. Anorg. Chem.
1930, 194, 383.
5. Bye, J.; Ann. Chim. Fr. 1945, 20, 463; C. R. Acad. Sci., Paris.
1954, 238, 239; Bull. Soc. Chim. Fr. 1957, 1023.
6. Sasaki, Y.; Lindeqvist, I.; Sillen, L. G.; J. Inorg. Nucl. Chem.
1959, 9, 93.
7. Sasaki, Y.; Sillen, L.G.; Acta Chem. Scand. 1964, 18, 1014.
8. Sasaki, Y.; Sillen, L.G.; Ark. Khemi. 1968, 29, 253.
9. Aveston, J.; Anacker, E. W.; Johanson, J. S.; Inorg. Chem.
1964, 3, 735.
10. Ozeki, T.; Adachi H.; Ikeda, S.; Bull. Chem. Soc. Jpn. 1996,
69, 619.
11. Ozeki, T.; Kinoshita, Y.; Adachi, H.; Bull. Chem. Soc. Jpn.
1994, 67, 1041.
12. Pope, M. T. In Progress in Inorganic Chemistry; Lippard, S.
J.; ed.; An Interscience Publication: New York, vol. 39, 1991.
13. Prasad, S.; Gonçalves, S.B.; Brito, J. B.; Catal. Today. 2000,
57, 339.
14. Prasad, S.; Bull Electrochem. 1990, 6, 163.
15. Prasad, S.; Can. J. Chem. 1981, 59, 563.
16. Prasad, S.; Quim. Nova. 1994, 17, 31.
17. Prasad, S.; Gonçalves, S.B.; J. Braz. Chem. Soc. 2000, 11,
199.
18. A. I. Vogel; A Textbook of Quantitative Inorganic Analysis,
3rd. ed., Longmans: London, 1962, p. 508; 793; 550.
19. Honing, D.S.; Kustin, M.; Inorg. Chem. 1972, 11, 65.
20. Ozeki, T.; Kihara, H.; Hikima, G.; Anal. Chem. 1987, 59, 945.
21. Standen, A.; Ex. ed.; Kirk-Othmer Encyclopedia of Chemical
Technology, 2nd. ed., Interscience Publishers: New York, 1967,
v. 13, p. 782.
22. Brauer, G., ed. In Handbook of Preparative Inorganic
Chem-istry, 2nd. ed., Academic Press: New York, 1965, v. 2, p. 1705.