O
RIGINALA
RTICLE Revista Brasileira de FisioterapiaGait spatial and temporal predictors for
functional capacity tests in Parkinson’s disease
patients
Preditores espaço-temporais do andar para testes de capacidade funcional em
pacientes com doença de Parkinson
Sánchez-Arias MDR1, Silveira CRA1, Caetano MJD1, Pieruccini-Faria F1, Gobbi LTB1, Stella F1,2
Abstract
Objective: To determine which spatial and temporal parameters are predictors of the gait pattern of individuals with idiopathic Parkinson’s disease, for the aerobic endurance and agility tests included in the battery of tests of the AAHPERD protocol. Methods: Six men and six women with mild and moderate impairment and disease stage were selected. They performed agility and aerobic endurance test in accordance with the AAHPERD protocol, and walked 8 m on a walkway. A digital video camera recorded one central stride. Markers were attached to the fi fth metatarsal and lateral face of the calcaneus of the right leg and to the fi rst metatarsal and medial face of the calcaneus of the left leg. The dependent variables selected were the time taken in the agility and endurance tests and the kinematic variables: stride length (SL), cadence (CAD), stride time (ST), double support time (DS), single support time (SS), swing time (SW) and stride velocity (SV). Results: For agility, Pearson’s test showed statistically signifi cant correlations with SL (r=-0.70; p≤0.05), CAD (r=-0.72; p≤0.01), SV (r=-0.83; p≤0.01), ST (r=0.71; p≤0.01) and DS (r=0.90; p≤0.01). For endurance, there were correlations with SL (r=-0.67; p≤0.05), CAD (r=-0.72; p≤0.01), SV (r=-0.82; p≤0.01), ST (r=0.71; p≤0.01), and DS (r=0.90; p≤0.01). Multiple regression analysis revealed that DS was the only variable that predicted performance in both the agility (R2=0.82; p≤0.01) and the endurance (R2=0.81; p≤0.01) tests. Conclusions:
It was observed that DS measure has a potential use as a kinematic parameter of gait that predicts the performance in agility and aerobic endurance tests in patients with idiopathic Parkinson’s disease.
Key words: Parkinson disease; gait; task performance and analysis; agility; dynamic balance; physical endurance.
Resumo
Objetivos: Determinar quais parâmetros espaço-temporais são preditores do andar de indivíduos com doença de Parkinson idiopática para os testes de resistência aeróbia e agilidade, propostos pela bateria de testes da American Alliance for Health, Physical Education, Recreation and Dance (AAHPERD). Materiais e métodos: Foram selecionados seis homens e seis mulheres com comprometimento e estágio da doença em níveis leve e moderado, que realizaram os testes de agilidade e resistência aeróbia, conforme o protocolo da AAHPERD, e andaram 8m sobre uma passarela. Uma câmera digital registrou uma passada central. Marcadores foram fi xados no quinto metatarso e na face lateral do calcâneo do membro inferior direito e no primeiro metatarso e na face medial do calcâneo do membro inferior esquerdo. As variáveis dependentes selecionadas foram: tempo nos testes de agilidade e resistência e as variáveis cinemáticas (comprimento da passada - CP, cadência - CAD, duração da passada - DP, duração da fase de duplo suporte - DDS, duração do suporte simples - SS, duração da fase de balanço - DB e velocidade da passada - VP). Resultados: Para agilidade, o teste de Pearson apontou correlação estatisticamente signifi cativa entre as variáveis CP (r=-0,70; p≤0,05), CAD (r=-0,72; p≤0,01), VP (r=-0,83; p≤0,01), DP (r=0,71; p≤0,01) e DDS (r=0,90; p≤0,01). Para resistência, houve correlação com as variáveis CP (r=-0,67; p≤0,05), CAD (r=-0,72; p≤0,01), VP (r=-0,82; p≤0,01), DP (r=0,71; p≤0,01) e DDS (r=0,90; p≤0,01). A análise de regressão múltipla revelou que a DDS foi a única variável preditora dos testes de agilidade (R2=0,82;
p≤0,01) e resistência (R2=0,81; p≤0,01). Conclusões: Observou-se o uso potencial da DDS como parâmetro espaço-temporal do
andar preditor do desempenho dos testes de resistência aeróbia e agilidade em pacientes com doença de Parkinson idiopática.
Palavras-chave: doença de Parkinson; andar; análise e desempenho de tarefas; agilidade, equilíbrio dinâmico; resistência física.
Received: 16/04/2007 – Revised: 03/12/2007 – Accepted: 07/08/2008
1 Postgraduate Program in Motor Science, Bioscience Institute, Universidade Estadual Paulista (Unesp) – Rio Claro (SP), Brazil
2 Neuropsychiatry and Elderly Mental Health Clinic, Hospital das Clínicas, Universidade Estadual de Campinas (Unicamp) – Campinas (SP), Brazil
Correspondence to: Lilian Teresa Bucken Gobbi, Avenida 24-A, 1515, Bela Vista, CEP 13506-900, Rio Claro (SP), Brazil, e-mail: [email protected]
Introduction
In individuals with idiopathic Parkinson’s disease (IPD), spatial and temporal gait parameters have been used to evaluate motor impairments caused by the degeneration of nigrostriatal tract1. Reduced arm swing, reduced range of motion of hips, knees and ankles, decreased stride length, increased double support time and walking slowness, among other characteristics, are present in IPD. Some of these characteristics can be modulated by environmental demands2-4.
Walking is often used in activities of daily living, and individuals with IPD need to walk in a safe and effective way to face the unexpected demands of daily life5. However, fatigue can generate difficulty6, and the characteristics of gait can compromise the ability to perform physical activity and also affect functional capacity in these individuals7. Consequently, the fact that daily situations make high demands on functional capacity justifies an approach to gait with endurance, agility and balance according to the demands of the environment.
Quantitative analysis of the spatial and temporal parameters of gait has been employed to assess the effects of IPD treatmentwith the use of kinematic systems and tools8. Although a quantitative analysis of gait is an accurate evaluation of the parkinsonian gait, it is not always possible to use spatial and temporal parameters generated by kinematic tools to analyze the results of physical activity programs aimed at improving endurance, agility, balance, and the overall functional capacity of IPD individuals.
h e American Alliance for Health, Physical Education, Recreation and Dance (AAHPERD)9 protocol suggests the calculation of the overall functional capacity index of the elderly by testing coordination, muscle strength, l exibility, agility and dynamic balance (AGIL), as well as general aerobic endurance and ability to walk (RAG). h ere are normative values of these tests for Brazilian population10. Comparisons between elderly individuals with and without IPD, using this protocol, demonstrated a functional capacity decline in those with IPD11. Performance improvement in the AGIL test and maintenance of RAG test values were observed in individuals with mild and moderate IPD, after a four-month specii c training program. h ese results justify the importance of both physical activity and the adopted test12.
There is evidence of positive correlations between gait parameters (stride length, stride velocity and simple and double support time) and traditional time tests ( finger-to-nose and sit-stand-walk) which are frequently used for quantitative assessment of bradykinesia in IPD8. It is also
known that the stride length of IPD patients is the most effective predictor of the “finger-nose-finger” and “get up, walk and sit down” time tests and of the motor score of the Unified Parkinson’s Disease Rating Scale (UPDRS)8.
Considering that the AAHPERD protocol uses the walking task in the AGIL and RAG tests, there may be a relationship between performance in those tests and the spatial and temporal parameters of parkinsonian gait measured with kinematic instruments. However, these relationships have not been investigated. Consequently, it has been questioned whether the spatial and temporal parameters of parkinsonian gait, measured with kinematic instruments, could be correlated with RAG and AGIL tests in individuals with IPD.
Information about the relationship and prediction of the performance of aerobic endurance, agility and dynamic balance through the spatial and temporal parameters of the typical gait in IPD individuals could be important to interpret the results of the AGIL and RAG tests, observing the specific characteristics of parkinsonian gait.
Furthermore, the application of the AAHPERD protocol is practical, as it does not need sophisticated equipment or complex training on the part of the examiners, which facilitates its implementation in physical activity programs for IPD patients.
Thus, the links between RAG and AGIL test results and the inherent gait characteristics of IPD individuals could be taken into account in physical activity programs which often bring about improvements in agility, aerobic endurance, functional capacity and physical independence in this population. In this context, the aim of this study was to determine which spatial and temporal parameters are predictors of the gait of IPD individuals in the RAG and AGIL tests proposed by the AAHPERD protocol.
Methods
The present study was approved by the Committee for Ethics in Research on Humans of the Bioscience Institute of Unesp – Rio Claro (Approval no. 2722/05). All participants signed an informed consent form.
Six men and six women with a clinical diagnosis of IPD, made by a neurologist, took part in this study. A geriatric neuropsychiatrist (F.S.) evaluated the impairment and clinical stage of the disease with the UPDRS13 and the Hoehn and Yahr scale (HYS)14. The UPDRS score ranges from 0 to 176. Higher scores reflect greater overall impairment and the restrictions in cognition, activities of daily living and motor functions caused by the disease. In the HYS from one
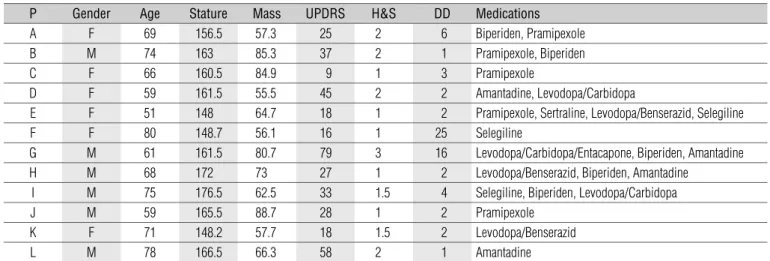
to five, the higher stage reflects greater IPD progress. The present study included individuals up to stage 3 of the HYS, with preserved cognitive capacity, and excluded individuals at stages 4 and 5, with freezing episodes, festination and dementia. The subjects performed all tests under effect of the anti-Parkinson medication. Table 1 shows the characteristics of the participants.
The RAG test reflects the aerobic endurance and walking ability of the elderly. Its validity as an evaluation of aerobic capacity is moderate, but comparable to other walking/ running tests9. The participant was instructed to walk 804.67cm of a 400m athletics track as quickly as possible. The time spent to perform the task was recorded in minutes and seconds, and then converted to seconds for the final result.
The AGIL test involves body total activity with forward movements, changes in direction and changes in body position9. The participant began seated on a chair with heels placed on the floor. At the “ready, set, go” signal, the participant would move to the right and circle a cone positioned 1.50m behind and 1.80m to the side of the chair, then go back to the chair and sit down. The participant would immediately get up again, move to the left and circle a second cone, then come back to the chair and sit down again, thus completing the first of two required circuits. The subject would raise the feet off the floor slightly when sitting down to ensure that the sitting movement had been accomplished. Two trials were performed and the shortest time in seconds was recorded as the final result. The participants received verbal instruction and encouragement to complete the test as quickly as possible. All subjects performed both tests appropriately.
The kinematic evaluation of gait consisted in walking along an 8m non-skid path at preferred speed. The choice of preferred speed was allowed to respect individual
differences, to ensure participant comfort, because it is internally regulated, and because it assumes the inherent variability of participants and task.
A digital camera, attached to a tripod perpendicular to the ground at a height of 98.5cm and 4.95m from the center of the path, was positioned in the right sagittal plane of the participant. The camera recorded one central stride of five attempts with a sampling frequency of 60Hz. The participant wore fitted pants and black socks with passive markers attached to the fifth metatarsal and the lateral face of the calcaneus of right lower limb as well as the first metatarsal and the medial face of the calcaneus of the left lower limb. Two 500W spotlights, positioned next to the camera, were used to amplify marker reflection and facilitate point measurement. The calibration system was carried out using two plumb lines as references of the equidistant orthogonal axes, “x” and “y” (3.01m x 1.30m), thus obtaining the respective horizontal and vertical coordinates. A video card captured the images for later two-dimensional movement reconstruction using Video Digital for Windows 5.1 (Dvideow)15.
The mean value of one stride in five attempts was used to calculate the kinematic variables: stride length (SL), cadence (CAD), stride time (ST), double support time (DS), simple support time (SS), swing time (SW) and stride velocity (SV)16. Matlab 6.5 was used for these calculations. SPSS 10.0 was used for the Pearson correlations and linear regressions (stepwise). The α level considered for the analyses was set at 0.05.
Results
h e normality of data was verii ed by the Kolmogorov-Smirnov test, and Pearson’s coei cient demonstrated signii cant
P Gender Age Stature Mass UPDRS H&S DD Medications
A F 69 156.5 57.3 25 2 6 Biperiden, Pramipexole
B M 74 163 85.3 37 2 1 Pramipexole, Biperiden
C F 66 160.5 84.9 9 1 3 Pramipexole
D F 59 161.5 55.5 45 2 2 Amantadine, Levodopa/Carbidopa
E F 51 148 64.7 18 1 2 Pramipexole, Sertraline, Levodopa/Benserazid, Selegiline
F F 80 148.7 56.1 16 1 25 Selegiline
G M 61 161.5 80.7 79 3 16 Levodopa/Carbidopa/Entacapone, Biperiden, Amantadine
H M 68 172 73 27 1 2 Levodopa/Benserazid, Biperiden, Amantadine
I M 75 176.5 62.5 33 1.5 4 Selegiline, Biperiden, Levodopa/Carbidopa
J M 59 165.5 88.7 28 1 2 Pramipexole
K F 71 148.2 57.7 18 1.5 2 Levodopa/Benserazid
L M 78 166.5 66.3 58 2 1 Amantadine
P=participant, F=female, M=male, Age (years), Height (cm), Mass (kg), UPDRS (points), H&S (points), DD=disease duration (years). Table 1. Characterization of the participants.
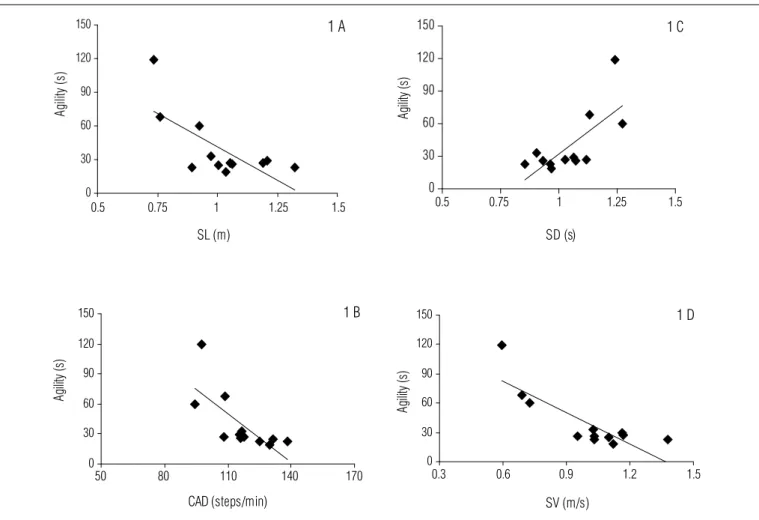
correlations between AGIL and the variables for SL (r=-0.70; p≤0.05; Figure 1A), CAD (r=-0.72; p≤0.01; Figure 1B), DP (r=0.71; p≤0.01; Figure 1C) and SV (r=-0.83; p≤0.01; Figure 1D).
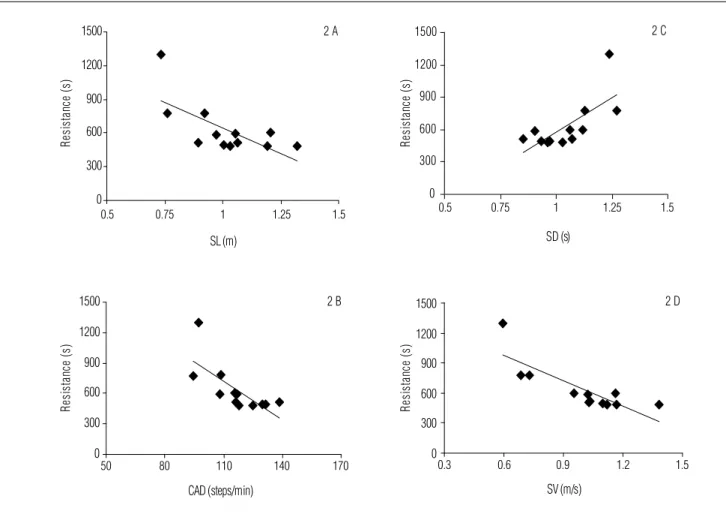
Pearson’s coefficient also showed significant correlations between RAG and the variables for SL (r=-0.67; p≤0.05; Figure 2A), CAD (r=-0.72; p≤0.01; Figure 2B), ST (r=0.71; p≤0.01; Figure 2C) and SV (r=-0.82; p≤0.01; Figure 2D).
Furthermore, correlations were found between DS and AGIL (r=0.90; p≤0.01) and RAG (r=0.90; p≤0.01). The multiple regression analysis showed that the DS variable was the only predictor for AGIL (R2=0.82; p≤0.01; Figure 3A) and for RAG (R2=0.81; p≤0.01; Figure 3B) performance.
Discussion
In general, walking was the common task among all the tests, and it required similarities in trunk and lower limb control. h e spatial and temporal parameters of IPD individuals were compared to the AGIL and RAG test results.
Strong negative correlation was found between SL, CAD and SV with the AGIL and RAG tests, which indicates that
the worst performance in the agility, dynamic balance and general aerobic endurance task was related to a decrease in SL, CAD and SV. A strong positive correlation was also found between ST, DS and the AGIL and RAG tests, which indicates that the worst performance in the agility, dynamic balance and general aerobic endurance tasks was related to an increase in ST and DS in IPD individuals.
When compared to individuals without neurological impairments, IPD patients have reduced SL, reduced SV and increased DS17,18. When asked to move as quickly as possible, IPD patients are slower than individuals without neurological impairments19. In these conditions, they also show modulation in CAD, which is a compensatory strategy for the difficulty in regulating SL20. This modulation occurs in both the preferred and the fast speeds21. This behavior can usually be explained by problems in the appropriate sequence of the motor output (which produces, for example, a short-stepped gait). However, reduced proprioceptive feedback of the lower limbs combined with an intrinsic limitation in movement execution22 can hinder the modulation of gait velocity in response to instructions. Therefore, the correlations between spatial and temporal gait parameters
Figure 1. Correlations between the agility test and dynamic balance (AGIL): 1A – stride length (SL), 1B – cadence (CAD), 1C – stride duration (SD), 1D – stride velocity (SV).
0 30 60 90 120 150
SL (m)
A
gilit
y (
s)
1 A
0 30 60 90 120 150
SD (s)
A
gilit
y (
s)
1 C
0 30 60 90 120 150
CAD (steps/min)
A
gilit
y (
s)
1 B
0 30 60 90 120 150
SV (m/s)
A
gilit
y (
s)
1 D
0.5 0.75 1 1.25 1.5
0.5 0.75 1 1.25 1.5
0.3 0.6 0.9 1.2 1.5
50 80 110 140 170
Figure 2. Correlations between the endurance test and walking ability (RAG): 2A – stride length (SL), 2B – cadence (CAD), 2C – stride duration (SD) and 2D – stride velocity (SV).
0 300 600 900 1200 1500
SD (s)
Resi
st
an
ce (
s)
Resi
st
an
ce (
s)
Resi
st
an
ce (
s)
Resi
st
an
ce (
s)
2 C
0 300 600 900 1200 1500
CAD (steps/min)
2 B
0 300 600 900 1200 1500
SV (m/s)
2 D 0
300 600 900 1200 1500
SL (m)
2 A
0.5 0.75 1 1.25 1.5 0.5 0.75 1 1.25 1.5
50 80 110 140 170 0.3 0.6 0.9 1.2 1.5
Figure 3. Relationship between the agility (AGIL) (3A) and endurance (RAG) (3B) tests with duration of double support phase (DS). 0
300 600 900 1200 1500
DDS (s)
Resi
st
an
ce (
s)
3 B
0 30 60 90 120 150
DDS (s)
A
gilit
y (
s)
3 A
0 0.2 0.4 0.6
0 0.2 0.4 0.6
and the AGIL and RAG tests suggest that the behavior of these parameters is directly related to the walking time of IPD individuals in both tests.
The inadequate functioning of the basal ganglia compromises quick adjustments in muscular timing which change direction and give sequence to the actions that
characterize agility23. It also compromises appropriate muscle group recruitment during gait, including the recruitment speed, which can damage the production of strength to propel the body at each step24,25. The inability to quickly generate the appropriate amount of muscle strength can explain the correlations found in which the individuals
with the worse AGIL and RAG test performance had lower SL, CAD, SV and higher ST and DS. Thus, motor changes caused by the disease can affect spatial and temporal gait parameters as well as aerobic endurance and agility.
h e present results showed that DS was the only predictor of AGIL and RAG test performance. h is indicates that the worst performance in the agility, dynamic balance and general aerobic endurance tasks was predicted by the increase in DS. SL is the most ef ective indicator to evaluate the slowness to plan and execute the movement7, known as bradykinesia25. Among the spatial and temporal gait parameters, SL was expected to be predictor of performance in the AGIL and RAG tests. However, regression analyses indicated DS as the only spatial and temporal predictor of AGIL and RAG test performance.
Grillner et al.26 argue that the increased DS in IPD patients reflects the loss of the ability to automatically carry out the sequence of steps due to the properties of the basal ganglia of starting and finishing motor programs in sequence. Moreover, the fact that DS was expected to be the only predictor of AGIL and RAG test performance, among all the measured spatial and temporal gait parameters, can be explained because this parameter reflects the difficulty IDP patients have with sequential walking.
In other words, the increase in DS highlights the difficulty in the execution of sequential movements during gait characterized, in this case, by changes in movement, which can generate “pauses”25. These “pauses” fragment the movement and compromise the task performance time25. Consequently, IPD patients with higher DS took more time to complete the AGIL and RAG tests. It should be highlighted that RAG and AGIL are field tests which demand sequential actions, i.e. without fragmentation.
The double support phase is the most stable moment during the gait cycle, and an increase in this phase indicates the need to regain stability16. The tests used in the present study imposed changes in linear and angular head accelerations and changes in direction, height and sense of center of mass displacement. Thus, the increase in DS could be interpreted as the need to regain stability.
Balance deficits in IPD individuals are related to sensorial integration impairment27, motor decline, functional ability and fear of falling28,29. These deficits can explain the increase in DS in the participants of the present study, which was reflected in the increased final AGIL and RAG test times. Yet, at the moment of test performance, the additional time in DS can be a strategy which patients use to walk safely.
Environmental cues, especially visual ones, are used as sources of attention or as sensorial reinforcement. These cues have been known to improve SL and, consequently, the SV of these individuals2,20,30,31. Therefore, future IPD research can focus on the behavior of spatial and temporal gait parameters using those cues during the application of AGIL and RAG tests.
DS as a predictor of AGIL and RAG test performance is important for gait training. Exercises that improve functional capacity through the observation of this parameter should be proposed.
Finally, the results indicate DS as the only spatial and temporal parameter capable of predicting AGIL and RAG test performance which suggests the potential use of this parameter as a prospective evaluation to detect balance impairments caused by the disease and which hinder performance in both tests. Based on the present results, dynamic balance activities that manipulate the DS should be a priority in motor treatment planning for IPD patients.
Acknowledgements
To the Posture and Locomotion Studies Laboratory (Leplo) and the Physical Activity and Aging Laboratory (Lafe), Conselho Nacional de Desenvolvimento Científico e Tecnológico (CNPq), Coordenação de Aperfeiçoamento de Pessoal de Nível Superior (Capes), Fundação de Amparo à Pesquisa do Estado de São Paulo (Fapesp),Fundo Nacional de Saúde/ Ministério da Saúde (FNS/MS), Financiadora de Estudos e Pesquisas (Finep) e Fundação para o Desenvolvimento da Unesp (Fundunesp).
Christofoletti G, Oliani MM, Gobbi LTB, Gobbi S, Stella F. Risco de 1.
quedas em idosos com doença de Parkinson e demência de Alzheimer: um estudo transversal. Rev Bras Fisioter. 2006;10(4):429-33.
Morris ME, Iansek R, Matyas TA, Summers JJ. Stride length regulation 2.
in Parkinson’s disease: Normalization strategies and underlying mechanisms. Brain. 1996;119(Pt 2):551-68.
Morris ME, Huxham F, Mcginley J, Dodd K, Iansek R. The biomechanics 3.
and motor control of gait in Parkinson disease. Clin Biomech. 2001;16(6):459-70.
Pieruccini-Faria F, Menuchi MRTP, Vitório R, Gobbi LTB, Stella F, Gobbi 4.
S. Parâmetros cinemáticos da marcha com obstáculos em idosos com doença de Parkinson, com e sem efeito da Levodopa: um estudo piloto. Rev Bras Fisioter. 2006;10(2):233-9.
Hirsch MA, Toole T, Maitland CG, Rider RA. The effects of balance 5.
training and high-intensity resistance training on persons with idiopathic Parkinson’s disease. Arch Phys Med Rehabil. 2003;84(8):1109-17.
Herlofson K, Larsen JP. The infl uence of fatigue on health-related 6.
quality of life in patients with Parkinson’s disease. Acta Neurol Scand. 2003;107(1):1-6.
Canning CG, Alison JA, Allen NE, Groeller H. Parkinson’s disease: an 7.
investigation of exercise capacity, respiratory function, and gait. Arch Phys Med Rehabil. 1997;78(2):199-207.
Chien SL, Lin SZ, Liang CC, Soong YS, Lin SH, Hsin YL et al. The 8.
effi cacy of quantitative gait analysis by the GAITRite system in evaluation of parkinsonian bradykinesia. Parkinsonism Relat Disord. 2006;12(7): 438-42.
Osness WH, Adrian M, Clark B, Hoeger W, Raab D, Wiswell R. Functional 9.
fi tness assessment for adults over 60 years: A fi eld based assessment. Reston: The American Alliance for Health, Physical Education, Recreation and Dance. 1990. p. 5-18.
Zago AS, Gobbi S. Valores normativos da aptidão funcional de mulheres 10.
de 60 a 70 anos. R Bras Ci Mov. 2003;11(2):77-86.
Lopes AG, Gurjão ALD, Oliani MM, Ferreira L, Corazza DI. Relação 11.
entre os níveis de capacidade funcional de idosos portadores de doença de parkinson e idosos saudáveis. IV congresso internacional de educação física e motricidade humana. Motriz. 2005;11(Supl 1): S7-S200.
Lopes AG. Efeitos do treinamento físico sobre o nível de atividade física e 12.
a capacidade funcional na doença de Parkinson [dissertação]. Rio Claro: Universidade Estadual Paulista; 2006.
Fahn S, Elton R. Unifi ed Parkinson’s disease rating scale. In: Fahn S, 13.
Marsden CD, Goldstein M, Calne DB (Eds). Recent developments in Parkinson’s disease. Florham Park, NJ: Macmillan; 1987. p.153-64.
Hoehn MM, Yahr MD. Parkinsonism: onset, progression and mortality. 14.
Neurology. 1967;17(5):427-42.
Figueroa PJ, Leite NJ, Barros RML. A fl exible software for tracking of 15.
markers used in human motion analysis. Comput Methods Programs Biomed. 2003;72(2):155-65.
Winter DA. The biomechanics and motor control of human gait: elderly 16.
and pathological. 2nd ed. Waterloo: University of Waterloo Press; 1991.
Blin O, Ferrandez AM, Serratrice G. Quantitative analysis of gait in Parkinson’s 17.
patients: increased variability in stride length. J Neurol Sci. 1990;98(1):91-7.
Morris ME, Matyas TA, Iansek R, Summers JJ. Temporal stability of gait in 18.
Parkinson’s disease. Phys Ther. 1996;76(7):763-80.
Phillips JG, Martin KE, Bradshaw JL, Iansek R. Could bradyikinesia in 19.
Parkinson’s disease simply be compensation? J Neurol. 1994;241(7):439-47.
Morris ME, Iansek R, Matyas TA, Summers JJ. The pathogenesis of gait 20.
hypokinesia in Parkinson’s disease. Brain. 1994;117(Pt 5):1169-81.
Silveira CRA. Adaptação voluntária do andar em idosos com doença de 21.
Parkinson sob dica visual dinâmica [dissertação]. Rio Claro: Universidade Estadual Paulista; 2007.
Demirci M, Grill S, McShane L, Hallet M. A mismatch between 22.
kinesthetic and visual perception in Parkinson´s disease. Ann Neurol. 1997;41(6):781-8.
Côté L, Crutcher MD. The basal ganglia. In: Kandel ER, Schwartz SH, 23.
Jessel TM. Principles of neural science. Norwalk, Connecticut: Apleton & Lange; 1991.
Giladi N, Shabtai H, Rozenberg E, Shabtai E. Gait festination in Parkinson’s 24.
disease. Parkinsonism Relat Disord. 2001;7(2):135-8.
Berardelli A, Rothwell JC, Thompson PD, Hallet M. Pathophysiology of 25.
bradykinesia in Parkinson’s disease. Brain. 2001;124(Pt 11):2131-46.
Grillner S, Hellgren J, Ménard A, Saitoh K, Wikström MA. Mechanisms for 26.
selection of basic motor programs - roles for the striatum and pallidum. Trends Neurosci. 2005;28(7):364-70.
Brown LA, Cooper SA, Doan JB, Dickin DC, Whishaw IQ, Pellis SM et 27.
al. Parkinsonian defi cits in sensory integration for postural control: temporal response to changes in visual input. Parkinsonism Relat Disord. 2006;12(6):376-81.
Qutubuddin AA, Pegg PO, Cifu DX, Brown R, McNamee S, Carne W. 28.
Validating the Berg Balance Scale for patients with Parkinson’s disease: a key to rehabilitation evaluation. Arch Phys Med Rehabil. 2005;86(4):789-92.
Franchignoni F, Martignoni E, Ferriero G, Pasetti C. Balance and fear of falling 29.
in Parkinson’s disease. Parkinsonism Relat Disord. 2005;11(7):427-33.
Zijlstra W, Rutgers AW, Van Weerden TW. Voluntary and involuntary 30.
adaptation of gait in Parkinson’s disease. Gait Posture. 1998;7(1):53-63.
Schubert M, Prokop T, Brocke F, Berger W. Visual kinesthesia and 31.
locomotion in Parkinson’s disease. Mov Disord. 2005;20(2):141-50.