O
RIGINALA
RTICLE Revista Brasileira de FisioterapiaEvaluation of Physical Therapy service user
satisfaction
Avaliação da satisfação dos usuários de services de Fisioterapia
Machado NP1, Nogueira LT1,2
Abstract
Objective: To evaluate user satisfaction about Physical Therapy services in the city of Teresina, State of Piauí, Brazil, and to characterize users’ sociodemographic profi le and evaluate their satisfaction regarding the time required to setting up appointments and to provide services, reception, trust, ambiance, humanization, accessibility, effectiveness and expectations relating to the services received.
Methods: The sample was comprised of 376 patients who were selected at three physical therapy clinics in the private, municipal and state networks. A questionnaire on sociodemographic characteristics, access to services and user satisfaction was administered. Averages for continuous variables were compared by means of Kruskal-Wallis and Student-Mewman-Keuls tests. Results: Most of the users were women (62.5%), with a mean age of 49.5 years. They were married and illiterate, had family income between one and three minimum wages and were dependent on the national health system. They considered that they had easy access to the services. The means of transportation most used was buses, and it took them on average 28.8 minutes to arrive at the service location. The services users indicated that they did not have any diffi culty with the service, but 14% mentioned that setting up appointments and waiting times were problems they faced in the municipal and state services. Medical indication was the main reason for choosing the service. They trusted the service they received, and the expected treatment results were achieved. Conclusions: Despite the dissatisfaction shown, the majority (75.5%) were satisfi ed with the treatment they received and they said they would recommend the services to other users.
Article registered in the Australian New Zealand Clinical Trials Registry (ANZCTR) under the number ACTRN12609000830291.
Key words: evaluation; consumer preference; health services.
Resumo
Objetivo: Caracterizar o perfi l sociodemográfi co e avaliar a satisfação dos usuários de serviços de Fisioterapia em Teresina (PI), com relação à agilidade para agendamento da consulta e atendimento, acolhimento, confi ança, ambiência, humanização, acessibilidade, efi cácia e expectativa sobre os serviços recebidos. Materiais e métodos: A amostra foi constituída por 376 pacientes selecionados em três clínicas de fi sioterapia da rede particular, municipal e estadual. Utilizou-se um questionário contendo dados sociodemográfi cos, de acesso ao serviço e informações relativas à satisfação dos usuários. Foram calculadas médias para variáveis contínuas por meio do teste de Kruskal-Wallis e do teste de Student-Newman-Keuls. Resultados: Os usuários, na sua maioria, eram mulheres (62,5%), com uma média de idade de 49,5 anos (p<0,01), casados, analfabetos, com renda familiar entre um e três salários mínimos e SUS-dependentes. Consideraram fácil o acesso aos serviços; o meio de transporte mais utilizado foi o coletivo, e gastaram uma média de tempo de 28,8 minutos (p<0,01) para chegar ao local de atendimento. Relataram não ter tido nenhuma difi culdade no atendimento, porém 14% referiram a marcação de consulta e o tempo de espera como os problemas enfrentados nos serviços das redes municipal e estadual. A indicação médica foi o motivo principal da escolha do serviço, confi avam no atendimento recebido e os resultados do tratamento foram alcançados. Conclusões: A despeito da insatisfação apontada, a maior parte tem satisfação (75,5%) com o tratamento recebido e indicariam os serviços a terceiros.
Artigo registrado na Australian New Zealand Clinical Trials Registry (ANZCTR) sob o número ACTRN12609000830291.
Palavras-chave: avaliação; satisfação do usuários; serviços de saúde.
Received: 13/02/2008 – Revised: 07/05/2008 – Accepted: 25/06/2008
1 Master’s Program in Sciences and Health, Universidade Federal do Piauí (UFPI) – Teresina (PI), Brazil 2 Nursing Department, UFPI
Introduction
h e quality of health services began to be discussed with a greater emphasis in the second half of 20th century when
research on the assessment of health services started, focusing on service quality. h e assessment of the quality of health services can be based on three aspects: structure, process and results1. h e assessment of structure concerns the existing
physical resources, materials and number of professionals of the health service; the assessment of the process involves the activities and/or the employed procedures, i.e. the work process; and the results assessment emphasizes the ef ects of the actions and procedures on user health as a result of the received care.
User satisfaction with the received care is an important component of the evaluation of the quality of the health service1,2.
However, it is necessary to consider the means of access to the service, as well as the physical and organizational structure, the professional-patient relationship, i nancial issues and aspects related to health improvement and maintenance3.
User participation in the assessment of satisfaction is related to making health services more suitable with regard to the structure and process of health care4.
In the 1980s, Brazil’s return to democracy and the implementation of the Health Reform gave new vigor to the movement for better conditions in the assistance of health care users5. h erefore, user satisfaction surveys became increasingly
common and have received much attention since the mid 1990’s.
To improve the quality of health care assistance, it is important to adopt the work process model based on the principles of the Brazilian public health system (Sistema Único de Saúde – SUS). h ese principles take into account the concepts of health and disease and the guidelines of universality, totality, resoluteness, participation and social control6, as well as humanization, and user satisfaction. h ese
are considered essential elements for the reorganization of health care services.
Physical therapy as a i eld of knowledge in health has broadened its object of study with respect to prevention, treatment and rehabilitation to promote individual and collective well-being. h is includes the prevention and treatment of functional kinetic disorders that af ect the organs and systems of the human body and that are caused by genetic changes, trauma and acquired diseases. h erefore, physical therapy plays an important role in patient rehabilitation and reintroduction into social interaction7.
In Teresina, state capital of Piauí, there were 39 physical therapy clinics registered at the 6th Regional Physical Therapy
and Occupational Therapy Council in 2006. Among them,
three are highly respected at state, municipal and private level, and have the highest number of physical therapy appointments. They are affiliated with SUS and assist an average of 40 users a day with a wide variety of physical therapy needs. They serve as internship sites for the city’s physical therapy undergraduate students, thus demanding an assessment to better satisfy user needs and consequently achieve adequate results.
In that sense, the present study has as its overall objective to assess the satisfaction of physical therapy service users in Teresina and, specii cally, to describe the sociodemographic proi le and evaluate the satisfaction of users with regard to promptness for appointments, reception, reliability, environment, humanization, fee exemption, accessibility, ei ciency and expectation about services rendered.
User satisfaction is an important element to determine the quality of physical therapy services, and therefore demands greater scientii c research to further the knowledge of the assessment of satisfaction with the physical therapy services of ered in this capital city.
Methods
h is was a descriptive, cross-sectional research conducted in three highly respected physical therapy clinics termed: A (private), B (municipal) and C (state), all ai liated with SUS. h e sample was random, segmented and proportional, and consisted of 376 users. All of the appointments of each clinic in 2006 were used, with no sample loss. h e coni dence interval was 95%, incidence was 50%, and sampling error was 5%. h e sample was calculated using Epi Inform 6.04. h e participants were male and female users over 18 years of age who sought physical therapy treatment and had at least six sessions. Exclusion criteria were: any type of speech and/or comprehension impediment; any type of pain; refusal to sign the consent agreement to take part in the study.
To collect the data, a questionnaire was used containing close-ended questions concerning sociodemographic data, access to the service and user satisfaction. h e questionnaire was applied in interview form by the researcher during regular hours at the three clinics between May and June 2007. h e questionnaire was i lled out in the waiting room before and after the sessions without interfering with the service.
We used the software Microsoft Excel 2005 to calculate the frequencies for the nominal variables as well as the descriptive statistical analyses for the continuous variables. We also used the Kruskal-Wallis8 test, Student’s t-test8 and
a relationship between the variables, user age, and medical specialties.
h e work was submitted to the Ethics Committee of Universidade Federal do Piauí (approval report number 022/07) associated with the program, in accordance with Resolution CNS 196/96 of the National Health Council. All of the users who agreed to participate in the study were asked to sign the informed consent agreement.
Results
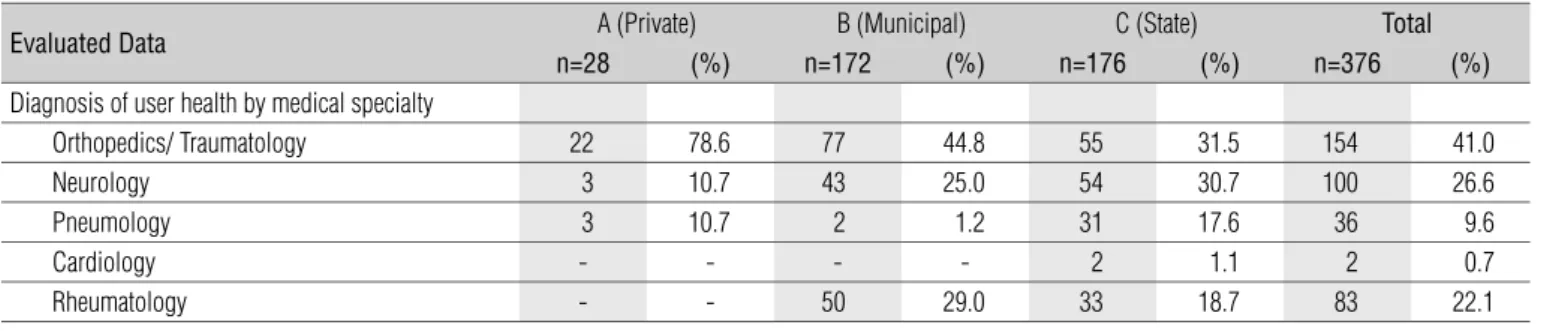
Most users were women with a mean age of 49.5 years, married, illiterate, self-employed, with a family income of one to three times the minimum wage. Only private health plan users claimed to have full plan coverage, however 25% of the participants did not have health insurance and were assisted through SUS (Table 1). h e main reasons that led them to receive physical therapy treatment at the clinics were orthopedics and traumatology-related symptoms. No correlation was found between user age and the diagnoses according to medical specialty (Table 2).
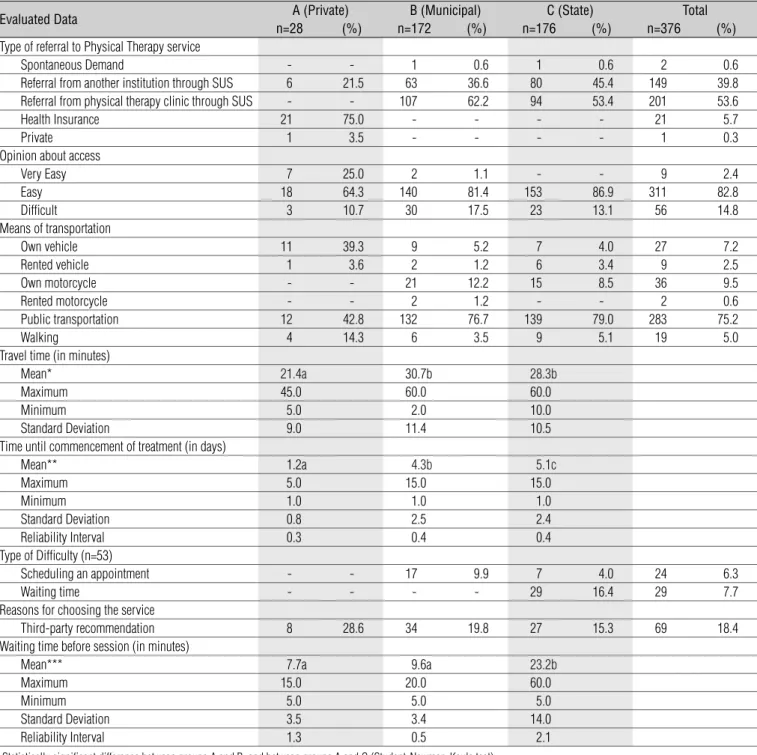
Users reported that there was easy access to the services, and the most common means of travel was public transportation. h e mean time taken to reach the clinic was 28.8 minutes and the mean waiting time to begin treatment was 4.4 minutes. Regarding dii culty to schedule an appointment, 86% of the interviewed users reported no dii culty; however, 14% mentioned that scheduling an appointment and the waiting time were the main problems faced at the clinics of the municipal and state health system. Regarding the reasons for selecting the service, physicians’ referral had the highest percentage (81.6%) and 18.4% of the users reported that previous users had recommended the service (Table 3).
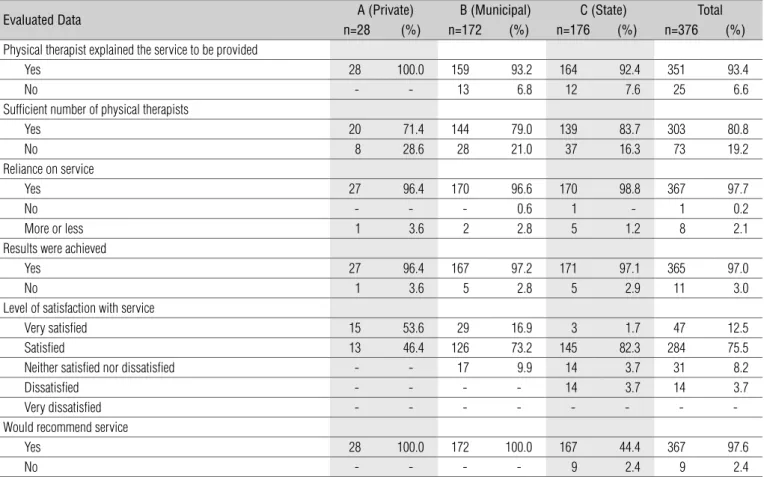
Regarding the number of physical therapists, 80.8% considered the number sui cient and relied on the received service. Ninety-seven percent of the assessed users reported they achieved good results. Regarding the level of satisfaction with the service, it was observed that in the private health system, 53.6% of the interviewed users were very satisi ed compared with 73.2% in the municipal and 82.3% in the state system, and 97.6% of the users would recommend the services to other people (Table 4).
Discussion
Female users were more present in all the evaluated services, which can be explained by the fact that, in addition to their domestic duties, women have professional activities
throughout the week and many of them are responsible for the family income, often leading to musculoskeletal complications, such as i bromyalgia, work-related musculoskeletal disorders (WMSDs) or repetitive strain injuries (RSIs). h ese conditions are often minimized or cured with physical therapy treatment. h e greater prevalence of women seeking health services has been reported in the literature9-11.
h e mean age found in the present study was 49.5 years. Among the users who sought treatment, those who were older used the private health system with the highest reported age being 91 and the lowest 29. h ese users began treatment at an older age. Oliveira et al.12 found similar results for the mean age
of the patients (46.5 years). h erefore, it can be concluded that the private health system users had a better quality of life with sui cient funds to take out health insurance.
h e dei nition of quality of life is very broad and has been studied by several authors13,14 who state that it is based
on a multidimensional concept that includes lifestyle, life experience, job satisfaction and i nancial situation. h us, it constitutes a feeling of well- being that corresponds to the sum of subjective sensations of satisfaction.
Socioeconomic factors have great inl uence on quality of life because i nances provide material support for the well-being of the individual15. h is was evidenced by Mendonça,
Guerra, Diógenes16, who claimed that the satisfaction of
patients with the care they received may have been inl uenced by sociodemographic factors, especially gender, family income and educational level. h erefore, the health of the population suf ers the impact of social inequality, characterized by the impoverishment of many to benei t a few, and associated with the process of social exclusion derived from unfair wealth distribution10,17-19.
h e medical specialties found were the following: 41% of the users sought treatment for orthopedics and traumatology related complaints such as joint pain, reduced range of motion or muscular atrophy. Similar results were found in the literature on the assessment of user satisfaction with physical therapy services20, possibly because this specialty involves
changes caused by functional-kinetic disorders leading to musculoskeletal symptoms commonly found in patients who perform professional activities.
In the present research, 82.8% of users considered the services to be easily accessible, especially when compared to those of the state system because they were located in a central area of Teresina. Similar data were found in the study developed by Guedes and Garcia21, and by Lopes, Vieira da
Silva and Hartz22, regarding user satisfaction associated with
easy access to health professionals and services.
Evaluated data A (Private) B (Municipal) C (State) Total
n=28 (%) n=172 (%) n=176 (%) n=376 (%)
Gender
Male 10 35.7 54 31.4 77 43.7 141 37.5
Female 18 64.3 118 68.6 99 56.3 235 62.5
Age
Mean* 56.5a 49.2b 48.8b
Maximum 91.0 79.0 81.0
Minimum 29.0 23.0 20.0
Standard Deviation 14.5 11.2 10.9
Reliability Interval 5.2 1.7 1.6
Marital or Conjugal Status
Single 4 14.3 22 12.8 28 15.9 54 14.4
Married 16 57.1 101 58.7 120 68.2 237 63.0
Divorced 3 10.7 18 10.5 16 9.1 37 9.8
Widow(er) 5 17.9 31 18.0 12 6.8 48 12.8
Education
Illiterate 4 13.7 60 61.5 53 30.1 117 31.1
Elementary 4 14.3 36 20.9 29 16.5 69 18.3
High School 9 32.1 44 25.6 57 32.4 110 29.2
Undergraduate 10 35.7 32 18.6 37 21.0 79 21.0
Graduate 1 3.6 - - - - 1 0.2
Profession/Occupation
Retired 3 10.7 4 2.3 - - 7 1.8
Self-employed 7 25.0 56 32.5 71 40.3 134 35.6
Homemaker 4 14.3 54 31.4 44 25.0 102 27.1
Cleaner 2 7.1 8 4.6 17 9.6 27 7.1
Student - - 6 3.4 8 4.5 28 7.4
Civil Servant 5 17.9 3 1.7 2 1.1 10 2.6
Agricultural Worker - - 20 11.6 15 8.5 35 9.3
Administrative Technician - - 8 4.6 11 6.2 19 5.0
Teacher 7 25.0 13 7.5 8 4.5 28 7.4
Family Income
Below the MW ** - - 61 35.5 51 29.0 112 29.7
MW to 3 times the MW 12 42.9 106 61.6 125 71.0 243 64.6
4 to 6 times the MW 12 42.9 5 2.9 - - 17 4.5
7 to 9 times the MW 4 14.2 - - - - 4 1.0
Has Health Insurance
Yes 21 75.0 - - - - 21 5.5
No 7 25.0 172 100.0 176 100.0 355 94.4
Physical Therapy Coverage
Yes 21 100.0 - - - - 21 5.5
No - - 172 100.0 176 100.0 348 92.5
Table 1. Sociodemographic user profi le and health insurance coverage at three Physical Therapy clinics, 2007.
* Statistically signifi cant difference between A and B groups (Student-Newman-Keuls test). **MW= Minimum Wage (R$ 360.00).
Evaluated Data A (Private) B (Municipal) C (State) Total
n=28 (%) n=172 (%) n=176 (%) n=376 (%)
Diagnosis of user health by medical specialty
Orthopedics/ Traumatology 22 78.6 77 44.8 55 31.5 154 41.0
Neurology 3 10.7 43 25.0 54 30.7 100 26.6
Pneumology 3 10.7 2 1.2 31 17.6 36 9.6
Cardiology - - - - 2 1.1 2 0.7
Rheumatology - - 50 29.0 33 18.7 83 22.1
Evaluated Data A (Private) B (Municipal) C (State) Total n=28 (%) n=172 (%) n=176 (%) n=376 (%) Type of referral to Physical Therapy service
Spontaneous Demand - - 1 0.6 1 0.6 2 0.6
Referral from another institution through SUS 6 21.5 63 36.6 80 45.4 149 39.8 Referral from physical therapy clinic through SUS - - 107 62.2 94 53.4 201 53.6
Health Insurance 21 75.0 - - - - 21 5.7
Private 1 3.5 - - - - 1 0.3
Opinion about access
Very Easy 7 25.0 2 1.1 - - 9 2.4
Easy 18 64.3 140 81.4 153 86.9 311 82.8
Diffi cult 3 10.7 30 17.5 23 13.1 56 14.8
Means of transportation
Own vehicle 11 39.3 9 5.2 7 4.0 27 7.2
Rented vehicle 1 3.6 2 1.2 6 3.4 9 2.5
Own motorcycle - - 21 12.2 15 8.5 36 9.5
Rented motorcycle - - 2 1.2 - - 2 0.6
Public transportation 12 42.8 132 76.7 139 79.0 283 75.2
Walking 4 14.3 6 3.5 9 5.1 19 5.0
Travel time (in minutes)
Mean* 21.4a 30.7b 28.3b
Maximum 45.0 60.0 60.0
Minimum 5.0 2.0 10.0
Standard Deviation 9.0 11.4 10.5
Time until commencement of treatment (in days)
Mean** 1.2a 4.3b 5.1c
Maximum 5.0 15.0 15.0
Minimum 1.0 1.0 1.0
Standard Deviation 0.8 2.5 2.4
Reliability Interval 0.3 0.4 0.4
Type of Diffi culty (n=53)
Scheduling an appointment - - 17 9.9 7 4.0 24 6.3
Waiting time - - - - 29 16.4 29 7.7
Reasons for choosing the service
Third-party recommendation 8 28.6 34 19.8 27 15.3 69 18.4
Waiting time before session (in minutes)
Mean*** 7.7a 9.6a 23.2b
Maximum 15.0 20.0 60.0
Minimum 5.0 5.0 5.0
Standard Deviation 3.5 3.4 14.0
Reliability Interval 1.3 0.5 2.1
Table 3. Access to Physical Therapy service by users of the three clinics, 2007.
* Statistically signifi cant difference between groups A and B, and between groups A and C (Student-Newman-Keuls test). ** Statistically signifi cant difference among the three groups (Student-Newman-Keuls test).
*** Statistically signifi cant difference between groups A and C, and between groups B and C (Student-Newman-Keuls test).
of physical therapy services in their area, problems with locomotion, i nancial dii culties and the distance from their homes. h ese arguments were relevant because most users took public transportation to their destination. h erefore, the dii cult access for some users became evident due to i nancial matters and the fact that this means of transportation cannot be easily used by part of the population.
In the study by Trad et al.23, participants reported that
the location of the Family Health Units is considered to be easily accessible in most cities. h is is important with regard
to user satisfaction because it means easy access to health professionals and care.
Evaluated Data A (Private) B (Municipal) C (State) Total n=28 (%) n=172 (%) n=176 (%) n=376 (%) Physical therapist explained the service to be provided
Yes 28 100.0 159 93.2 164 92.4 351 93.4
No - - 13 6.8 12 7.6 25 6.6
Suffi cient number of physical therapists
Yes 20 71.4 144 79.0 139 83.7 303 80.8
No 8 28.6 28 21.0 37 16.3 73 19.2
Reliance on service
Yes 27 96.4 170 96.6 170 98.8 367 97.7
No - - - 0.6 1 - 1 0.2
More or less 1 3.6 2 2.8 5 1.2 8 2.1
Results were achieved
Yes 27 96.4 167 97.2 171 97.1 365 97.0
No 1 3.6 5 2.8 5 2.9 11 3.0
Level of satisfaction with service
Very satisfi ed 15 53.6 29 16.9 3 1.7 47 12.5
Satisfi ed 13 46.4 126 73.2 145 82.3 284 75.5
Neither satisfi ed nor dissatisfi ed - - 17 9.9 14 3.7 31 8.2
Dissatisfi ed - - - - 14 3.7 14 3.7
Very dissatisfi ed - - -
-Would recommend service
Yes 28 100.0 172 100.0 167 44.4 367 97.6
No - - - - 9 2.4 9 2.4
Table 4. Physical therapist’s explanation about the service, number of physical therapists, reliance on the service, achieved results, level of
satisfaction with the service and recommendation of the service of three physical therapy clinics, 2007.
al.11 also concluded that the long waiting time was a reason
for complaints by the interviewed users6,24,25.
Physicians’ referral to physical therapy treatment at private, municipal and state health systems reached 81.6%, which was confirmed by the required referrals by physicians of the same service or others so that the user can receive physical therapy assistance at both public and private clinics, including SUS patients.
The average number of days until the beginning of physical therapy treatment in the private system was low ( five days), while in the municipal and state systems, it was higher. This demonstrates there was more promptness in private services possibly due to the larger number of professionals, better infrastructure and more physical therapy equipment.
Oliveira et al.12 reported that public health system users
waited more days to begin treatment because of the dii culties in scheduling an appointment. h is i nding is important because it shows the need for government strategies to improve user satisfaction when it comes to issues of infrastructure and waiting time. Among these strategies is the allocation of more i nancial resources to purchase equipment, which together with more professionals will allow faster services.
Based on COFFITO26 regulations and on Viel27, the
procedures of physical therapy clinics were evaluated from the user’s point of view as shown in Table 4. h e number of physical therapists at a clinic is an indication of the satisfaction with care. As established by SUS28, there must be one physical
therapist per hour for every group of six patients. h is is also the quality treatment criteria for therapist-patient relationships recommended by COFFITO to ensure that during clinic hours the number of physical therapists on duty is compatible with the nature of the service and the attention it requires29.
h e present research also found high levels of reliance on the received service (97.7%) and on the attained results (97%). h us, the users interviewed at each of the three clinics were satisi ed with the service they received and recommended it to other users. h e state system users, however, did not recommend the service. h ese users reported longer waiting times and dii culty in scheduling an appointment because of the larger number of patients, as previously mentioned. Similar data were found in the study by Beattie et al.30, in which users
It is clear that satisfaction must be the end result of every health service. h erefore, it should not be the only object of evaluation because other important points must be considered, such as user perception based on socioeconomic and cultural factors, living conditions and, especially, the personal circumstances of each user at the time of the interview6,32.
Other pertinent issues must also be included, such as the state of health, functional capacities and quality of life, to evaluate patient satisfaction as a result of physical therapy30. For those
reasons, physical therapy services require an instrument for user satisfaction evaluation, as frequent interventions demand much more time than a routine medical appointment. h e questionnaires for clinic appointments are not valid, hence the importance of research in this area33.
Conclusions
Satisfaction surveys show temporary results that must receive constant attention as they rel ect the conditions of the services provided to users, and so must the assessment of health system policies, which require continuous review due to population growth, otherwise they might become inef ective.
It is believed that socioeconomic factors interfere with the selection of the service. Low income earners seek public services because access is universal, but those with a higher income who have health insurance look for treatment in the private health system. This leads to the conclusion
that, despite the universal quality of assistance guaranteed by SUS, the government needs to invest more in the health sector, particularly in physical therapy, to achieve greater user satisfaction of the population, especially with regard to waiting times.
Access, from the users’ point of view, to the three evaluated services met their needs, although public transportation was the main means of travel. On average, they took 30 minutes to reach the service because their homes are located far away. Their greatest difficulties were waiting time and scheduling the first appointment in the public health system. The quality of the physical therapy services was considered satisfactory by users. It can be assumed that procedures were adequately followed given the high satisfaction percentages.
h e present study showed that users were satisi ed with the services they received. However, it must be emphasized that some of these results were due to the lack of full knowledge of rights and obligations on the part of the users. Most of them had a low level of instruction, and that may have af ected their critical thinking when it came to objectively evaluating their perception of the services rendered.
Acknowledgments
Our sincere thanks to Statistics lecturers, Evaldo Pádua and João Batista Teles for their valuable contribution.
1. Donabedian A. The seven pillars of quality. Arch Pathol Lab Med. 1990;114(11):1115-8.
2. Donabedian A. La calidad de la atención médica - defi nición y métodos de evaluación. México: La Prensa Médica Mexicana; 1984.
3. Vaistman J, Andrade GRB. Satisfação e responsividade: formas de medir a qualidade e a humanização da assistência à saúde. Cienc Saude Coletiva. 2005;10(3):599-613.
4. Esperidião M, Trad LAB. Avaliação de satisfação de usuários. Cienc Saude Coletiva. 2005;10 (Supl):303-12.
5. Farias LO, Melamed C. Segmentação de mercados da assistência à saúde no Brasil. Cienc Saude Coletiva. 2003;8(2):585-98.
6. Paiva SMA. Qualidade da assistência hospitalar: avaliação a satisfação dos usuários durante seu período de internação [tese de doutorado]. São Paulo: Escola de Enfermagem de Ribeirão Preto, Universidade de São Paulo; 2006.
7. Magalhães MS, Sousa FJP. Avaliação da assistência fi sioterapêutica sob a óptica do usuário. Fisioterapia Brasil, Fortaleza, 2004:5(5):350-6.
References
8. Ayres M, Aires Jr. M, Ayres DL, Santos AS. BioEstat 3.0: Aplicações estatísticas nas áreas das ciências biológicas e médicas. Belém: Sociedade Civil Mamirauá/Brasília: Conselho Nacional de Desenvolvimento Científi co e Tecnológico; 2003.
9. Pinheiro RS, Travassos C. Inequality in heatlh care use by the elderly in three districts in the city of Rio de Janeiro. Cad Saude Pública. 1999;15(3):487-96.
10. Rosso JA, Silva RM. Avaliação da qualidade do atendimento em unidades primárias de saúde: comparação de estruturas com e sem a presença de acadêmicos de Medicina. ACM Arq Catarin Med. 2006;35(2):47-55.
11. Ibañez N, Rocha JSY, Castro PC, Ribeiro MCSA, Forster AC, Novaes MHD, et al. Avaliação do desempenho da atenção no Estado de São Paulo. Cienc Saude Coletiva. 2006;11(3):683-703.
13. Velarde-Jurado E, Avila-Figuereoa C. Evaluación de la calidad de vida. Salud Publica Mex. 2002;44:349-61.
14. Albuquerque AS, Tróccoli BT. Desenvolvimento de uma escala de bem estar subjetivo. Psicol Teor Pes. 2004;20:153-64.
15. Joia LC, Ruiz T, Donalisio MR. Condições associadas ao grau de satisfação com a vida entre a população de idosos. Rev Saude Publica. 2007;41(1):131-8.
16. Medonça KMPP, Guerra RO, Diógenes TPM. Influência das características sócio-demográficas na satisfação do paciente com o tratamento fisioterapêutico. Fisioter Mov. 2006;19(3):83-9.
17. Matos DL, Lima-Costa MF, Guerra HL, Marcenes W. Projeto Bambuí: avaliação de serviços odontológicos privados, públicos e de sindicato. Rev Saude Publica. 2002;36(2):237-43.
18. Araújo IC. Avaliação da satisfação dos pacientes atendidos na clínica integrada do Curso de Odontologia da Universidade Federal do Pará [dissertação de mestrado]. São Paulo: Faculdade de Odontologia, Universidade de São Paulo; 2003.
19. Rosas EP, Dantés OG, Latorre FG. Trato a los usuarios en los servicios publicos de salud en México. Pan Am J Public Health. 2006;19(6):394-402.
20. Mendonça KMPP, Guerra RO. Desenvolvimento e validação de um instrumento de medida da satisfação do paciente com a Fisioterapia. Rev Bras Fisioter. 2007;11(5):369-76.
21. Guedes DGM, Garcia TR. Atendimento nos serviços do Sistema Único de Saúde e satisfação do usuário: estudo no município de Campina Grande (PB). Saude Debate. 2001;25(59):40-9.
22. Lopes RM, Vieira da Silva LM, Hartz ZMA. Teste de uma metodologia para avaliar a organização, aceso e qualidade técnica do cuidado na atenção à diarréia na infância. Cad Saude Publica. 2004;20(Supl 2):S283-97.
23. Trad LAB, Bastos ACS, Santana EM, Nunes MO. Estudo etnográfi co da satisfação do usuário do Programa de Saúde da Família (PSF) na Bahia. Cienc Saude Coletiva. 2002;7(3):581-9.
24. Kloetzel K, Bertoni AM, Irazoqui MC, Campos VPG, Santos RN. Controle de qualidade em atenção primária à saúde. I - A satisfação do usuário. Cad Saude Publica. 1998;14(3):623-8.
25. Seclen-Palacin JA, Benavides B, Jacoby E, Velásquez A, Watanabe E. Existe una relación entre os programas de mejora de la calidad y la satisfacctión de usuarias de atención prenatal?: experiencia en hospitals del Perú. Rev Panam Salud Publica. 2004;16(3):149-57.
26. Conselho Federal de Fisioterapia e Terapia Ocupacional – COFFITO Resolução nº 80 de 9 de maio de 1987. [Acesso em: 14 de fev 2006]. Disponível em: http://www.coffi to.org.br/leis1.asp?id=30 .
27. Viel E. O diagnóstico cinesioterapêutico: concepção, realização e transcrição na prática clínica e hospitalar. São Paulo: Manole; 2001.
28. Conselho Federal de Fisioterapia e Terapia Ocupacional – COFFITO. Ofício COFFITO GRADE n. 007/96. Portaria SUS. São Paulo, 26 de fevereiro de 1996.
29. Conselho Federal de Fisioterapia e Terapia Ocupacional – COFFITO Resolução nº 10 de 3 de julho de 1978. [Acesso em: 14 de fev 2006]. Disponível em: http://www.coffi to.org.br/leis1.asp?id=10 .
30. Beattie PF, Pinto MB, Nelson MK, Nelson R. Patient satisfacton with outpatient physical therapy: instrument validation. Phys Ther. 2002;82(6):557-65.
31. Goldstein MS, Elliot SD, Guccione AA. The development of an instrument to measure satisfaction with physical therapy. Phys Ther. 2000;80(9):853-63.
32. Magalhães MS. Avaliação a assistência fi sioterapêutica sob a óptica do usuário. [dissertação de mestrado]. Fortaleza: Departamento de Saúde Comunitária. Universidade Federal do Ceará; 2003.