Printed in Brazil - ©2007 Sociedade Brasileira de Química 0103 - 5053 $6.00+0.00
A
r
t
ic
le
A
r
t
ic
le
A
r
t
ic
le
A
r
t
ic
le
A
r
t
ic
le
*e-mail: [email protected]
Automatic Flow Analysis Procedure for the Determination of Bromide in
L
-Alanine by
Chemiluminescence Detection
Eduardo P. Borges a and Boaventura F. Reis*,b
a
Universidade Federal de São Carlos, CP 676, 13560-970 São Carlos-SP, Brazil
b
Centro de Energia Nuclear na Agricultura, Av. Centenário 303, 13400-970 Piracicaba-São Paulo, Brazil
Um procedimento automático empregando sistema de análise em fluxo para determinação
de brometo em aminoácido L-alanina empregando detecção por quimiluminescência é descrito.
O procedimento foi baseado na oxidação do brometo por cloramina-T seguido pela reação com lominol. Fortificando amostras com solução padrão obteve-se recuperação na faixa de 94 a 106 %. Foram obtidas características importantes tais como: resposta linear na faixa de 0,01 até 1,000 mg L-1 Br– (R = 0,999); limite de detecção de 8,9 µg L-1 Br–; coeficiente de variação de
3,0% (n = 10); freqüência de amostragem de 18 determinações por hora e consumo de reagente por determinação igual a 0,07 mg de luminol e 0,4 mg de cloramina-T.
An automatic flow analysis procedure for bromide determination in L-alanine aminoacid
employing detection by chemiluminescence is described. The procedure was based on the bromide oxidation by chloramine-T followed by reaction with luminol. Spiking sample with standard solution gave recoveries values ranging from 94 to 106 %. Profitable features such as linear response ranging from 0.01 to 1.000 mg L-1 bromide (R = 0.999); detection limit of 8.9 µg L-1 Br–; relative standard
deviation of 3.0% (n = 10); sampling throughput of 18 determination per hour; and reagent
consumption 0.07 mg luminol and 0.4 mg chloramine-T per determination were achieved.
Keywords: bromide, L-alanine, flow analysis, automatic procedure, chemiluminescence
Indroduction
In the synthesis of the L-alanine, bromide is a constitute of the raw material used in the synthesis line,1 thus residual
bromide could occur as contamination after the purification step. Bromide presents risk for human health owing to its continued ingestion could cause bromism that is a disease related to memory lessening.2,3 Since bromide
is delivered in the L-alanine synthesis procedure there is a potential contamination risk of the final product. In this sense, the determination of the bromide in L-alanine is a requirement to prevent risk for human health.
Procedures for bromide determination in different matrices employing potentiometry,4,5 ion exchange
chromatography,6 capillary electrophoresis,7
spectro-photometry8-11 have been proposed. Generally,
spectro-photometric methods present adequate sensitivity, nevertheless the time consumed to perform an analysis is very long. This drawback has been circumvented
employing analytical procedures based on flow injection process using bromide oxidation by chloramine-T.12 After
oxidizing step the resulting product reacted with phenol red to form a compound that was detected by spec-trophometry. Additional procedures for bromide determination in water exploiting the catalytic potential afforded by bromide ion on the oxide-reduction reactions have also been proposed.13,14
Procedures based on ionic exchange chromatography for bromide determination in water attained low limit of detection.15 This technique has been recognized as an
efficient tool for ions separation, nevertheless for complex matrix extraction step is required, thus lessening the sampling throughput. Procedure based on capillary electrophoresis has been also proposed for bromide determination,16 which provided limit of detection similar
to that achieved using ionic chromatography.15
the procedures underwent strong interferences caused by other chemicals species naturally existing in the samples, separation steps was carried out prior to analysis.
The analytical procedure commented above employed commercial equipment furnished with photo-multiplier tube, however recent works showed that analytical procedures based on chemiluminescence could be implemented using less expensive equipment designed employing photodiode.19,20
In this work, we intend to develop an automated multicommuted flow procedure for the determination of bromide in L-alanine employing detection by chemiluminescence. The method is based on the bromide oxidation by chloramine-T followed by the reaction of the formed bromine with luminol causing light emission. The detection is carried out employing a homemade luminometer described elsewhere. 20,21 In this sense, efforts
will be directed to integrate the flow system and the detection unit to obtain a compact and robust equipment. The flow setup will be designed associating an automatic injector and solenoid valves aiming to obtain a versatile analytical module with ability to provided low regent consumption and waste generation.
Experimental
Reagent and solutions
All chemicals were of analytical grade. Purified water presenting electric conductivity less than 0.1 µS cm-1 was
used throughout.
A 0.2 mol L-1 carbonate buffer solution was prepared
by dissolving 13.8 g of K2CO3 in water (500 mL) and adjusting pH to 10.5 using a 0.1 mol L-1 HCl solution. A
0.2 mol L-1 sodium nitrate was prepared by dissolving 8.5
g of solid in water (500 mL). A 1.0 mmol L-1 luminol
solution was prepared by dissolving 35 mg of salt (Sigma) in 200 mL of carbonate buffer solution. This solution was prepared 24 hours before use and it was maintained in a freezer at 4 oC.
Solutions containing 0.01, 0.10, 1.00 and 2.00% (m/v) chloramine-T were prepared by dissolving the appropriate mass of three-hydrated chloramine-T (Merck) in 100 mL of water.
A 100.0 mg L-1 bromide stock solution was prepared
by dissolving 0.1398 g KBr (Merck) in 1000mL of water. Prior to solution preparation an amount of salt was maintained at 70 ºC into a stove for 2 h. Working standard solutions 0.0, 0.10, 0.20, 0.40, 0.60, 0.80, 1.00, 1.50 and 2.00 mg L-1 were daily prepared by dilution with water or
in 0.1% (m/v) L-alanine solution.
Samples of solid L-alanine were supplied by the Laboratory of Aminoacid Synthesis (Centro de Energia Nuclear na Agricultura-USP). Solutions 0.1% (m/v)
L-alanine were prepared everyday by dissolving 0.1 g of solid in 100 mL.
Apparatus
The equipment set up comprised a Pentium III microcomputer furnished with an interface card (PCL711S, Advantech Corp) for control and data acquisition; an IPC-8 Ismatec peristaltic pump furnished with Tygon pumping tubes; two three-way solenoid valves (161T031, Nresearch); a homemade automatic injector;22
a home made luminometer;20,21 a column machined in
acrylic presenting as dimension 15 mm long and 5 mm inner diameter, packed with the anionic resin AG1-X8; reaction coils and flow lines were of polyethylene tubing; and a stabilized 12 V power supplier to feed the solenoid valves. A homemade electronic interface to drive the automatic injector and the solenoid valves based on the integrated circuit ULN2803 that was wired to the output port of the PCL711S interface card by mean of a multi-line flat cable.
Procedure
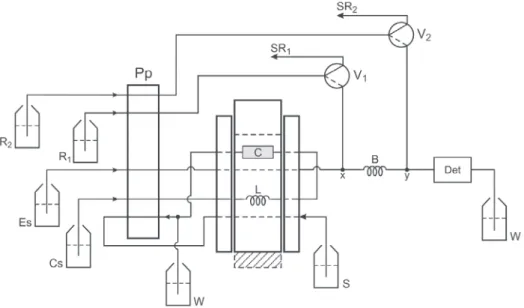
The system manifold was designed employing an automatic injector and two three-way solenoid valves and its flow diagram is shown in Figure 1. The flow system was controlled by the microcomputer running a software written in Quick BASIC 4.5. The sliding-bar of the injector (central part) was displaced to sampling position and to inserting position and vice-verse by the microcomputer. The control signals to drive the solenoids of the injector were sent though the PCL771S interface card. The solenoids were attached to injector sliding-bar as described elsewhere,22 which were not shown to simplify the diagram
of the system.
When the software was run, the first action carried out was the displacement of the injector sliding-bar to the sampling position (shadow surface) to fill the sampling loop (L) with sample (standard) solution. After a preset time interval, the sliding-bar was displaced to the inserting position showed in Figure 1.
and SR2, respectively. When the sliding-bar of the injector was displaced to the other resting position (shadow surface), the resin column was aligned with the eluting solution stream (Es). Under this configuration, the eluting solution flowed through the resin column, thus bromide ions ware exchanged by the nitrate ions and displaced through the reaction coil (B) towards the detector (Det). After displacing the sliding-bar the solenoid valves V1 and V2 were switched ON in order to direct the streams of the reagent solutions R1 and R2 towards the joint points
X and Y, respectively. Under this condition, the chloralamine-T merged into the reaction coil (B) together the eluting solution bulk containing the bromide ions. The reaction to form bromine (Br2) occurred while the solutions mixture was transported towards the joint point Y. While the eluate zone cross the joint Y, the luminol solution (R2) was added to them, thus permitting the development of the chemiluminescent reaction.
The electromagnetic radiation emitted was converted to potential difference by the photodiode of the luminometer (Det). The corresponding signal was converted to digital by the PCL771S interface that was read by the microcomputer and stored as an ASCII file to allow further treatment. While the measurement step was in course, a plot of the signal was displayed as time function on the computer screen to allow its visualization at real time.
Results and Discussion
General comments
The dimension of the flow system represented in flow diagram depicted in Figure 1 was maintained throughout. In this sense, the assays implemented to find the best operational conditions involved the following variables: volume of sampling loop; concentration of luminol and chloralamine-T solutions; and time interval to maintain switched ON valves V1 and V2. These variables were selected to study considering that their combined effect could affect the performance of the procedure. Since this type of resin coupling was similar to that described in earlier works,22,23 no experiment concerning to the use of
the ion exchange resin column to separation the bromide ions from the sample matrix was carried out.
Effect of the reagent concentration
The first variables studied were concentrations of chloralamine-T and luminol solutions, which were done maintaining a sampling loop with a volume of 500 µL. The concentration of the chloramine-T solutions were varied from 0.01 up to 2.5% (m/v) while luminol solution was maintained at 10.0 mmol L-1. Afterwards, assays
varying concentration of luminol solution from 0.1 up to Figure 1. Diagram of the Flow System.The three rectangular surfaces is an overview of the automatic injector and the hatched surface indicates the alternative resting position of the sliding-bar (central part); S = sample solution, flow rate at 3.0 mL min-1; Cs = carrier fluid (water), flow rate 3.0 mL
min-1; Es = eluting solution (NaNO
3), flow rate 1.0 mL min
-1; R
1 and R2 = chloramine-T and luminol solutions, respectively, flow rates at 0.4 mL
min-1; Bp = peristaltic pump; W = waste; L = sampling loop (6.5 mL inner volume); Resin column; V
1 and V2 = three-way solenoid valves; SR1 and
5.0 mmol L-1 were carried out using a 0.10% (m/v)
chloramine-T solution. Better result was achieved when chloramine-T solution concentration was 0.10% (m/v) and luminol solution concentration was equal or higher than 1.0 mmol L-1, therefore these values were selected to carry
out further experiments.
Effect of the reaction coil length
It is known that the length of the reaction coil exerts remarkable influence on the mixing condition between sample and reagent solutions and also on the chemical reaction development. In this sense, the performance of the analytical signal can be affected by this parameter. Intending to find the appropriated length of the reaction coil, a set of experiments was implemented using a 5.00 mg L-1 bromide standard solution. The length of the
reaction coil B (Figure 1) was varied from 10 up to 250 cm. The signal generated by the luminometer was constant (70 mV) up to the coil length of 50 cm. When it was higher than this value the analytical signal underwent a decrease that tended to 60 mV when the coil length was higher than 200 cm. Taking into account these results we could suppose that mixing between solutions was efficient and reaction between bromide and chloramine-T was fast. The decrease of signal observed when the length of the reaction coil was higher than 50 cm could be attributed to dispersion effect. The coefficient variation was estimated as 2.0%, therefore indicating that a reaction coil with a length of 10 cm provided an efficient mixing condition. In this sense, a reaction coil with length of 10 cm could be selected aiming to improve analytical throughput.
Effects of the sampling loop volume and of the sample matrix
As L-alanine could affect the signal response for bromide, assays were performed using bromide standard solutions with concentration of 1.0, 2.0 and 3.0 mg L-1
Br– with and without 0.1% (m/v) L-alanine. Under this
condition, no signal was detected when bromide standard solutions were prepared in L-alanine medium, therefore we could suppose that Br2 was consumed reacting with
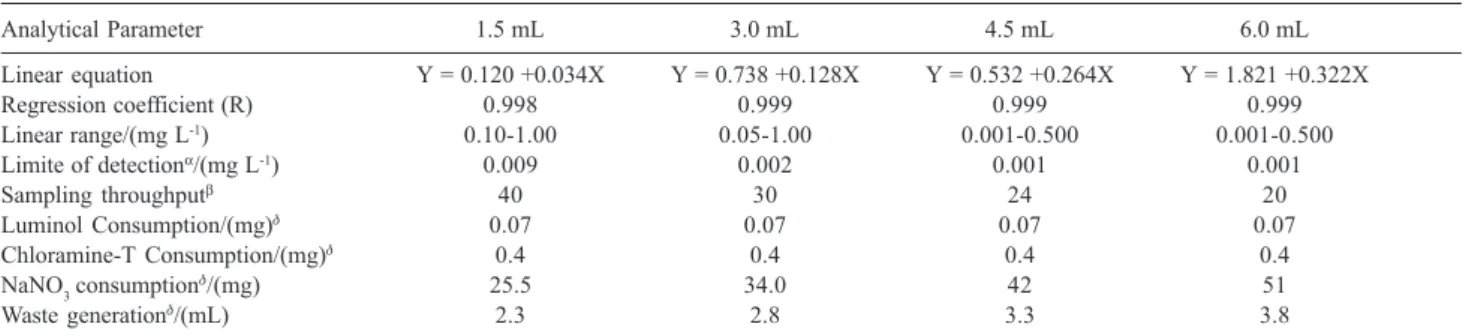
L-alanine, which was the major component of the medium. Aiming to overcome the drawback related above a resin column packed with the anionic AG1-X8 resin was employed. Initially, experiments were performed varying the volume of sampling loop (Figure 1) to verify the response of the resin column to retain bromide ions yielding the results summarized in Table 1. Analysing these results we observe that while volume of sampling loop was increased four times the slope of the linear equations increased nine times. These results show that resin column was enough to remove the analyte from the sample bulk. The increase of the sensitivity compared with sample volume indicated that the elution step was also carried out efficiently. No significant difference between the linearity coefficients of the four linear equations was observed and precision of the measurements was also similar (around 2%), therefore the volume of the sampling loop is a parameter that could be used to improve sensitivity of the analytical procedure.
To verify the ability of the resin to retain bromide ions working in a medium containing L-alanine, a 0.5 mg L-1
bromide standard solution in a 0.1% (m/v) L-alanine medium was processed. The assay was done employing a sampling loop with a volume of 1.5 mL and maintaining the other parameters. Identical experiments were carried out using a 0.5 mg L-1 bromide standard solution without
L-alanine.
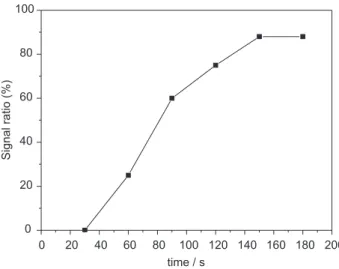
The flow rate of the carrier stream (Figure 1) was maintained at 3.0 mL min-1, therefore a time interval of
30 s should be considered enough to displace the sample aliquot (1.5 mL) from the sampling loop through the resin column towards waste. The curve displayed in Figure 2 shows that under this condition no measurable signal was generated. On other hand, the analytical signal was observed when the time interval to maintain the injector
Table 1. Performance of the flow system as function of the sampling loop volume
Analytical Parameter 1.5 mL 3.0 mL 4.5 mL 6.0 mL
Linear equation Y = 0.120 +0.034X Y = 0.738 +0.128X Y = 0.532 +0.264X Y = 1.821 +0.322X
Regression coefficient (R) 0.998 0.999 0.999 0.999
Linear range/(mg L-1) 0.10-1.00 0.05-1.00 0.001-0.500 0.001-0.500
Limite of detectionα/(mg L-1) 0.009 0.002 0.001 0.001
Sampling throughputβ 40 30 24 20
Luminol Consumption/(mg)δ 0.07 0.07 0.07 0.07
Chloramine-T Consumption/(mg)δ 0.4 0.4 0.4 0.4
NaNO3 consumptionδ/(mg) 25.5 34.0 42 51
Waste generationδ/(mL) 2.3 2.8 3.3 3.8
in the sample displacement position was enlarged. As we can see, the generated signal tended to a constant value when the time interval was equal or higher than 150 s.
The curve showed in Figure 2 was derived considering the ratio between measurements obtained using bromide standard solutions (0.5 mg L-1) prepared without and with
L-alanine (0.1%). As we can see better results correspond to the ratio of 88%, thus indicating that sample matrix hampered the anion exchange resin (AG1-X8) ability to retain bromide ions. This effect could impair the analytical procedure, nevertheless it was minimized preparing sample solutions and working bromide standard solutions containing 0.1% (m/v) L-alanine.
Flow system performance and sample analysis
The performance of the flow system can be evaluated considering the recorders showed in Figure 3. As we can see the two set of records related to bromide standard solutions are identical, no significant base line drift is observed and precision of measurements concerning to sample and standard solutions are similar, therefore Figure 2. Effect of the sample aliquot displacing time through the resin column. Signal ratio obtained using the measurements obtained proces-sing 0.5 mg L-1 bromide standard solutions with and without L-alanine.
Other parameters as indicated in Figure 1. indicating that the long-term stability of the system was very good.
Intending to prove the usefulness of the proposed procedure a set of L-alanine samples was analysed employing a sampling loop (L) with a volume of 6.5 mL. The accuracy was assessed analysing samples that were spiked with a known amount of bromide ions. The results showed in Table 2 presents a recovery in the range between 94 and 104%, therefore indicating that the proposed procedure is reliable. Other profitable features such as a linear response ranging from 0.01 to 1.000 mg L-1 bromide
(r = 0.999); a detection limit of 8.9 µg L-1 Br– estimated as
it was suggested by IUPAC;24 a relative standard deviation
of 3.0% (n = 10) for a typical sample containing 0.327 mg L-1; and regent consumption of 0.07 mg Luminol and 0.4
mg chloramine-T per determination were also achieved.
References
1. Vogel A. I.; Química Orgânica, vol. 2, Ao Livro Técnico: Rio de Janeiro, 1980.
2. Horowitz, B. Z.; J. Toxicol. Clin. Toxicol. 1997,35, 315. 3. Frances, C.; Hoizey, G.; Lamiable, D.; Millart, H.; Trenque,
T.; J. Toxicol. Clin. Toxicol.2003,41, 181. Table 2. Sample analysis and recovery
Sample Bromide insample Spiked amount Bromide after spiking Recovery
(mg L-1) (mg L-1) (mg L-1) (%)
1 0.451 ± 0.006 0.1000 0.549 ± 0.009 98
2 0.221 ± 0.003 0.1000 0.317 ± 0.005 96
3 0.352 ± 0.003 0.1000 0.445 ± 0.004 94
4 0.331 ± 0.006 0.1000 0.437 ± 0.007 106
5 0.471 ± 0.010 0.1000 0.575 ± 0.011 104
6 0.305 ± 0.003 0.1000 0.398 ± 0.009 96
7 0.153 ± 0.002 0.1000 0.256 ± 0.005 103
Results are the average of the three consecutive sample analyses.
4. Ni, Y. N.; Wu, A. G.; Anal.Chim. Acta1999,390, 117. 5. Masadome, T.; Asano, Y.; Nakamura, T.; Talanta1999, 50, 595. 6. Hu, W. Z.; Cao, S. A.; Tominaga, M.; Miyazaki, A.; Anal. Chim.
Acta1996,322, 43.
7. Rantakokko, P.; Nissinen, T.; Vartiainen, T.; J. Chromatog. 1999,
839, 217.
8. Uraisin, K.; Takayanagi, T.; Oshima, M.; Nacapricha, D.; Motomizu, S.; Talanta2006,68, 951.
9. Yonehara, N.; Chaen, S.; Tomiyasu, T.; Sakamoto, H.; Anal. Sci. 1999,15, 277.
10. Anfalt, T.; Twengstrom, S.; Anal. Chim. Acta1986, 179, 453. 11. Borges, E. P.; Lavorante, A. F.; Reis B. F.; Anal. Chim. Acta
2005,528, 115.
12. Jones, D. R.; Talanta 1989, 36, 1243.
13. Yonehara, N.; Kawasaki, A.; Sakamoto, H.; Kamada; M.; Anal. Chim. Acta 1988,206, 273.
14. Yonehara, N.; Chaen, S.; Tomiyasu, T.; Sakamoto, H.; Anal. Sci. 1999, 277.
15. Hu, W. Z.; Cao, S. A.; Tominaga, M.; Miyazaki, A.; Anal. Chim. Acta1996,322, 43.
16. Rantakokko, P.; Nissinen, T.; Vartiainen, T.; J. Chromatogr. A 1999, 839, 217.
17. Sakai, H.; Fujiwara, T.; Kumamaru, T.; Anal. Chim. Acta1996,
331, 239.
18. Borges, E. B.; Reis, B. F.; J. Braz.Chem. Soc. 2005,16, 1226. 19. Pires, C. K.; Reis, B. F.; Galhardo, C. X.; Martelli, P. B.; Anal.
Let. 2003,14, 3011.
20. Rocha, F. P.; Rodenas-Torralba, E.; Reis, B. F.; Morales-Rubio, A.; de la Guardia, A. M.; Talanta 2005,67, 673.
21. Pires, C. K.; Reis, B. F.; Quim. Nova2005,28, 414. 22. Martelli, P. B.; Reis, B.F.; Korn, M.; Rufini, I. A.; J. Braz. Chem.
Soc.1997, 8, 479.
23. Rocha, F. R. P.; Martelli, P. B.; Reis, B. F.; J. Braz. Chem. Soc. 2004, 15, 38.
24. Analytical Methods Committee,Recommendations for the Definition, Estimation and Use of the Detection Limit. Analyst
1987, 112, 199.
Received: August 17, 2006 Web Release Date: October 31, 2007