UNIVERSIDADE FEDERAL DO CEARÁ CENTRO DE TECNOLOGIA
DEPARTAMENTO DE ENGENHARIA QUÍMICA
PROGRAMA DE PÓS-GRADUAÇÃO EM ENGENHARIA QUÍMICA
FEDERICO LEANDRO GRECO MELO
DIFFUSION OF N-PARAFFINS IN CARBONACEOUS MATERIALS
FEDERICO LEANDRO GRECO MELO
DIFFUSION OF N-PARAFFINS IN CARBONACEOUS MATERIALS
Dissertação de Mestrado apresentada no
Programa de Pós-Graduação em
Engenharia Química, da Universidade Federal do Ceará, como requisito parcial para obtenção do título de Mestre em Engenharia Química.
Orientador: Prof. Dr. Moisés Bastos Neto
Coorientador: Prof. Dr. Célio Loureiro
Cavalcante Jr.
Dados Internacionais de Catalogação na Publicação Universidade Federal do Ceará
Biblioteca de Pós-Graduação em Engenharia - BPGE
M485d Melo, Federico Leandro Greco.
Diffusion of n-paraffins in carbonaceous materials / Federico Leandro Greco Melo. – 2015. 74 f. : il. color. enc. ; 30 cm.
Dissertação (mestrado) – Universidade Federal do Ceará, Centro de Tecnologia, Departamento de Engenharia Química, Programa de Pós-Graduação em Engenharia Química, Fortaleza, 2015.
Área de Concentração: Processos Químicos e Bioquímicos. Orientação: Prof. Dr. Moisés Bastos Neto.
Coorientação: Prof. Dr. Célio Loureiro Cavalcante Jr.
1. Engenharia química. 2. Carbono ativado. 3. Difusão. 4. Hidrocarbonetos. I. Título.
ACKNOWLEDGMENTS
I am deeply grateful to my thesis advisor, Professor Moisés Bastos Neto, for his guidance, support, patience, encouragement and trust. I have benefitted from his high standard of accomplishment, his philosophy of research and his open-minded approach to new ideas.
A special thanks to Professor Célio L. Cavalcante Jr. who gave me opportunities that I have never imagined and to trust on me as a master student.
A special thanks to Professor Stefano Brandani and to Professor Enzo Mangano from the University of Edinburgh. Without their support and knowledge the research with ZLC would be tougher than it is.
Thanks to my colleagues and friends at the Universidade Federal do Ceará (UFC) and the research group. Particularly Breno Morais, who helped me during the development of the research and the discussion about the results found.
RESUMO
A profunda compreensão dos mecanismos difusivos em sólidos porosos é essencial para o desenvolvimento de vários processos envolvendo catálise heterogênea. A impregnação de metais em suporte poroso é, geralmente, uma forma eficaz de aumentar a eficiência do catalisador. No entanto, os efeitos de tal procedimento sobre as propriedades de transporte ainda são pouco conhecidos. Zeólitas, sílicas e aluminas são os suportes mais frequentemente utilizados para catalisadores heterogêneos. Atualmente, utilizam-se também carbonos ativados (AC) como suportes, porém, apesar das várias vantagens potenciais (por exemplo, áreas de superfície bastante específicas), pouco tem sido estudado em relação ao comportamento difusivo nestes materiais. A Síntese de Fischer-Tropsch (FTS) é um processo que pode ser beneficiado com a utilização de materiais à base de carbono impregnados. Dessa forma, o método Zero Length Column (ZLC) foi aplicado neste estudo para avaliar a difusão de n-heptano e n-octano, produtos relevantes do FTS, em materiais à base de carbono antes e após a impregnação com Fe com o objetivo de investigar a cinética sob as condições normais de temperatura de FTS e determinar se os produtos do processo apresentam uma resistência significativa para o processo.
ABSTRACT
A deep understanding of the diffusion mechanisms in porous solids is essential to the development of many processes involving heterogeneous catalysis. The impregnation of metals on porous supports is generally an effective way of increasing the catalyst efficiency, but the effects of such procedure on the transport properties are poorly known. Zeolite, silica and alumina are most frequently used as supports for heterogeneous catalysts. Despite the several potential advantages of using activated carbon (AC) as supports (e.g. high specific surface areas), little has been studied regarding diffusion behavior in these materials. The Fischer-Tropsch Synthesis (FTS) is a process which could benefit from the use of carbon-based impregnated materials. The Zero Length Column (ZLC) method was applied in this study to evaluate the diffusion of n-heptane and n-octane, relevant products of the FTS, in carbon-based materials before and after impregnation with Fe. The aim was to investigate the kinetics under the usual temperature conditions of the FTS and determine if the products diffusion poses a significant resistance for the process.
LIST OF FIGURES
Figure 1 - Main resistances to mass transfer in porous solids [24]. ... 22
Figure 2 - Molecular diffusion mechanism [21]. ... 23
Figure 3 - Knudsen diffusion mechanism [21]. ... 24
Figure 4 - Schematic production of PMC1 [44]. ... 30
Figure 5 - ZLC Scheme. ... 33
Figure 6 - ZLC Apparatus. ... 34
Figure 7 - ZLC Column. ... 34
Figure 8 - ZLC Column placed in the system. ... 35
Figure 9 - ZLC experimental signal showing the upper (� ) and lower (�∞) baselines. ... 36
Figure 10 - Plot of normalized concentration versus time. ... 37
Figure 11 - Perfectly mixed cell. ... 39
Figure 14 - N2 adsorption desorption isotherms of: (a) PMC1; (b) PMC2 [45]. ... 45
Figure 15 - N2 adsorption desorption isotherms of: (a) Fe-PMC1; (b) Fe-PMC2 [45]. ... 46
Figure 16 - Pore size distribution of the supports: (a) PMC1; (b) PMC2. GCMC = grand canonical Monte Carlo calculations [45]. ... 47
Figure 17 - Pore size distribution of the catalysts: (a) Fe-PMC1 and (b) Fe-PMC2. GCMC = grand canonical Monte Carlo calculations [45]. ... 47
Figure 18 - SEM microphotographs of Fe-PMC1. ... 49
Figure 19 - SEM microphotographs of Fe-PMC2. ... 49
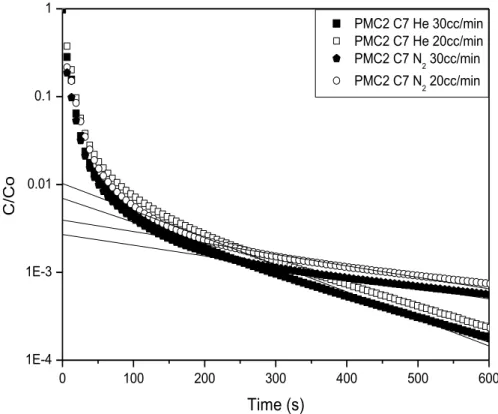
Figure 20 - Comparison of experimental ZLC response curves of PMC1 at Po = 0.0054 bar of n-C7 in two different purge gas (He and N2), 270 ºC, 20 and 30 cc/min. ... 52
Figure 21 - Comparison of experimental ZLC response curves of Fe-PMC1 at Po = 0.0054 bar of n-C7 in two different purge gas (He and N2), 270 ºC, 20 and 30 cc/min. ... 52
Figure 23 - Comparison of experimental ZLC response curves of Fe-PMC2 at Po =
0.0054 bar of n-C7 in two different purge gas (He and N2), 270 ºC, 20 and 30 cc/min.
... 53 Figure 24 - Plot for n-heptane at 270 ºC and Po = 0.0054 bar in the Ft form (a) PMC1
(b) Fe-PMC1. ... 54 Figure 25 - Plot for n-heptane at 270 ºC and Po = 0.0054 bar in the Ft form (a) PMC2
(b) Fe-PMC2. ... 54 Figure 26- Plot of desorption curves for Fe-PMC1 at 270 ºC and Po = 0.0054 bar of
n-C7. ... 55
Figure 27 - Variation of β1 with L according to equation 10. ... 55
Figure 28 - Influence of the saturation time in experimental ZLC desorption curves for PMC2 at Po = 0.0054 bar of n-C7 with He purge gas, 210 ºC, 20 cc/min. ... 59
Figure 29 - Influence of the saturation time in experimental ZLC desorption curves for PMC2 at Po = 0.0054 bar of n-C8 with He purge gas, 240 ºC, 20 cc/min. ... 60
Figure 30 - Influence of the flow rate on desorption plot. ... 61 Figure 31 - ZLC Desorption Curves for n-C8 in PMC2 showing the effects of
temperature. Purge gas He at 73 cc/min. ... 62 Figure 32 - Effect of sample quantity in the macropore reciprocal diffusional time constant. ... 63 Figure 33 - Effect of nonlinear equilibrium on the apparent diffusivity obtained from the application of the LT asymptote analysis. � = 0.1, 0.2, 0.3, 0.4, 0.5, 0.6, 0.7, 0.8 [39]. ... 65 Figure 34 - Desorption response curves of n-C7 in PMC2 at 270 ºC and = 25 ppm.
... 66 Figure 35 - Desorption response curves of n-C7 in PMC2 at 270 ºC and = 5370
LIST OF TABLES
Table 1 - Operational conditions of FTS. ... 19
Table 2 - ZLC historical development. ... 25
Table 3 - Linear paraffins used in this research. ... 30
Table 4 - Experimental temperatures. ... 37
Table 5 - Experimental flow rates. ... 37
Table 6 - Determination of the vapor pressure and initial inlet concentration. ... 38
Table 7 - Textural properties of the adsorbents: BET surface area ( ), pore diameter ( ) and total pore volume (� ) [45]. ... 48
Table 8 - Adsorbents diameter. ... 50
Table 9 - Specific volume. ... 50
Table 10 - Variation of L with flow rate for Fe-PMC1 at different temperatures (Po = 0.0054 bar of n-C7). ... 56
Table 11 - Significance of heat effects in ZLC experiments. ... 58
Table 12 - Determination of the saturation time for PMC2. ... 60
Table 13 - Influence of flow rate in kinetic data for PMC1 at 210 ºC and Po = 0.0054 bar of n-octane. ... 62
Table 14 - Macropore diffusion data of n-C8 in PMC2 at different temperatures. ... 63
Table 15 - Influence of the sample mass in n-C8 diffusion measurements for PMC1 and Fe-PMC1 at 270 ºC and Po = 0.0054 bar. ... 64
Table 16 - Macropore diffusivity of n-C7 in PMC2 at a temperature of 270 ºC in different concentrations. ... 66
Table 17 - Diffusion measurements of n-C7 and n-C8 on the AC supports and on Fe-based catalysts supported on AC. ... 68
ABBREVIATIONS
AC Activated Carbon
BET Brunauer-Emmett-Teller
CNT Carbon Nanotubes
EDS Energy Dispersive X-Ray Spectroscopy
FID Flame Ionization Detector
FTS Fischer-Tropsch Synthesis
GC Gas Chromatograph
GCMC Grand Canonical Monte Carlo
IGC Inverse Gas Chromatography
LT Long Time
MOF Metal Organic Framework
MS Mass Spectrometer
NIST National Institute of Standards and Technology
NMR Nuclear Magnetic Resonance
OD Outer Diameter
PFG Pulsed Field Gradient
PMC Polymeric Mesoporous Carbon
PSD Pore Size Distribution
QENS Quase Elastic Neutron Scattering
SEM Scanning Electron Microscopy
ST Short Time
UFC Universidade Federal do Ceará
UoE University of Edinburgh
NOMENCLATURE
External area/volume for a spherical particle Langmuir parameter
Fluid phase concentration of adsorbate Inlet concentration
Volumetric heat capacity of adsorbent Apparent diffusivity
� Intracrystalline diffusivity
Macropore diffusivity or effective pore diffusivity Knudsen diffusivity
Molecular diffusivity
Overall macropore diffusivity Diffusivity at infinite dilution Pore diameter
� Purge flow rate
ℎ Heat transfer coefficient
Boltzmann constant
Dimensionless Henry constant Defined of equation (10) and (19) Defined of equation (23)
Sample mass inside the ZLC cell
Molecular weight of the diffusing species Nusselt dimensionless number
Total pressure the system
Partial pressure of the diffusing species Adsorbed-phase concentration of adsorbate Adsorbed amount in equilibrium
Maximum capacity
̅ Value of averaged over the crystal
Reynolds dimensionless number Bead radius
BET surface area Time
Temperature
ZLC working temperature
� Volume of the sample holder
� Volume of fluid phase inside the ZLC cell
� Total pore volume
� Adsorbent total volume inside the ZLC cell
�� Specific volume
Greek Letters
Defined of equation (32) Defined of equation (33) Defined of equation (34)
� Nonlinearity parameter
Roots of equation (9)
Roots of equation (9) as a function of
∆� Heat of adsorption
Porosity of the particle
� Macropore tortuosity
� Thermal conductivity
� Characteristic length parameter of the binary pair
�∞ Lower baseline
� Upper baseline
CONTENTS
1 INTRODUCTION ... 17
1.1 Thesis objectives ... 17
2 LITERATURE REVIEW ... 19
2.1 Fischer-Tropsch Synthesis (FTS) ... 19
2.2 Activated carbon (AC) ... 21
2.3 Diffusion mechanisms ... 21
2.3.1 Molecular diffusion ... 23
2.3.2 Knudsen diffusion ... 23
2.4 ZLC historical development ... 24
3 MATERIALS, METHODS AND MODEL ... 29
3.1 Materials ... 29
3.1.1 Adsorbents ... 29
3.1.1.1 Preparation of activated carbon (AC) supports ... 29
3.1.1.2 Preparation of Fe-based catalyst supported on AC ... 30
3.1.2 Hydrocarbons ... 30
3.2 Methods ... 31
3.2.1 Adsorbent Textural Characterization ... 31
3.2.2 Scanning Electron Microscopy couple to Energy Dispersive X-Ray Spectroscopy (SEM-EDS) ... 31
3.2.3 Determination of the specific volume ... 31
3.2.4 Zero Length Column (ZLC) Method ... 32
3.2.4.1 ZLC Data Acquisition ... 35
3.2.4.2 ZLC Experimental Conditions ... 37
3.2.4.3 Zero Length Column (ZLC) Mathematical Model ... 38
4 RESULTS ... 45
4.2 SEM-EDS ... 48
4.3 Specific volume ... 50
4.4 Zero Length Column (ZLC) experimental results ... 51
4.4.1 Determination of the main diffusion path ... 51
4.4.2 Determination of kinetic control... 54
4.4.3 Evaluation of heat effects ... 57
4.4.4 Determination of the saturation time ... 58
4.4.5 Influence of the flow rate in the kinetics of adsorption ... 61
4.4.6 Influence of the temperature in the kinetics of adsorption ... 62
4.4.7 Influence of the adsorbent mass in the kinetic data ... 63
4.4.8 Influence of concentration in the kinetic data ... 64
4.4.9 Diffusion of linear paraffins in activated carbons supports and Fe-based catalysts supported on AC ... 67
4.4.9.1 n-heptane and n-octane ... 67
4.4.9.2 n-dodecane ... 68
4.4.10 Analysis of the diffusion process... 69
5 SUMMARY AND CONCLUSIONS ... 72
1 INTRODUCTION
During the last decades, the energy matrix worldwide is changing considerably. According to this scenario, energy companies are performing a considerable effort to develop new energies sources and to improve the old ones. As a consequence, processes involving the Fischer-Tropsch synthesis (FTS) are getting a special attention due to its hydrocarbons products without contaminants.
Despite its consolidation in industrial processes, FTS still has space for improvements associated with novel catalysts. However, the mechanisms occurring in the porous solids still need to be understood.
Among the different catalytic materials used in the FTS, activated carbons are getting a special attention due to its versatility and complexity. However, there is a lack of studies regarding the diffusion measurements of Fischer-Tropsch products on activated carbons in comparison with hydrocarbon diffusion measurements on zeolites, silicas and aluminum oxides.
For that reason, the present work intends to verify mass transfer limitations of the reactants and products of the FTS catalyzed by activated carbon catalysts along with the creation of a database of diffusion measurements to be applied in further studies. The reactants are the components of synthesis gas (H2, CO and CO2)
and the products are the various hydrocarbons formed, including paraffins corresponding to the range of Diesel (C8+), which are of great interest for the
Brazilian energy matrix today.
In other words, the structure and chemical nature of the activated carbons carry out a great influence on the kinetics of catalytic route of various hydrocarbons substances involved in the FTS, indicating the need for a better comprehension regarding the mass transport properties to improve the development of materials and processes.
1.1 Thesis objectives
2 LITERATURE REVIEW
This chapter will present the main aspects that influenced the development of this work. Initially, the FTS is briefly described in order to show the relevance of its products (high-value hydrocarbons) taking a special attention in catalysts supported on activated carbons. Next, there will be a short description of the studied porous material, indicating its relevance and application on industrial processes. Then, the fundamentals of diffusion mechanisms are presented in order to provide a better knowledge about the resistances and influences that are on FTS products when they get out from the catalyst. Later, among the different macroscopic and microscopic experimental methods to obtain diffusion values, there is a final section presenting a historical ZLC development, indicating the most important works that supported the obtained results.
2.1 Fischer-Tropsch Synthesis (FTS)
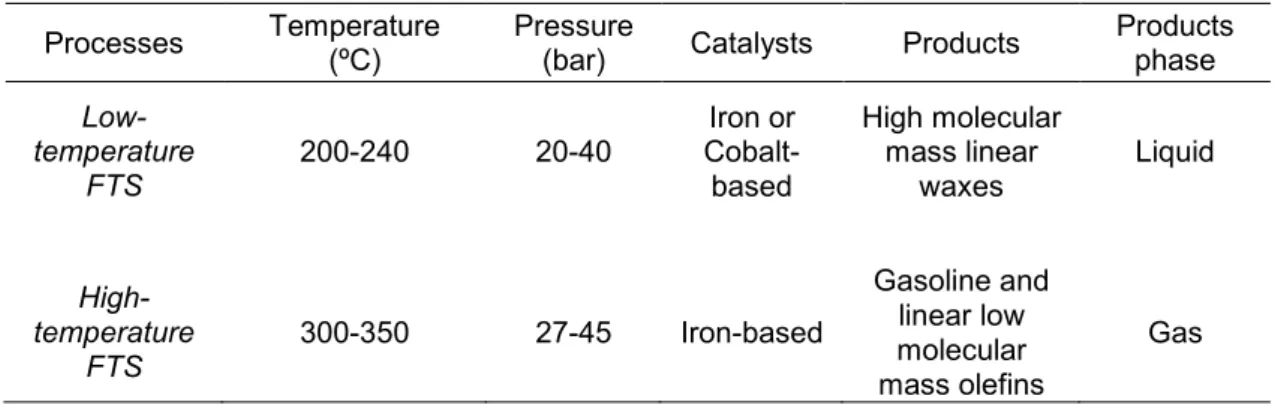
The FTS is a potentially attractive technology that converts syngas to high-molecular-weight hydrocarbons [1], which is usually produced from coal or biomass gasification and from the natural gas reform. FTS occurs in metal catalysts (mainly Fe and Co) supported with or without the use of promoters (Cu, Potassium, Mn, etc.) [2, 3] and currently operates in two modes [4] (Table 1).
Table 1 - Operational conditions of FTS.
Processes Temperature (ºC) Pressure (bar) Catalysts Products Products phase
Low-temperature
FTS 200-240 20-40
Iron or Cobalt-based
High molecular mass linear
waxes Liquid
High-temperature
FTS 300-350 27-45 Iron-based
Gasoline and linear low molecular mass olefins
Gas Source: This research.
water-gas-shift reaction [5], the latter has the advantage of being more active at high pressures, less expensive and also may be more adaptable for biomass syngas (mixtures containing CO2).
The efficiency of the FTS may be improved through the design of new catalysts leading to a higher conversion of syngas, a higher yield of C5+ and a lower
methane selectivity [6-8]. In the FTS, the catalytic activity and selectivity are influenced by the nature and structure of the support; dispersion and metal charge; and the catalyst preparation method [9]. Many efforts have been made in order to better understand the relationship between the textural properties of the support and the performance of the catalysts developed in its corresponding support [2].
Among the most extensively studied supports, it may be included several types of activated carbons, molecular sieves and simple oxides (Al2O3, MgO, SiO2
and TiO2) [2, 10]. In the last years, structures known as carbon nanotubes (CNT -
Carbon nanotubes) as well as an emerging class of materials known as Metal-Organic Frameworks (MOFs) have been considered as possible new supports for various chemical reactions, including FTS [11-14].
Each class of materials has its advantages over the others. Zeolites, aluminum oxides and mesoporous silicas, such as SBA-15 and MCM-41, are more traditional supports and fairly applied in FTS, which is mainly due to good thermal stability. Most recent studies on the production of catalysts from these materials are dedicated to the analysis of the influence of the promoters, the production method and the dispersion of the catalyst, for example, on the catalytic efficiency [15-19]. On the other hand, the low cost, the known high surface area, large pore size distribution and the complex surface chemistry of the activated carbons (AC) [2, 12] are properties that make these materials very attractive for the development of heterogeneous catalysts, despite their low thermal stability.
2.2 Activated carbon (AC)
The importance of activated carbon consists in its versatility because of its high surface area and micropore volume, considering it one of the most complex solids [21].
Activated carbon is a member of a family of carbons ranging from carbon black to carbon fibers but all coming from organic parent sources with different carbonization and manufacturing processes [22]. The term activated carbon (AC) is used to indicate a highly porous material made by thermal decomposition of carbonaceous material followed by a chemical or physical activation [23].
Generally, AC presents a trimodal pore size distribution, but its distribution and the total pore volume are however associated to the pyrolysis and activation initial conditions [24]. Despite their complex pore network, AC has also a complex chemical surface that is associated with its source as well as its activation process [21].
Due to its versatility, AC are widely used in adsorption process, such as the adsorption of organics in decolorizing sugar, water and air purification, separation of gas mixtures and adsorption of gasoline vapors in automobiles [22, 24].
2.3 Diffusion mechanisms
Porous solids are generally consisted of microporous crystals into a macropore pellet. Such solids, when evaluating their kinetics of adsorption, present two diffusional resistances to mass transfer: the micropore resistance and the macropore resistance [24].
Figure 1 - Main resistances to mass transfer in porous solids [24].
In Figure 1, it is presented the different mechanisms of diffusion by regions of porosity. In the region of microporous crystals (pore diameter < 20 Å), the micropore diffusivity or configurational diffusivity or intracrystalline diffusivity is predominant. As a consequence, the diffusion is dominated by interactions between the diffusing molecule and the pore wall [26]. The intracrystalline diffusivity is influenced by steric effects and is considered an activated process. That is, the diffusion mechanism occurs by a sequence of jumps between regions of relatively low potential energy (sites) [26].
2.3.1 Molecular diffusion
According to Ruthven [24], the molecular diffusivity is essentially independent of composition with this type of diffusion becoming significant in large pore sizes and high system pressures; here, molecule-molecule collisions are dominant over the collision between molecules and the wall (Figure 2) and this diffusivity mechanism is dependent of the total pressure and temperature.
Figure 2 - Molecular diffusion mechanism [21].
Molecular diffusion will be the dominant transport mechanism whenever the mean free path of the gas is small relative to the pore diameter.
2.3.2 Knudsen diffusion
Under conditions of low pressure and small pores, the mean free path of the gas is greater than the pore diameter, thus collisions between the molecules and the walls become more relevant than molecule-molecule collisions. The driving force for this transport mechanism is due to molecular collisions and is known as Knudsen diffusion [24].
Figure 3 - Knudsen diffusion mechanism [21].
The Knudsen flux depends mainly on the molecular weight of the diffusing species. Thus, lighter molecules travel faster than the ones with high molecular weight under the same concentration gradient. With this mechanism, it is possible to separate mixtures [21].
2.4 ZLC historical development
Currently, there are several methods to measure molecular migration in porous solids, both at microscopic and macroscopic level.
In general, microscopic methods should be capable to characterize the molecular movement in short intervals of time and distance. It can be pointed out as microscopic method the Nuclear Magnetic Resonance (NMR) with Pulsed Field Gradient (PFG) and Quase Elastic Neutron Scattering (QENS).
On the other hand, macroscopic methods are based on investigation of molecular flow behavior of a system subjected to a concentration gradient according to Fick’s second law of diffusion. Gravimetric method, Membrane technique, Chromatographic method and the ZLC technique are representative of macroscopic methods.
Table 2 - ZLC historical development.
Year Paper Authors
1988 A new experimental technique for measurement of intracrystalline diffusivity Eic and Ruthven [28] 1993 Theory of zero length column chromatography with the condition of a well-stirred sorbing zone Micke et al. [29] 1993 Diffusion of oxygen and nitrogen in 5A zeolite crystals and commercial 5A pellets Ruthven and Xu [30] 1994 Measurement of intracrystalline diffusion by zero length column tracer exchange Hufton et al. [31] 1995 Adsorption of branched and cyclic paraffins in silicalite. 2. Kinetics Cavalcante and Ruthven [32] 1995 Analysis of ZLC desorption curves for liquid systems Brandani and Ruthven [33] 1996 Analysis of ZLC desorption curves for gaseous systems Brandani and Ruthven [34] 1996 Moments analysis of the Zero Length Column method Brandani and Ruthven [35] 1996 Analytical solution for ZLC desorption curves with bi-porous adsorbent particles Brandani [36] 1996 Analysis of ZLC technique of diffusivity measurements in bidisperse porous adsorbent pellets Silva and Rodrigues [37] 1996 and CaX zeolite crystals studied by ZLC and tracer ZLC Transport diffusion and self-diffusion of benzene in NaX
methods Brandani et al. [38]
1998 Effects of nonlinear equilibrium on zero length column experiments Brandani [39] 1998 Heat effects in ZLC experiments Brandani et al. [40] 2000 ZLC measurements under non-linear conditions Brandani et al. [41] 2012 Sorption and kinetics of CO2 and CH4 in binderless beads
of 13X zeolite Silva et al. [42]
2013 Diffusion mechanism of CO2 in 13X zeolite beads Hu et al. [43]
Source: This research.
The ZLC technique was first introduced by Eic and Ruthven [28]. The initial purpose of the technique was to retain the basic advantages of the chromatograph method by following the dimensionless desorption curves while eliminating external intrusions to obtain the intracrystalline diffusivity of strong adsorbed species. In order to verify the consistency of the proposed technique, the results were compared with other methodologies, thus indicating good agreement.
sorbates, thus being necessary a better comprehension of the parameters that may influence the desorption curves.
To obtain the kinetic data, a dimensionless theoretical curve is matched with the ZLC response curve at longer times, thus providing the intracrystalline diffusivity. Such analysis may contain errors in diffusion measurements due to nonlinear conditions, external mass resistances or wrong baseline selection, for example.
For this reason, Micke et al. [29] proposed a complete solution of the ZLC mathematical model including effects of isotherm non-linearity, external mass transfer and adsorbent shape to obtain the intracrystalline diffusivity. According to the author, the complete ZLC model is well described by Volterra integral equations and predicted the ZLC experimental results satisfactory.
In the same year as the study proposed by Micke et al. [29], Ruthven and Xu [30] studied the diffusion on large crystals of zeolites and verified that in such adsorbents, the intracrystalline diffusivity obtained from the ZLC method is insignificant in the sorption kinetics. For this reason, they developed a model in which macropore diffusion is matched with the dimensionless ZLC response curve, indicating that diffusivity is mainly contributed by molecular diffusion at higher temperatures and surface diffusion at lower temperatures.
In the year after, Hufton et al. [31] developed a variant of the ZLC technique. Instead of obtaining the transport diffusivity, the new technique allowed the measurement of the self-diffusivity. That is, replacing the FID by a mass spectrometer (MS), it was possible to measure desorption curves of different species, at the same time, following their decrease in intensities on the MS.
In order to understand the influence of the adsorbate phase and different hydrocarbon chains (branched, cyclic, linear), continuous efforts have been done to sort out its influence on the ZLC response curves.
First, Cavalcante and Ruthven [32] observed that the diffusion of C6
paraffins (single-component) in silicalite is faster for linear single-branched than for cyclic paraffins. Then, Brandani and Ruthven [33] analysed the ZLC desorption curves for a liquid-phase adsorption system indicating that in such system, neglect the external fluid-phase hold-up may provide erroneous diffusion measurements.
with gaseous system, they proposed the analysis at short time (ST) to obtain kinetic parameters and indicated that the initial portion of the desorption curves is less sensitive to the errors derived from baseline drift or heat dissipations when compared with the long time (LT) analysis. However, a comparison between ST and LT analysis should be carried out to check the validity of the data [34].
Among the different analysis to obtain kinetic data from ZLC desorption curves, Brandani and Ruthven [35] proposed a different technique to obtain intracrystalline diffusivities based on the moment analysis of the desorption curves. This technique was considered useful for desorption curves of strong adsorbed species and extracted relevant parameters using the entire desorption curve [35].
Despite the reliable diffusion data obtained by the ZLC technique, the ZLC modelling assumptions were still being verified. Brandani et al. [38] investigated the intrusion of extracrystalline mass transfer limitations in a series of ZLC experiments changing the sample quantity, crystal size, nature of the carrier gas and sorbate partial pressure and thus verified the consistency between the basic ZLC theory and the experiments.
Other important aspect in which compromises the diffusion measurements may be the isothermal condition. Brandani et al. [40] proposed a simple criterion to verify if thermal effects are negligible. Its study showed that heat effects are generally insignificant in intracrystalline diffusivities, but it can become important in the measurement of macropore diffusivities.
Another assumption when modelling ZLC and which may influence the ZLC parameters is the linear adsorption equilibrium. Sometimes, experiments under this condition need a really low pressure of adsorbate, thus providing experimental signal in the range of detector’s error. As a consequence, an increase in the concentration provides a better signal, but may compromise the linear equilibrium assumption when modelling the ZLC.
To check the consistency of the nonlinear model, a paper of Brandani et al. [41] showed that the analytic approximation provided a good representation of the desorption response curves under nonlinear conditions.
Since industrial processes use adsorbents with wide range of pores and taking into account that the ZLC method was successfully in measuring the intracrystalline diffusivity, Brandani [36] and Silva and Rodrigues [37] proposed theoretical models for ZLC desorption curves identifying the various region of control (micropore diffusion, macropore diffusion) in order to better understand which diffusion path is dominant.
As a consequence of the different controlling diffusion mechanisms in the adsorbents, Silva et al. [42] and Hu et al. [43] investigated the kinetics of dioxide carbon in 13X zeolite beads by the ZLC method in order to evaluate the most dominant diffusion mechanism. Both authors interpreted different diffusion mechanism by the ZLC curves for the same sample.
3 MATERIALS, METHODS AND MODEL
In this chapter, the preparation of the used materials, as well as the methods applied to obtain their textural and structural characteristics will be discussed. The following subsections will describe the experimental methods applied during the development of this work, including a full description of the Zero Length Column (ZLC) mathematical model under linear and nonlinear equilibrium conditions.
3.1 Materials
3.1.1 Adsorbents
The samples consist of two polymeric mesoporous carbons (PMC) provided by Adsor-Tech GmbH (Büchler Group) and two Fe-catalysts prepared from them. The polymer based carbons, named PMC1 and PMC2, presented spherical shape and differ from each other by their surface chemistry, since the later was produced from the first through a partial oxidation process [44]. The iron catalysts Fe-PMC1 and Fe-PMC2 were prepared from the corresponding carbons according to procedure described in the literature [45-47].
3.1.1.1 Preparation of activated carbon (AC) supports
Figure 4 - Schematic production of PMC1 [44].
After producing the PMC1, a part of the sample was then oxidized in air at 200 ºC in a batch process producing the PMC2. The oxidation step takes place in order to increase the amount of hydroxyl-, ether-, carboxyl- groups and lactone groups on its surface [49]. With increasing oxidation time, the amount of the mentioned groups increased and turned both activated carbons different in their properties.
3.1.1.2 Preparation of Fe-based catalyst supported on AC
Cruz et al. [45-47] described in details the synthesis of PMC1 and Fe-PMC2 by wet impregnation method followed by a thermal treatment, leading to materials with ca. 50 wt.% load of iron in their structure with an atomic ratio of carbon to iron of AC:Fe = 1:1 [45]. According to the author and its co-workers, these samples
were tested as catalysts for Fischer-Tropsch synthesis and produced satisfactory results [45-47].
3.1.2 Hydrocarbons
Three linear hydrocarbons (Table 3) of the highest purity were purchased from SIGMA-ALDRICH® and applied in the experiments.
Table 3 - Linear paraffins used in this research. Compound name Short name Purity (%)
n-heptane n-C7 ≥99
n-octane n-C8 99
n-dodecane n-C12 ≥99
3.2 Methods
3.2.1 Adsorbent Textural Characterization
In order to determine the total pore volume, average pore diameter and specific surface area, nitrogen adsorption-desorption measurements at -196 ºC were carried out in a BelSorp (Bel Japan INC., Japan) apparatus. Initially, the samples were degassed for 6 hours at 200 ºC under vacuum prior the sorption measurements. From the desorption branch of the isotherms it was possible to obtain the adsorbent textural characteristics [45, 50].
3.2.2 Scanning Electron Microscopy couple to Energy Dispersive X-Ray Spectroscopy (SEM-EDS)
The adsorbents were characterized by SEM-EDS (TES-CAN VEGA XMU) equipped with an EDS BRUKER QUANTAX using an acceleration voltage of 20 kV which provided clear images of the iron catalysts surface as well as their average crystals size and with adequate standards, quantitative analysis of their elemental composition. A more detailed description of the SEM-EDS method and the adsorbents composition is presented in the literature [45-47].
Such analysis along with the N2 adsorption-desorption isotherms were
helpful to understand and evaluate the diffusion mechanism of the hydrocarbons on the studied adsorbents.
3.2.3 Determination of the specific volume
The specific volume of each sample was determined with the aid of a gravimetric apparatus, namely a high-precision magnetic suspension balance (Rubotherm, Germany).
i) The sample (approx. 1 g) is placed in the measuring cell and is then pre-treated in situ at 150 ºC (2 ºC/min heating rate) for at least 5 hours under vacuum. The procedure is monitored by recording the sample mass loss, to ensure a constant sample mass, which is an indication of complete sample activation;
ii) The system is allowed to cool down until the temperature reaches 25 ºC. iii) With the aid of valves, helium, which is assumed not to adsorb at the
working conditions, is allowed into the measuring chamber in order to increase the pressure. The measured sample mass varies until it reaches a stable value, which is then recorded. The gas pressure is increased stepwise and the corresponding mass difference (� ) is plotted against the gas density, estimated with and equation of state [51], which provides as the angular coefficient the sum of hanged volumes (under buoyancy effect).
Before those experiments, the volume � of the balance components (i.e. sample holder, hanging wire, etc.) is determined by performing an experiment, as described in step (iii), using no sample and a gas of known density (e.g. nitrogen). The specific volume of the sample, ��, is then subtracted from the total volume
calculated in step (iii).
3.2.4 Zero Length Column (ZLC) Method
The Zero Length Column (ZLC) method is a simple chromatographic technique developed by Eic and Ruthven [28], from insights of previous studies [52], which aimed to determine intracrystalline diffusivity of a wide range of porous materials by following its desorption curves, eliminating heat transfer and extracrystalline mass transfer resistances [28].
A schematic diagram of the ZLC used in this work is presented in Figure 5. The ZLC analysis is conducted in two consecutive steps. First, the samples are saturated with the diffusing species (i.e. the hydrocarbon under analysis) by the contact with a flow of a saturated stream carried by an inert gas (N2 or He) under
only an inlet of carrier gas, which should purge the diffusing species from the adsorbent due to the generated concentration gradient.
Figure 5 - ZLC Scheme.
Figure 6 - ZLC Apparatus.
Inside the gas chromatograph (GC) oven (Varian, CP-3380), a 2 m-length coil {1/16” outer diameter (OD) SS tube} is connected to the switching valves in order to provide sufficient heat transfer and guarantee that the system will be under isothermal conditions. The ZLC system (Figure 6) has a dead volume of 2.66 cm3 and operates at turbulent flow regime ( > 4000).
A small amount of adsorbent, generally between 1-5 mg, is placed between two sintered discs acting as flow distributors in an 1/8” SS straight union (right-side of Figure 7) connected vertically to an 1/8” OD SS tube (Figure 8) inside the GC oven with a Flame Ionization Detector (FID) attached after the ZLC Column.
The packed ZLC column is presented in Figure 7 (left-side). Besides the adsorbent, the ZLC column is filled with non-adsorbing rock wool and sealed with sintered discs. The non-adsorbing rock wool is used in order to prevent adsorbents, which may deteriorate during the tests, from blocking the discs and to avoid gas bypass [43].
Figure 8 - ZLC Column placed in the system.
Prior to each experimental run, the materials are regenerated by heating them under a helium stream from 25 ºC to 290 ºC over a period of 10-12 hours at a low flow of helium carrier gas to avoid any water or volatile compounds adsorption, which may compromise the experimental response curve of the ZLC experiments.
3.2.4.1 ZLC Data Acquisition
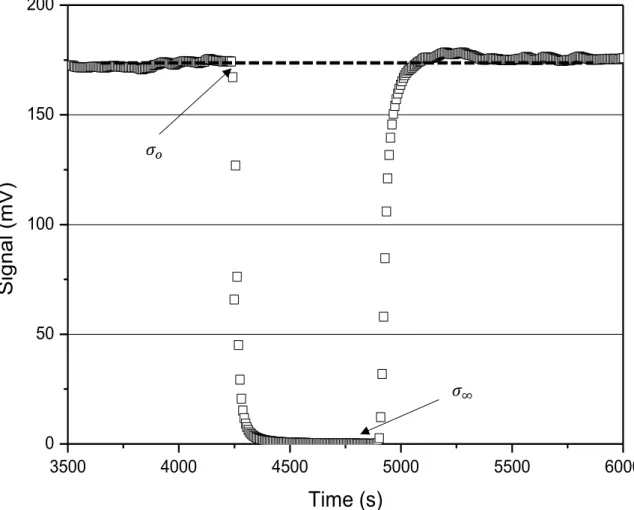
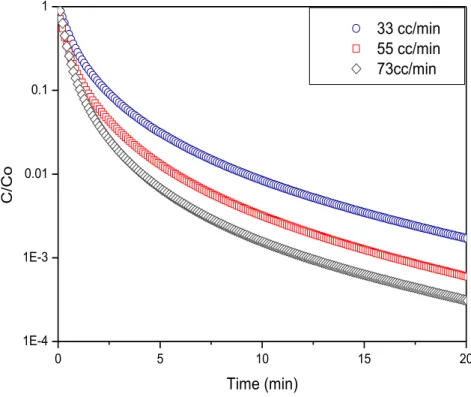
to normalize the signal in order to obtain the dimensionless concentration of the adsorbate.
To normalize the desorption experiment it is necessary to determine the baseline signal values. After defining the baselines and applying equation (1), it is possible to plot the desorption curves (Figure 10) verifying the influence of different conditions in the results.
=
� −�∞� −�∞ (1)
Equation (1) has the upper baseline � which is the average of thirty points of the signal at saturation level before starting the desorption and the lower baseline �∞ which is the last value of the signal when desorption has ended.
3500 4000 4500 5000 5500 6000
0 50 100 150 200
Si
g
n
a
l
(mV)
Time (s)
Figure 9 - ZLC experimental signal showing the upper (�) and lower (�∞) baselines.
�
0 5 10 15 20 1E-4
1E-3 0.01 0.1 1
33 cc/min 55 cc/min 73cc/min
C
/C
o
Time (min)
Figure 10 - Plot of normalized concentration versus time.
3.2.4.2 ZLC Experimental Conditions
The set of ZLC experiments were carried out at temperatures ranging from 210 ºC to 270 ºC (Table 4), under three different helium flow rates in the range of 36-73 cc/min (Table 5) with an initial inlet linear paraffin partial pressure of 0.0054 bar for all adsorbents. The helium flow rates were checked with a soap bubbler in the outlet of the system at each experimental temperature.
Table 4 - Experimental temperatures. Temperature (ºC)
210 240 270
Source: This research. Table 5 - Experimental flow rates.
Flow rate (cc/min) 33
55 73
The hydrocarbon partial pressure was determined according to the temperature set in the thermostat bath using the vapor tables of the National Institute of Standards and Technology (NIST) [53]. Table 6 presents the bath temperatures used for each n-paraffin.
Table 6 - Determination of the vapor pressure and initial inlet concentration. Hydrocarbon Temperature (ºC) Bath Thermostat Vapor Pressure (bar) Initial Concentration (mol cm-3) a
n-heptane -15.68 0.00542 2.53E-7
n-octane 5.00 0.00542 2.34E-7
n-dodecane 74.51 0.00542 1.88E-7
a - Concentration = P/RT; R = 8.31E-2 L bar K-1 mol-1
Source: This research.
This set of conditions was chosen because they are similar to those used in the Fischer-Tropsch reactions (Table 1) being possible to evaluate correctly the products (n-paraffins) diffusion.
3.2.4.3 Zero Length Column (ZLC) Mathematical Model
Mathematical Modelling of Micropore Diffusion at Linear Equilibrium Conditions
The principle of the ZLC technique consists in obtaining adsorption kinetic data by matching the experimental response curve to the dimensionless theoretical curve derived from the appropriate solution of the Fickian equation of diffusion.
Figure 11 - Perfectly mixed cell.
Therefore, considering (i) an isothermal system of uniform spherical particles with (ii) a linear adsorption equilibrium isotherm at the particle surface and (iii) neglecting the external diffusion resistances, the system may be described by the following set of equations:
Fluid-phase mass balance:
�
̅+ �
+ � ∙ =
(2)Solid-phase mass balance:
�
�
=
� ��
+
�
� (3)
and from an overall mass balance in the solid the following relationship holds:
�
̅= �
� ��= (4)
adsorbed-phase concentration of adsorbate; is the fluid phase concentration of adsorbate; ̅ is the value of averaged over the crystal; and the time.
The ZLC system used in this work is a case of gaseous system and in such system, to neglect the accumulation in the fluid phase (� ∙ ⁄ ) is generally a valid approximation due to the low molecular density [54].
The initial and boundary conditions of equations (2) and (3) are:
,
=
= ∙
(5), = ∙
(6)
�
�
, =
(7)In the initial conditions is the inlet concentration; is the adsorbed amount in equilibrium with the initial concentration; is the dimensionless Henry constant.
Equation (2) can be considered as a boundary condition on the solid-phase mass balance {eq. (3)} and can then be rewritten as:
� ��
, +
�, =
(8)The resulting expression for the desorption curve can be readily obtained from separation of variables or from the problem of diffusion in a sphere with surface evaporation [55].
Expressing in terms of the effluent concentration, the resulting solution is given by:
=
∑
exp −� �� � [ + − ] ∞
= (9)
where is given by the roots of the auxiliary equation:
and
=
��
(11)
At longer times (LT), equation (9) reduces to a simple exponential decay curve since only the first term of the series is significant.
=
[ + − ]exp −
� (12)There is a corresponding expression for desorption curves in one-dimensional model or parallel sided adsorbent slab [34, 56]. However, in this work only the spherical model is suitable.
Mathematical Modelling of Micropore Diffusion at Nonlinear Equilibrium Conditions
The basic ZLC modelling assumes linear equilibrium conditions at the surface of the adsorbent, i.e. in the Henry’s law region. Generally for strongly adsorbed species, conditions of linearity may not be achieved, which may provide a misinterpretation of the experimental results due to limitations in the detector’s signal range. In these situations, increasing the initial concentration beyond the linear region is one alternative and is useful to analyse the effect of nonlinearity on the resulting apparent diffusivities ( ) [39, 41]
In order to model such system, Brandani [39] took into account a nonlinear equilibrium based on a Langmuir adsorption isotherm {equation (13)} and assumed that the concentration dependence of the diffusivity may be described according to Darken’s equation {equation (14)}.
,
=
+ (13)Where is the Langmuir parameter; is the diffusivity at infinite dilution and is the maximum capacity. The cell mass balance and the solid phase mass balance follow the governing equations (2), (3) and (4) with the resulting dimensionless equations for the nonlinear ZLC model being presented below:
−�+� −�
�
�� �=
+
−�=
(15)�
��
=
−� ���
+
� ���
+
� −��
��
=
(16)The full solution model is obtained by satisfying the initial and the boundary conditions, which are given by:
=
(17), � =
−�+� (18)�
�� �=
=
(19)where the dimensionless parameters are defined as:
=
� (20)� =
(21)where � is the nonlinearity parameter and is the crystal radius with the dimensionless variables being given by the following set of equations:
In the long time region the following analytic approximation for nonlinear equilibrium conditions that satisfies the long-time asymptote is [39]:
= [ln − � − � + {
�� + � � −
} +
{
+ −} − �]
(23)where is the first root of the auxiliary {eq. (10)} and:
=
−� (24)where is the intercept of a LT asymptote in the case of a tracer exchange [39].
Mathematical Modelling of Macropore Diffusion
The mathematical modelling for macropore diffusion derived from the ZLC desorption curve is obtained from the particle effective diffusivity or macropore diffusivity [43]:
( − )
��+
��=
� ��� (25)where is the overall macropore diffusivity; is the porosity of the particle; � is the tortuosity of the macropores.
In such modelling, the adsorbed phase in the micropores is at linear equilibrium with the gas phase in the macropores, i.e. = ∙ . Thus, equation (25) can be rewritten as:
Therefore, equation (26) can be rearranged to obtain the Fick’s diffusion equation and the effective pore diffusivity or the macropore diffusivity ( ).
� �
=
�
�� (27)
=
+( − )�� ⁄� (28)4 RESULTS
In this chapter, an overview of the different aspects involved in the ZLC experiments are presented, such as the influence of the temperature, the influence of the dead volume, flow rate and saturation time on the obtained kinetic data, as well as the comparison between the diffusivity data when the adsorbate is changed or when the amount of adsorbent is varied. Additionally, textural properties along with SEM-EDS microphotographs previously measured and published [45] are briefly presented in order to better understand the hydrocarbons diffusional behavior in the studied porous solids.
4.1 Adsorbent Characterization
Pore morphology of the studied adsorbents has been previously investigated [45] by measuring nitrogen physisorption isotherms. The isotherm shape provides preliminary information about pore structure [57], which will be useful for the analysis of the kinetic data.
1E-3 0.01 0.1 1
200 400 600 800 1000 V (c m 3 /g ) P/Po PMC1
1E-3 0.01 0.1 1
200 400 600 800 1000 V (c m 3/g ) P/Po PMC2
(a) (b)
1E-3 0.01 0.1 1 0
100 200 300 400
V
(c
m
3 /g
)
P/Po
Fe-PMC1
1E-3 0.01 0.1 1
0 50 100 150 200 250
V
(c
m
3/g
)
P/Po
Fe-PMC2
(a) (b)
Figure 13 - N2 adsorption desorption isotherms of: (a) Fe-PMC1; (b) Fe-PMC2 [45].
According with Cruz et al. [45], PMC1 and PMC2 isotherms (Figure 12) are in accordance with isotherm type IIb with type H4 loop which is a characteristic of an activated carbon isotherm [58] whereas the iron catalysts isotherms (Figure 13), are still of type IIb but with a H3 loop. Hysteresis might be related to the presence of mesoporous structure or inter-particle capillary condensation [24, 45, 58].
Monte Carlo calculations [59, 60] were applied to determine the pore size distribution (PSD) of the samples from the N2 isotherms. The PSD was obtained
0 10 20 30 40 50 60 0.00 0.05 0.10 0.15 0.20 0.25 PMC1
PSD GCMC N2 -196 oC
d V/ d D [ cm³/ g .A]
Pore Diameter (A)
0 10 20 30 40 50 60
0.00 0.05 0.10 0.15 0.20 0.25 PMC2
PSD GCMC N2 -196 OC
d V/ d D [ cm³/ g .A]
Pore Diameter (A)
(a) (b)
Figure 14 - Pore size distribution of the supports: (a) PMC1; (b) PMC2. GCMC = grand canonical Monte Carlo calculations [45].
0 10 20 30 40 50 60
0.000 0.005 0.010 0.015 0.020 Fe-PMC1 PSD GCMC N
2 -196 o C d V/ d D [ cm³/ g .A]
Pore Diameter (A)
0 10 20 30 40 50 60
0.000 0.005 0.010 0.015 0.020 Fe-PMC2
PSD GCMC N2 -196 oC
d V/ d D [ cm³/ g .A]
Pore Diameter (A)
(a) (b)
Figure 15 - Pore size distribution of the catalysts: (a) Fe-PMC1 and (b) Fe-PMC2. GCMC = grand canonical Monte Carlo calculations [45].
After the addition of iron on activated carbon supports, relevant changes in the textural properties were observed, as shown in Table 7. Such a behavior was attributed to a change in the structure of the supports after the wet impregnation and thermal treatment, indicating the formation of aggregated or agglomerated particles that formed pores with non-uniform size and shape [45].
Table 7 - Textural properties of the adsorbents: BET surface area ( ), pore diameter ( ) and total pore volume (� ) [45].
(m2 g-1)
(nm) � (cm3 g-1)
Supports
PMC1 2070 2.6 1.28 PMC2 1937 2.8 1.37
Catalysts
Fe-PMC1 147 2.4 0.23 Fe-PMC2 34 1.7 0.11
Source: Cruz et al. [45].
4.2 SEM-EDS
The morphological aspects concerning the impregnation of iron on the carbon support were evaluated by SEM-EDS. After the wet impregnation and thermal treatment, the iron-based catalysts consisted in globular-like crystals bearing an agglomeration of spherulites [45], as illustrated in Figure 16 and Figure 17. These microphotographs were useful to determine the average diameter of the iron based catalysts.
(a) (b) Figure 16 - SEM microphotographs of Fe-PMC1.
(a) (b)
Table 8 - Adsorbents diameter. Dads (mm)
Supports
PMC1 0.5* PMC2 0.45*
Catalysts
Fe-PMC1 0.352 Fe-PMC2 0.394
Source: This research/*Adsor-Tech GmbH.
Further morphological aspects and properties regarding the impregnation of iron on the supports, e.g. particle distribution and chemical composition, have been discussed in details by Cruz et al. [45].
4.3 Specific volume
The specific volume of each adsorbent is presented in Table 9.
Table 9 - Specific volume.
Vsv (cm3 g-1) Porosity (εp)
Supports
PMC1 0.41 0.76 PMC2 0.387 0.78
Catalysts
Fe-PMC1 0.224 0.51 Fe-PMC2 0.224 0.33
Source: This research.
The specific volume along with the pore volume obtained from the nitrogen physisorption measurements provided the porosity of each adsorbent ( ) [62].
4.4 Zero Length Column (ZLC) experimental results
The experiments carried out in the ZLC are presented in this section including a parametric analysis of the effects on desorption curves, e.g. saturation time, adsorbent mass, temperature, inert purge flow and adsorbate concentration.
4.4.1 Determination of the main diffusion path
In order to evaluate the predominant mass transfer mechanism occurring in the solids, a set of experiments were run under nitrogen and helium flows. According to Hu et al. [43], when desorption curves from different inert carriers do not overlap, there is an indication of macropore diffusion controlling the desorption process. Otherwise, if the desorption curves overlap under similar conditions with different purge gases, the system is controlled by intracrystalline diffusion [28].
From Figure 18 and Figure 19, corresponding to PMC1 and Fe-PMC1, respectively, it is possible to observe that the desorption curves from He and N2 do
not overlap and present a clear discrepancy in the long time asymptote. This desorption behavior indicates macropore diffusion control and is also observed for PMC2 and Fe-PMC2 (Figure 20 and Figure 21, respectively).
For a macropore-controlled system, the macropore reciprocal diffusional time constant derived from the ZLC desorption curves represents ⁄ {based on the bead radius ( )} rather than the micropore reciprocal diffusional time constant
� ⁄ (based on the crystal radius) [30, 43].
0 100 200 300 400 500 600 1E-4
1E-3 0.01 0.1 1
PMC1 C7 He 30cc/min PMC1 C7 He 20cc/min PMC1 C7 N
2 30cc/min
PMC1 C7 N
2 20cc/min
C
/C
o
Time (s)
Figure 18 - Comparison of experimental ZLC response curves of PMC1 at Po = 0.0054 bar of n-C7 in
two different purge gas (He and N2), 270 ºC, 20 and 30 cc/min.
0 100 200 300 400 500
1E-4 1E-3 0.01 0.1 1
Fe-PMC1 C7 He 30cc/min Fe-PMC1 C7 He 20cc/min Fe-PMC1 C7 N2 30cc/min Fe-PMC1 C7 N
2 20cc/min
C
/C
o
Time (s)
Figure 19 - Comparison of experimental ZLC response curves of Fe-PMC1 at Po = 0.0054 bar of n-C7
0 100 200 300 400 500 600 1E-4
1E-3 0.01 0.1 1
PMC2 C7 He 30cc/min PMC2 C7 He 20cc/min PMC2 C7 N
2 30cc/min
PMC2 C7 N
2 20cc/min
C
/C
o
Time (s)
Figure 20 - Comparison of experimental ZLC response curves of PMC2 at Po = 0.0054 bar of n-C7 in
two different purge gas (He and N2), 270 ºC, 20 and 30 cc/min.
0 100 200 300 400 500 600
1E-4 1E-3 0.01 0.1 1
Fe-PMC2 C7 He 30cc/min Fe-PMC2 C7 He 20cc/min Fe-PMC2 C7 N
2 30cc/min
Fe-PMC2 C7 N
2 20cc/min
C
/C
o
Time (s)
Figure 21 - Comparison of experimental ZLC response curves of Fe-PMC2 at Po = 0.0054 bar of n-C7
4.4.2 Determination of kinetic control
After defining the predominant diffusion path, it is necessary to confirm that the system is macropore kinetic controlled under the experimental conditions. That is, the desorption rate is controlled by the diffusion of the sorbate out of the particle.
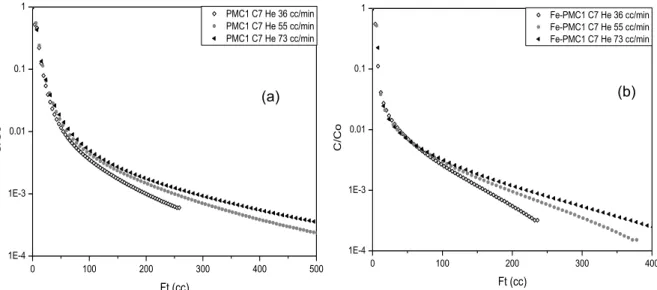
According to Brandani et al. [41], to consider a system under kinetic control, a Ft plot (flow rate multiplied by time) for each adsorbent measured at a given temperature and adsorbate concentration should diverge at higher purge flow rates [41]. This statement is consistent with the following results and confirmed that the system is macropore kinetic controlled.
0 100 200 300 400 500
1E-4 1E-3 0.01 0.1 1
PMC1 C7 He 36 cc/min PMC1 C7 He 55 cc/min PMC1 C7 He 73 cc/min
C
/C
o
Ft (cc)
0 100 200 300 400
1E-4 1E-3 0.01 0.1 1
Fe-PMC1 C7 He 36 cc/min Fe-PMC1 C7 He 55 cc/min Fe-PMC1 C7 He 73 cc/min
C
/C
o
Ft (cc)
Figure 22 - Plot for n-heptane at 270 ºC and Po = 0.0054 bar in the Ft form (a) PMC1 (b) Fe-PMC1.
0 100 200 300 400 500
1E-4 1E-3 0.01 0.1 1
PMC2 C7 He 36 cc/min PMC2 C7 He 55 cc/min PMC2 C7 He 73 cc/min
C
/C
o
Ft (cc)
0 100 200 300 400 500
1E-4 1E-3 0.01 0.1 1
Fe-PMC2 C7 He 36 cc/min Fe-PMC2 C7 He 55 cc/min Fe-PMC2 C7 He 73 cc/min
C
/C
o
Ft (cc)
Figure 23 - Plot for n-heptane at 270 ºC and Po = 0.0054 bar in the Ft form (a) PMC2 (b) Fe-PMC2.
(a) (b)
Another other way to confirm if the system is under kinetic control besides the Ft plot is the evaluation of the parameter. If < , the system is under equilibrium control but if > , the system is kinetic controlled [34].
0 1 2 3 4 5 6
1E-4 1E-3 0.01 0.1 1
0 1 2 3 4 5 6
Time (min)
Fe-PMC1 He 33cc/min Fe-PMC1 He 55cc/min Fe-PMC1 He 73cc/min LT Asymptote
C
/C
o
Figure 24- Plot of desorption curves for Fe-PMC1 at 270 ºC and Po = 0.0054 bar of n-C7.
To obtain the values, the LT analysis was applied and the results are presented in Table 10. When using the LT analysis in the limit of a very high purge flow rate, → ∞ and → π, as presented in Figure 25.
0 100 200 300 400 500
0 1 2 3 4
L
Thus, equation (12) is reduced to:
= exp −
� (30)Where and ⁄ could be determined directly from the intercept and the slope of a semilogarithmic plot of ⁄ vs . The short time (ST) analysis [34] was not applied in this work due to some limitations on the data acquisition software after switching the valves to an inert purge flow thus compromising the diffusivity results.
Despite the evaluation of the parameter and the Ft plot, it is also necessary to check the consistency between the parameter and the flow rate [28]. From Equation (11), at a given temperature, should be proportional to the purge flow rate with the ratios being shown in Table 10.
Table 10 - Variation of L with flow rate for Fe-PMC1 at different temperatures (Po = 0.0054 bar of n
-C7).
Temperature
(ºC) � (cc min-1) ratio * �* ratio 210
36 214.45 1.00 55 298.55 1.39 1.51 73 394.77 1.84 2.00 240
36 163.55 1.00
55 243.02 1.49 1.51 73 320.93 1.96 2.00
270
36 173.42 1.00
55 250.19 1.44 1.51 73 341.45 1.97 2.00 *Relative to values at 36 cc min-1
Source: This research.
4.4.3 Evaluation of heat effects
Heat effects can be minimized using high flow rate (high values). However, this assumption may not be valid for strongly adsorbed species in large particles under conditions of macropore diffusion control [40, 63, 64].
To verify if the desorption curves of this work were influenced only by mass transfer resistances without heat effects, some considerations were done according to Brandani et al. [40] which neglected the heat effects by fulfilling the following condition:
=
|∆�� |ℎ �
<
(31)with , and being given by the following equations:
=
|∆�� | (32)=
|∆�� | (33)=
ℎ � (34)where ∆� is the heat of adsorption; is the volumetric heat capacity of adsorbent particle; is the ZLC working temperature; ℎ is the heat transfer coefficient (= �⁄ for = ); � is the thermal conductivity of carrier gas and is the external area/volume for a spherical particle (= ⁄ ).
Table 11 summarized the approximate estimates of equation (31) for PMC1 and Fe-PMC1. Unfortunately, adsorption equilibrium experiments for the samples were not carried out, thus not providing heats of adsorption from the Van’t Hoff temperature dependence.
results from Díaz et al. [65] which has obtained high values of ∆� for n-heptane and n-octane in mesoporous activated carbon using the inverse gas chromatography (IGC) technique under temperature conditions similar to this work.
Table 11 - Significance of heat effects in ZLC experiments. System Sample Mass
(g)
�
(cm3) a (cm) (mol cm-3) (cm�3 s-1) (kcal mol−�� -1) b ⁄ c
2.53E-07
0.55
15.83
0.012
n-C7-PMC1
210 ºC He
Carrier 0.0015 0.003 0.025 0.92 0.021 1.22 0.027
2.34E-07
0.55 0.020
n-C7-Fe-PMC1
210 ºC He
Carrier 0.0016 0.001 0.0176 0.92 0.033 1.22 0.044
2.53E-07
0.55
18.53
0.005
n-C8-PMC1
210 ºC He
Carrier 0.005 0.008 0.025 0.92 0.008 1.22 0.011
2.34E-07
0.55 0.010
n-C8-Fe-PMC1
210 ºC He
Carrier 0.0042 0.002 0.0176 0.92 0.017
1.22 0.023
a - � = (�
�+ � ) where is the sample mass in grams; b - �� from literature [65]; c - �
from literature [66]. Source: This research.
Therefore, even considering the same heat of adsorption for different samples (PMC1 and Fe-PMC1); the criterion ⁄ < is justified, thus being possible to neglect heat effects on the studied samples.
4.4.4 Determination of the saturation time
was determined. The importance of the saturation time is to distinguish between diffusion controlled and surface controlled systems [34, 67].
If the system is surface resistance controlled, the dimensionless desorption curves are unaffected by the partial loading. In contrast, in a diffusion controlled system, a partial saturation will provide a dimensionless desorption curves that lie below the response curves for a fully equilibrated sample but with the same asymptotic slope [67]. That is, the partial saturation will provide the largest errors in the intercept and therefore the values, thus providing underestimated values. Although, the partial saturation, for high values, provides errors in the macropore diffusivities that are less than 1% [34].
Some important aspects must be considered to obtain the most appropriated saturation time. Brandani and Ruthven [34] proposed that the saturation time has to be at least equal to . ⁄ . From this proposal and taking into account that the diffusivity is temperature dependent [25], it is necessary to evaluate the saturation time at the lowest experimental temperature, otherwise it will be underestimated. To verify the correct saturation time, a set of ZLC experiments were performed varying the equilibration time and the results were compared with the condition proposed above.
0 5 10
1E-3 0.01 0.1 1
0 5 10
Time (min)
PMC2 C7 He 20 cc/min Saturation time 20 min PMC2 C7 He 20 cc/min Saturation time 30 min PMC2 C7 He 20 cc/min Saturation time 40 min
C
/C
o
Figure 26 - Influence of the saturation time in experimental ZLC desorption curves for PMC2 at Po =
0 5 10 15 20 25 1E-4
1E-3 0.01 0.1 1
0 5 10 15 20 25
Blank C8 He 73 cc/min
PMC2 C8 He 20 cc/min Saturation time 25 min PMC2 C8 He 20 cc/min Saturation time 40 min
C
/C
o
Time (min)
Figure 27 - Influence of the saturation time in experimental ZLC desorption curves for PMC2 at Po = 0.0054 bar of n-C8 with He purge gas, 240 ºC, 20 cc/min.
It was considered that all adsorbents in this work have the same saturation time for each adsorbate, 30 min for n-heptane and 35 min for n-octane. The increase in saturation time for n-octane was due to the amount of adsorbent packed inside the ZLC column, however such condition did not influence any diffusion measurement as can be seen in further sections.
From Figure 26 and Figure 27 and the results of Table 12, one may see that the saturation time was experimentally correct.
Table 12 - Determination of the saturation time for PMC2. Hydrocarbon Temperature (ºC) / (s-1) Saturation time
(min)
n-heptane
210 5.18E-04 13.4 240 6.17E-04 11.2 270 8.39E-04 8.3
n-octane
210 2.02E-04 34.4 240 2.46E-04 28.2 270 2.68E-04 25.9
Another aspect that can be evaluated is to check if the dead volume influence the desorption process. This may be verified for the blank runs (without adsorbent) in Figure 27, of which the response curves are clearly faster, thus indicating no influence on the results of the adsorbent desorption curves.
4.4.5 Influence of the flow rate in the kinetics of adsorption
Under conditions of kinetic control the reciprocal diffusional time constant determined from the asymptotic slope of the plot / vs should be independent of flow rate [38, 67] because as established on a previous section, at higher values,
→ �.
0 5 10 15 20 25
1E-3 0.01 0.1 1
0 5 10 15 20 25
Blank C8 He 73 cc/min PMC1 C8 33cc/min PMC1 C8 55cc/min PMC1 C8 73cc/min LT Asymptote
C
/C
o
Time (min)
Figure 28 - Influence of the flow rate on desorption plot.

![Figure 12 - N 2 adsorption desorption isotherms of: (a) PMC1; (b) PMC2 [45].](https://thumb-eu.123doks.com/thumbv2/123dok_br/15334770.557576/45.892.155.764.715.1102/figure-n-adsorption-desorption-isotherms-pmc-b-pmc.webp)
![Figure 13 - N 2 adsorption desorption isotherms of: (a) Fe-PMC1; (b) Fe-PMC2 [45].](https://thumb-eu.123doks.com/thumbv2/123dok_br/15334770.557576/46.892.154.760.160.542/figure-adsorption-desorption-isotherms-fe-pmc-fe-pmc.webp)
![Figure 14 - Pore size distribution of the supports: (a) PMC1; (b) PMC2. GCMC = grand canonical Monte Carlo calculations [45]](https://thumb-eu.123doks.com/thumbv2/123dok_br/15334770.557576/47.892.134.804.133.539/figure-pore-distribution-supports-canonical-monte-carlo-calculations.webp)