*Correspondence: P. R. S. Ribeiro. Centre for Social Science, Health and Technology, Universidade Federal de Maranhão. Rua Urbano Santos, s/n - Centro, 65900-000 - Imperatriz - MA, Brasil. E-mail: [email protected]
A
vol. 50, n. 3, jul./sep., 2014 http://dx.doi.org/10.1590/S1984-82502014000300017
Development and validation of a simple spectrophotometric
method for the determination of methyldopa in both bulk and
marketed dosage formulations
Paulo Roberto da Silva Ribeiro
*, Reginária Morais Duarte
Centre for Social Science, Health and Technology, Federal University of Maranhão, Imperatriz, MA, Brazil
A simple, precise, sensitive, rapid, speciic and economical spectrophotometric method was developed to determine methyldopa (MTD) content in bulk and pharmaceutical dosage formulations. The proposed method was based on the formation of a colored product from the nitrosation reaction of MTD with sodium nitrite in an acid medium. The resultant nitroso derivative species reacts further with sodium hydroxide and is converted it into a more stable compound. This yellow nitrosation product exhibited an absorption maximum at 430 nm. Beer’s Law was obeyed in a concentration range of 6.37 to 82.81 µg mL-1 MTD with an excellent coeficient of determination (R2= 0.9998). No interference was observed from common excipients in formulations. The results showed the method to be simple, accurate and readily applied for the determination of MTD in pure form and in pharmaceutical preparations. The analytical results obtained for these products using the proposed method are in agreement with those of the Brazilian Pharmacopoeia procedure at a 95% conidence level.
Uniterms: Methyldopa/spectrophotometric determination. Pharmaceutical formulations/quality control. Spectrophotometry/qualitative analysis.
Desenvolveu-se método espectrofotométrico simples, preciso, sensível, rápido, especíico e econômico para a determinação do teor de metildopa (MTD) em matéria-prima e em formulações farmacêuticas. O método proposto baseia-se na formação de um produto colorido resultante da reação de nitrosação da MTD com nitrito de sódio em meio ácido. A espécie resultante (nitroso derivado) reage com hidróxido de sódio e é convertida a um composto mais estável de cor amarela. Este produto exibiu máximo de absorção a 430 nm. A lei de Beer foi obedecida na faixa de concentração de 6,37 a 82,81 µg mL-1 de MTD
com excelente coeiciente de determinação (R2 = 0,9998). Não se observou interferência de excipientes
comumente encontrados em formulações farmacêuticas comerciais. Os resultados demonstraram que o método proposto apresenta simplicidade, excelentes precisão e exatidão e pode ser aplicado para a determinação de MTD na sua forma pura e em preparações farmacêuticas. Os resultados analíticos obtidos pelo método proposto estão de acordo com aqueles obtidos pelo método oicial descrito na Farmacopéia Brasileira, a um nível de coniança de 95%.
Unitermos: Metildopa/determinação espectrofotométrica. Formulações farmacêuticas/controle de qualidade. Espectrofotometria/análise qualitativa.
INTRODUCTION
Methyldopa (MTD), chemically known as α-methyl-3,4-dihydroxyphenylalanine (Figure 1), is a catechol derivative (catecholamine) widely used as an
antihypertensive agent. MTD is a centrally acting alpha2
-adrenoreceptor agonist, which reduces sympathetic tone and produces a fall in blood pressure (Hoffman, 2005).
Several types of analytical procedures have been
HO
HO
COOH
NH2
CH3
employed for the analysis of catechol derivatives in pharmaceutical formulations and/or biological specimens. These procedures include: titrimetric determination (Walash, Abououf, Salem, 1982; Mohamed, Salem, 1984;
Amin, 1986; Salem, 1987; Salem, 1993a; Farmacopeia Brasileira, 2010; USP, 2013), gas chromatography (Lee, Hong-You, Fowlie, 1989; Sharma et al., 1996), kinetic
methods (Martinez-Lozano et al., 1991), fluorimetry
(Salem, 1993b), chemiluminescence (Nozaki et al.,
1996; Nozaki et al., 1999), amperometry (Garrido,
Lima, Delerue-Mattos, 1997), high-performance liquid
chromatography (Tsuchiya et al., 1997; Parsons, Kerr,
Weiss, 1998), voltammetric determination (Kozminski et al., 1998) and diffuse relectance spectroscopy (Ribeiro,
Pezza, Pezza, 2006). Some of these methods are complex
for routine analysis and either require expensive or sophisticated instruments or involve procedures entailing rigorous control of the experimental conditions. Most of the titrimetric methods reportedwere indirect titrations and
based on reduction reactions, which suffer interferences from unsaturated organic compounds. The oficial method
reported in the Brazilian Pharmacopoeia (Farmacopeia
brasileira, 2010) and in USP (2013) describes a nonaqueous
titration for the assay of MTD.
Spectrophotometric methods have been proposed for the determination of catecholamines, such as MTD. A differential UV spectrophotometric procedure has also been used for the determination of MTD in pharmaceutical formulations in the presence of germanium
dioxide at 292 nm (Davidson, 1984). MTD has been determined in the visible region after reaction with 2,3,5-triphenyltetrazolium chloride (El-Rabbat, Omar, 1978), potassium bromate (Mohamed, Salem, 1984), vanillin (Salem, 1985), p-dimethylaminocinnamaldehyde
(Walash, Abououf, Salem, 1985), molybdophosphoric acid in sulphuric acid medium (Issopoulos, 1989),
Fe(III), o-phenanthroline (Issopoulos, 1990), ferric
chloride (Zivanovic, Vasiljevic, Radulovic, 1991),
neotetrazolium chloride (Issopoulos, Economou,
1993), metaperiodate (Nevado, Gallego, Laguna, 1995), barbituric acid (Aman et al., 1998), isoniazid in
the presence of N-bromosuccinimide (Nagaraja et al.,
1998), polyphenol oxidase enzyme (Vieira, Fatibello Filho, 1998), diazotized sulfanilamide in the presence of molybdate (Nagaraja, Vasantha, Sunitha, 2001a),
semicarbazide hydrochloride in the presence of potassium
persulfate (Nagaraja et al., 2001b), ammonium molybdate
(Ribeiro et al., 2005a; Ribeiro, Pezza, Pezza, 2005b),
2,2-diphenyl-picrylhydrazyl (Matos, Silva, Ribeiro, 2012)
andferric chloride/nitroso-R-salt (Al Abachi, Hadi, 2013).
However, mostof these methods suffer from several
disadvantages, such as long-waiting times or a heating
step for reaction development, instability of the colored species, complex procedure, requirement for nonaqueous media, poor detection limit, or lack of previous application to pharmaceutical formulations.
The present study reports a simple, precise, sensitive,
rapid, speciic and economical spectrophotometric method
developed to determine the (MTD) content in bulk and pharmaceutical dosage formulations. The proposed
method was based on the formation of a nitrous derivative of MTD. The yellow-colored product had maximum
absorption at 430 nm. The proposed method has none of the disadvantages of interference from the excipients normally
found with MTD in tablet dosage formulations and involves no extraction or heating steps. The method was
used to determine MTD in pharmaceutical formulations. The results obtained by applying the proposed method
showed relatively good agreement with those obtained
using the standard procedure reported in the Brazilian
Pharmacopoeia (Farmacapeia Brasileira, 2010) at a 95% conidence level.
MATERIAL AND METHODS
Apparatus
A Femto Model CIRRUS 80ST spectrophotometer with 1 cm matched silica cells was used for all absorbance measurements. Volume measurements were made with a plunger-operated pipetter (100-1000 µL) and Metrohm model 665 automatic burettes. All experiments
were performed in a thermostatically-controlled room (25±1) °C. A Hanna Model Pack pH 21 digital pH-meter, calibrated with standard buffer solutions, was used for pH
measurements.
Chemicals and reagents
All of the reagents used were of analytical reagent grade. Deionized water was used throughout the
experiments.
A stock solution (MTDS – 318.4 µg ml-1) of MTD
standard (Pharma Nostra – São Paulo, Brazil, purity grade > 99.2%) was prepared daily by dissolving 15.9 mg of the reference substance in water and diluting to the mark in a 50 ml volumetric lask. Working standard solutions were obtained by appropriate dilution of this stock solution with the same solvent and were standardized using the standard
procedure reported in the Brazilian Pharmacopoeia
(Farmacopeia Brasileira, 2010).
placing 2.25 to 0.50 mL of 1.5 × 10⁻³ mol L-1 sodium nitrite,
and 1.0 mL of hydrochloric acid (1.6 x 10⁻² mol L-1) into the lasks which were kept aside for 5 min; then 1.0 mL of sodium hydroxide (5.0 x 10⁻² mol L-1) was added to the solution. After ive minutes, the volume was then made up with deionized water. The absorbance was measured
at 430 nm against the corresponding reagent blank. The
results were plotted as shown in Figure 5, indicating the existence of 1:1 (MTD: sodium nitrite).
Stability study
The stability of the product formed under the
above-mentioned optimum conditions was investigated. For this
study, a reference substance stock solution (50.94 µg mL-1
of MTD) was transferred into a 5 mL calibrated lask and
analyzed according to the recommended procedure for
the calibration curve. This solution was kept for24 h at
room temperature and subsequently analyzed to test for short-term stability.
Intra-day precision (repeatability) and inter-day precision (intermediate precision) studies
MTD tablets were inely powdered and a sample
stock solution (MTDP) of 318.4 µg mL-1 was prepared
following the same dilution pattern of MTDS. Three different aliquots ofMTDP were then diluted to obtain the concentrations of31.84, 44.58 and 57.31 µg mL-1 and analyzed according to the recommended procedure for the
calibration curve. The quantity per tablet was calculated from the standard calibration graph. This procedure was repeated on the two proceeding days.
Specificity in the presence of excipients
To assess the usefulness of the proposed method, the effect of the common components (additives, adjuvants
and excipients) which often accompany MTD in tablet
dosage formulations (silicon dioxide, sodium laureth sulfate, mannitol, sodium metabisulfite, polyethylene glycol, citric acid, lactose, microcrystalline cellulose, croscarmellose sodium, talc, starch and magnesium
stearate) were investigated using the developed method. The ratios of the concentrations of MTD (44.58 µg mL-1)
to the excipient substances were ixed at 1.0 and 10.0.
Procedure for the assay of MTD in pharmaceutical samples
Four market brands of MTD tablets purchased from
local drugstores were randomly selected and analyzed using the newly developed and validated method. For
the determination of MTD in pharmaceutical samples,
the average tablet weight was calculated from the (Merck), sodium hydroxide [5.0 x 10⁻² mol L-1] (Merck),
and hydrochloric acid [1.6 x 10⁻² mol L-1] (Merck) were
prepared and used.
Pharmaceutical formulations (tablets) of four
commercial brands were analyzed. These tablets were purchased from local drugstores and all were tested prior
to their respective listed expiry dates. All pharmaceuticals
studied were package labeled to contain 250 or 500 mg of
MTD per tablet.
The excipients used in the interference study were of
pharmaceutical grade. Thus, sucrose, glucose, talc, fructose, lactose, polyethylene glycol, microcrystalline cellulose, croscarmellose sodium, starch, polyvinylpyrrolidone
and magnesium stearate were purchased from Sigma (St.
Louis, MO, p. a.).
Methodology
Determination of wavelength of maximum absorption A reference substance stock solution (MTDS) (50.94 µg mL-1 of MTD) was transferred into a 5 mL
calibrated flask. In this flask, 1.0 mL of hydrochloric acid (1.6 x 10⁻² mol L-1) and 1.0 mL of sodium nitrite
(0.6 mol L-1) were added and kept aside for 5 min; then
1.0 mL of sodium hydroxide (5.0 x 10⁻² mol L-1) was
added to the solution. After five minutes, the volume
was then made up with deionized water. A spectroscopic scan (400–800 nm) was carried out with this solution to
determine the λmax for the detection of MTD, against the corresponding reagent blank.
Linearity and range
Aliquots of reference substance stock solution
ranging from 6.37 to 82.81 µg mL-1 MTD were transferred to a series of 5.0 mL volumetric flasks. To each flask,
1.0 mL of hydrochloric acid (1.6 x 10⁻² mol L-1) and 1.0 mL of sodium nitrite (0.6 mol L-1) were added and kept aside for 5 min; then 1.0 mL of sodium hydroxide (5.0 x 10⁻² mol L-1) was added to the solution. After ive minutes, the volume was then made up with deionized water. The absorbance was measured at 430 nm against
the corresponding reagent blank. Calibration graphs
were prepared by plotting absorbance against drug
concentration. These graphs or the corresponding linear
least squares equations were used to convert absorbance
into MTD concentration, for any given analyzed sample.
Stoichiometric relationship
Job’s method (Foster, 1969) was applied by placing 0.50 to 2.25 mL of 318.4 µg mL-1 MTD solution into a
contents of 20 tablets that were finely powdered and weighed. A portion of this powder, equivalent to ca. 15.8 mg of MTD was accurately weighed and dissolved in 25 ml of deionized water by shaking for 15 min in a mechanical shaker. The resulting mixture was filtered
and transferred into 50.0 mL graduated flasks, and the
volume completed with deionized water. Aliquots from this solution, containing the equivalent of 44.58 µg mL-1
of MTD, were transferred into 5.0 mL graduated lasks and
analyzed according to the recommended procedure for the
calibration curve. The quantity per tablet was calculated
from the standard calibration graph.
Accuracy/recovery studies
To study the accuracy of the proposed method and determine the interference from the excipients used in the
dosage forms, recovery experiments were carried out by the standard addition method. This study was performed by addition of known amounts (17.19; 19.10; 21.01 and 22.92 µg mL-1, corresponding to levels of 90; 100; 110
and 120%, respectively) of the standard substance (pure drug – MTD) to a known concentration of the previously
analyzed commercial tablets (samples A, B, C and D).
The resulting mixtures were analyzed according to
the recommended procedure for the calibration curve.
The recovery of drug was calculated by comparing the concentration obtained from the spiked mixtures with
those of the pure drug.
RESULTS AND DISCUSSION
Sodium nitrite and hydrochloric acid react to
produce nitrous acid (Figure 2, compound I). Owing to
the presence of phenolic hydroxy groups in compounds
(such as MTD – Figure 1), the reaction of this acid leads to the formation of nitroso derivatives (yellow-colored products – Figure 2, compound III) which are unstable (Suarez, Vieira, Fatibello Filho, 2005). The products
formed in acid media are unstable but can be stabilized
by the interaction with an alkaline reagent to form the highly stable compounds (Figure 2, compound IV). This
indicates that the alkalinisation of the medium gives rise
to the formation of a bathochromic shift, together with a
hyperchromic effect (Belal et al., 1979).
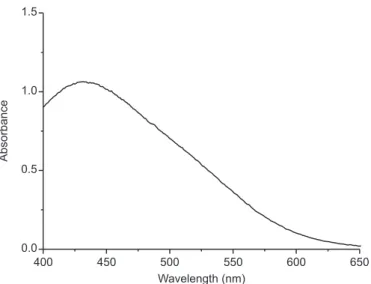
The absorption spectrum of the colored product
shows maximum absorption at 430 nm (Figure 3). Thus, the probable mechanism for the reaction between MTD
(catecholamine) and the sodium nitrite in an acid medium
involves the formation of nitroso derivatives as shown in Figure 2. This type of formation is probably due to the
contribution of an extra pair of unshared electrons in the
interaction with the aromatic nucleus (Daveu et al., 1997;
d’Ischia, Costantini, 1995).
Method development and optimization
The effect of different volumes of the reagent
used was investigated to obtain optimum results for the NaNO2+ HCl HNO2 (I)
HNO2(I) O
H O
H R
O H
O
H R
N O
OH
-(II) (III) (IV) (IV)
R =H2C O
OH
NH2 C
H3
O H
O- R
N
O HO
R
N O
O -(λmax.430 nm)
FIGURE 2 - Suggested mechanism of nitration reaction of MTD.
400 450 500 550 600 650
0.0 0.5 1.0 1.5
Wavelength (nm)
Absorbance
determination of MTD. The optimum conditions were
established based on the development of maximum color intensity and stability upon variation of parameters affecting the nitrosation reaction of MTD by the sodium nitrite in an acid medium.
Using different volumes of HCl and of NaOH, it was found that maximum color intensity and stability were obtained by developing the reactions in 1.0 mL of hydrochloric acid (1.6 × 10⁻² mol L-1) and 1.0 mL of
sodium hydroxide (5.0 × 10⁻² mol L-1), as described in
the recommended procedure. The adopted concentration of sodium nitrite (0.6 mol L-1) was found to be suficient for providing maximum and repeatable color intensity,
but when the concentration of reagent fell below this concentration the absorbance decreased while at higher concentrations the absorbance was not increased.
The order of addition of the reactants recommended in the general procedure produced quantitative results.
Any other order was found to produce deviant results and
reduced color intensity.
Linearity and range
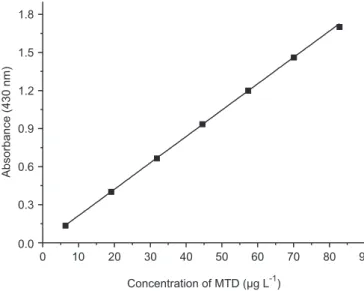
The analytical curve (Figure 4) was obtained by the method of least squares from seven points, each of which was the average of three determinations. The proposed analytical method was validated by evaluating linear
dynamic range, precision, limit of detection (LOD), and limit of quantitation (LOQ). Under the experimental
described, Beer’s law was obeyed in the concentration range from 6.37 to 82.81 µg mL-1 MTD with an excellent
coeficient of determination (R2= 0.9998). The absorbance values for this concentration range were adjusted by the
0 10 20 30 40 50 60 70 80 90 0.0
0.3 0.6 0.9 1.2 1.5 1.8
Concentration of MTD (µg L )-1
Absorbance (430 nm)
FIGURE 4 - Analytical curve for determination of MTD.
0.1 0.2 0.3 0.4 0.5 0.6 0.7 0.8 0.9 0.72
0.74 0.76 0.78 0.80 0.82 0.84
Mole fraction of MTD
Absorbance (430 nm
)
FIGURE 5 - Continuous variation plot for MTD with sodium
nitrite.
equation: A=5.92×10⁻³+20.79×10⁻³ °C, where C is the concentration of MTD in µg mL-1 (molar absorptivity (ε):
4.423 × 10³ mol-1 cm-1). The LOD (3.SD
blank/slope
of curve) and LOQ (10.SDblank/slope of curve) were
2.52 × 10⁻² µg mL-1 and 7.68 × 10⁻²µg mL-1 of MTD, respectively (ICH, 2005).
Determination of stoichiometric relationships
Job’s method of continuous variations (Foster, 1969) was employed for the determination of stoichiometric
relationships:equimolar concentrations of MTD and
sodium nitrite was found to be 1:1 (Figure 5).
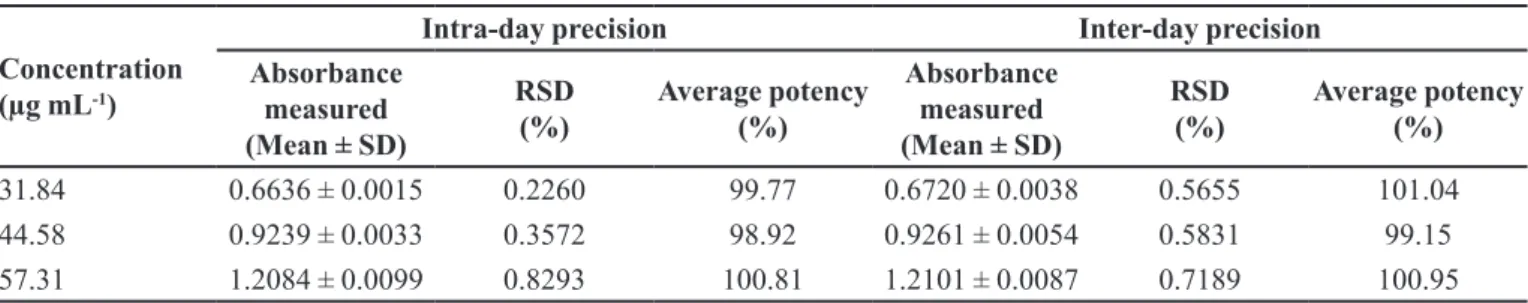
Intra-day and inter-day precision
Assay precision was deined by determining
intra-day and inter-intra-day precision, expressed as relative standard
deviation (RSD). The inter-day variation was evaluated
over 3 days. The intra-day and inter-day precision studies
(Table I) of the developed method conirmed adequate sample stability and method reliability, where all the RSDs were < 2.0%.
Stability
The stability of the product formed under the
range of 20-60 oC. However, a temperature of 25 °C was chosen for the absorbance measurements.
Specificity in the presence of excipients
Since the aim of this study was to determine MTD
in pharmaceuticals, the effects of the most commonly
used excipients were carefully examined. The excipients studied were silicon dioxide, sodium laureth sulfate, mannitol, sodium metabisulite, polyethylene glycol, citric
acid, lactose, microcrystalline cellulose, croscarmellose sodium, talc, starch and magnesium stearate. For this study, solutions containing MTD and each of the excipients taken
separately at concentrations greater than or equal to 10 times that of MTD, were stirred with water in a magnetic mixer for 15 minutes, diluted, iltered when necessary,
and analyzed under the same conditions described in the preparation of analytical curve.
The effect of each excipient was considered interference when the absorbance signal showed an error
greater than or equal to 3.0% in the determination of the
drug. The percentage of MTD found in these solutions
ranged from 99.0 to 100.5%, with coeficient of variation values of less than 2.0% for three replicates, indicating that no interferences were observed under the studied
conditions.
Content of MTD in marketed brands
The samples were prepared using the developed method. The proposed method was successfully applied
for the determination of MTD in four tablet formulations.
The results given in Table III compared favorably with the official method (Farmacopeia Brasileira, 2010), at
95% confidence level, confirming the applicability of the proposed method for the determination of MTD in pharmaceutical dosage forms (tablets).
The results were subjected to a paired comparison test (Miller, Miller, 1993); the data of t and F ratios show
no significant differences between the results of the proposed and the oficial methods, at a 95% conidence
level. The RSD values obtained for the samples ranged
from 0.7 to 3.8%, as shown in Table III. According to Horwitz (1982), the maximum RSD value acceptable for the working level of the analyte (48.58 μg mL-1) is 8.0%. The AOAC (1993) set the maximum acceptable
RSD value at 5.3% for the same analyte level. Therefore, the spectrophotometric method for determination of MTD in pharmaceutical formulations reported in this paper is precise, accurate, and suitable for use in routine analysis.
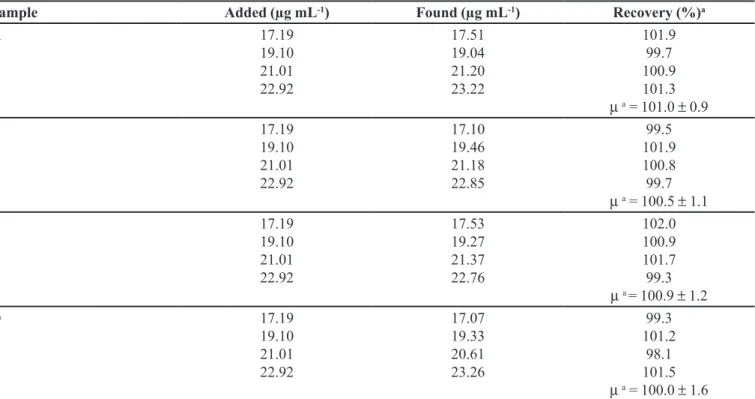
Accuracy/recovery and repeatability studies
In order to investigate the presence of matrix effects and to check the accuracy and precision of the developed
method a recovery study was also carried out. The results
of the recovery tests are given in Table IV. The mean
recovery values for all samples within the 100.0–101.0% range and RSD within 0.9–1.6% conirm an accurate and
precise method for application to pharmaceutical dosage
TABLE I - Intra-day and inter-day precision determined for three different concentrations of MTD (n = 3)
Concentration (µg mL-1)
Intra-day precision Inter-day precision
Absorbance measured (Mean ± SD)
RSD (%)
Average potency (%)
Absorbance measured (Mean ± SD)
RSD (%)
Average potency (%)
31.84 0.6636 ± 0.0015 0.2260 99.77 0.6720 ± 0.0038 0.5655 101.04
44.58 0.9239 ± 0.0033 0.3572 98.92 0.9261 ± 0.0054 0.5831 99.15
57.31 1.2084 ± 0.0099 0.8293 100.81 1.2101 ± 0.0087 0.7189 100.95
TABLE II - Optical stability of the reaction product at room temperature (25 °C)a
Time (min) Absorbance b
0 1.0630
5 1.0624
10 1.0622
15 1.0622
20 1.0635
25 1.0643
30 1.0633
35 c 1.0619
aMTD concentration: 50.94 µg mL-1. bMeasurements taken
at 430 nm against the reagent blank for reactants at room temperature (25 °C), as described in the recommended procedure. cAbsorbance remains unchanged after standing for
TABLE III - Determination of MTD in commercial pharmaceutical preparations
Sample Label valuea Proposed method Oficial method
Found b RSD (%) c t-value (2.78)d F-value (19.00) d Foundb RSD (%)c
A 250.0 274.2 ± 10.4 3.8 1.87 3.00 261.2 ± 6.0 2.3
B 250.0 255.6 ± 5.2 2.0 1.33 1.13 250.1 ± 4.9 2.0
C 500.0 501.0 ± 4.5 0.9 2.65 2.99 493.0 ± 2.6 0.5
D 500.0 499.7 ± 3.5 0.7 2.41 3.78 505.2 ± 1.8 1.4
aLabel for content in tablets: mg unit –1. bAverage value ± standard deviation (SD) of three determinations. cRelative standard
deviation (RSD) of three determinations. dFigures between parentheses are the theoretical values of t and F at P = 0.05.
TABLE IV - Recovery/accuracy data of the proposed method for the pharmaceutical formulations spiked with four different
concentrations of MTD
Sample Added (µg mL-1) Found (µg mL-1) Recovery (%)a
A 17.19
19.10 21.01 22.92
17.51 19.04 21.20 23.22
101.9 99.7 100.9 101.3
µa = 101.0 ± 0.9
B 17.19
19.10 21.01 22.92
17.10 19.46 21.18 22.85
99.5 101.9 100.8 99.7
µa = 100.5 ± 1.1
C 17.19
19.10 21.01 22.92
17.53 19.27 21.37 22.76
102.0 100.9 101.7 99.3
µa = 100.9 ± 1.2
D 17.19
19.10 21.01 22.92
17.07 19.33 20.61 23.26
99.3 101.2 98.1 101.5
µa = 100.0 ± 1.6
a Average ± relative standard deviation (RSD) of three determinations.
forms. Thus, the results indicate no interference from any of the excipients present in tablets.
In the repeatability study, the RSD was 2.0; 1.1; 1.4 and 0.9% for solution (samples A, B, C and D, respectively) containing an equivalent of 44.58 µg mL-1 of MTD (n = 10). These results reveal good precision of
the proposed method.
CONCLUSION
The proposed method represents a very simple, cheap, rapid, precise, accurate, highly sensitive and
environmentally-friendly (low consumption of reagents/
solvents) analytical method for determining MTD in
commercial pharmaceutical preparations with satisfactory recovery. Additionally, the approach fulils all the main requirements of routine analysis as it is robust, has a low
instrumentation and operational cost in comparison to chromatographic methods, and involves no pre-treatment of the sample.
When applied to the assay of various tablet dosage forms, it offers the advantage of not requiring removal
of usual excipients since these did not interfere with the
ACKNOWLEDGEMENTS
We would like to thank the FAPEMA, CNPq and INCUBEM/PROEX/UFMA Foundations (Brazil) for inancial support.
REFERENCES
AL ABACHI, M.Q.; HADI, H. New, simple and validated kinetics spectrophotometric method for determination of methyldopa in its pharmaceutical formulations. Int. J. Recent Sci. Res., v.4, n.4, p.320-324, 2013.
AMAN, T.; KHAN, I.U.; ASLAM, N.; AHMED, I. Spectrophotometric determination of methyldopa in pure and pharmaceutical preparations. Anal. Lett., v.31, n.6,
p.1007-1020, 1998.
AMIN, D. Titrimetric determination of catecholamines and related-compounds via bromine oxidation and substitution. Analyst, v.111, n.2, p.255-257, 1986.
ASSOCIATION OF OFFICIAL ANALYTICAL CHEMISTS. AOAC. Peer veriied methods program: manual on policies and procedures. Arlington: AOAC International, 1993. 17 p.
BELAL, S.F.; EL SAYED, M.A.H.; EL WALILY, A.; ABDINE, H. Spectrophotometric determination of acetaminophen and salicylamide through nitrosation and subsequent chelation. Analyst, v.104, n.1, p.919-927, 1979.
FARMACOPEIA Brasileira. 5.ed. v.2. Brasília: ANVISA, 2010. p.1143-1145.
DAVEU, C.; SERVY, C.; DENDANE, M.; MARIN, P.; DUCROCQ, C. Oxidation and nitration of catecholamines by nitrogen oxides derived from nitric oxide. Nitric Oxide-Biol. Chem., v.1, n.3, p.234-243, 1997.
DAVIDSON, A.G. Difference spectrophotometric assay of 1,2-diphenolic drugs in pharmaceutical formulations. 2. Germanium dioxide reagent. J. Pharm. Sci., v.73, n.11,
p.1582-1584, 1984.
D’ISCHIA, M.; COSTANTINI, C. Nitric oxide-induced nitration of catecholamine neurotransmitters: a key to neuronal degeneration? Bioorg. Med. Chem., v.3, n.7,
p.923-927, 1995.
EL-RABBAT, N.A.; OMAR, N.M. Colorimetric determination of catecholamines by 2,3,5-triphenyltetrazolium chloride.
J. Pharm. Sci., v.67, n.6, p.779-781, 1978.
FOSTER, R. Organic charge transfer complexes. London: Academic Press, 1969. 136 p.
GARRIDO, M.E.; LIMA, J.L.F.C.; DELERUE-MATTOS, C. Flow injection amperometric determination of L-dopa, epinephrine or dopamine in pharmaceutical preparations. J. Pharm. Biomed. Anal., v.15, n.6, p.845-849, 1997.
HOFFMAN, B.B. Catecholamines, sympathomimetic drugs, and adrenergic receptor antagonists. In: HARDMAN, J.G.; LIMBIRD, L.E.; MOLINOFF, P.B.; RUDDON, R.W.; GILMAN, A.G. (Eds.). Goodman & Gilman’s the pharmacological basis of therapeutics. 10.ed. New York:
Mac Graw-Hill, 2005. chap.10, p.163-165.
HORWITZ, W. Evaluation of analytical methods used for regulation of foods and drugs. Anal. Chem., v.54, n.1,
p.67A-76A, 1982.
INTERNATIONAL CONFERENCE ON HARMONIZATION. ICH Q2 (R1): validation of analytical procedures-text and methodology. Geneva: ICH, 2005. 15 p.
ISSOPOULOS, P.B. Spectrophotometric determination of microquantities of carbidopa, levodopa and α-methyldopa using molybdophosphoric acid. Pharm. Acta Helv., v.64, n.3, p.82-85, 1989.
ISSOPOULOS, P.B. High-sensitivity spectrophotometric determination of trace amounts of levodopa, carbidopa and α-methyldopa. Fresen. J. Anal. Chem., v.336, n.2, p.124-128, 1990.
ISSOPOULOS, P.B.; ECONOMOU, P.T. A new high-sensitivity spectrophotometric method for the determination of microconcentrations of α-methyldopa. Farmaco, v.48, n.1, p.127-135, 1993.
LEE, H.B.; HONG-YOU, R.L.; FOWLIE, P.J.A. Chemical derivatization analysis of phenols: determination of chlorinated phenolics in pulp and paper efluents. J. Assoc. Off. Anal. Chem., v.72, n.6, p.979-984, 1989.
MARTINEZ-LOZANO, C.; PÉREZ-RUIZ, T.; TOMAS, V.; VAL, O. Determination of epinephrine, norepinephrine, dopamine and L-dopa in pharmaceuticals by a photokinetic method. Analyst, v.116, n.8, p.857-859, 1991.
MATOS, O.R.; SILVA, F.C.; RIBEIRO, P.R.S. A new, simple and sensitive analytical method for determination of methyldopa in pharmaceutical formulations using the 2,2-diphenyil-picrylhydrazyl. Lat. Am. J. Pharm., v.31, n.2,
p.190-194, 2012.
MILLER, J.C.; MILLER, J.N. Estadística para química analítica, 2.ed. Delaware: Addison-Wesley Iberoamericana,
1993. 209 p.
MOHAMED, W.I.; SALEM, F.B. Spectrophotometric and titrimetric determination of certain adrenergic drugs. Anal. Lett., v.17, n.3, p.191-203, 1984.
NAGARAJA, P.; MURTHY, K.C.S.; RANGAPPA, K.S.; GOWDA, N.M.M. Spectrophotometric methods for the determination of certain catecholamine derivatives in pharmaceutical preparations. Talanta, v.46, n.1, p.39-44,
1998.
NAGARAJA, P.; VASANTHA, R.A.; SUNITHA, K.R. A sensitive and selective spectrophotometric estimation of catechol derivatives in pharmaceutical preparations. Talanta, v.55, n.6, p.1039-1046, 2001a.
NAGARAJA, P.; VASANTHA, R.A.; MURTHY, K.C.S.; RANGAPPA, K.S. Spectrophotometric determination of some aromatic vic-diols in the pharmaceutical formulations. Chem. Anal. (Warsaw), v.46, n.4, p.569-577, 2001b.
NEVADO, J.J.B.; GALLEGO, J.M.L.; LAGUNA, P.B. Spectrophotometric determination of dopamine and methyldopa with metaperiodate by low injection analysis.
Fresen. J. Anal. Chem., v.353, n.2, p.221-223, 1995.
NOZAKI, O.; IWAEDA, T.; KATO, Y. Amines for detection of dopamine by generation of hydrogen peroxide and peroxyoxalate chemiluminescence. J. Biolumin. Chemilumin., v.11, n.6, p.309-314, 1996.
NOZAKI, O.; IWAEDA, T.; MORIYAMA, H.; KATO, Y. Chemiluminescent detection of catecholamines by generation of hydrogen peroxide with imidazole.
Luminescence, v.14, n.3, p.123-127, 1999.
PARSONS, L.R.; KERR, T.M.; WEISS, F. Simple microbore high-performance liquid chromatographic method for the determination of dopamine and cocaine from a single in vivo brain microdialysis sample. J. Chromatogr. B, v.709,
n.1, p.35-39, 1998.
RIBEIRO, P.R.S.; GOMES NETO, J.A.; PEZZA, L.; PEZZA, H.R. Flow-injection spectrophotometric determination of methyldopa in pharmaceutical formulations. Talanta, v.67,
n.1, p.240-244, 2005a.
RIBEIRO, P.R.S.; PEZZA, L.; PEZZA, H.R. Spectrophotometric d e t e r m i n a t i o n o f m e t h y l d o p a i n p h a r m a c e u t i c a l formulations. Eclét. Quím., v.30, n.3, p.23-28, 2005b.
RIBEIRO, P.R.S.; PEZZA, L.; PEZZA, H.R. Determination of methyldopa in pharmaceutical formulations by combined spot test-diffuse relectance spectroscopy. J. Braz. Chem. Soc., v.17, n.4, p.674-679, 2006.
SALEM, F.B. Colorimetric determination of certain sympathomimetic amines. Anal. Lett., v.18, n.9,
p.1063-1075, 1985.
SALEM, F.B. Spectrophotometric and titrimetric determination of catecholamines. Talanta, v.34, n.9, p.810-812, 1987.
SALEM, F.B. Titrimetric and spectrophotometric determination of catecholamines. Anal. Lett., v.26, n.9, p.1959-1966,
1993a.
S A L E M , F. B . S p e c t r o p h o t o m e t r i c a n d f l u o r o m e t r i c determination of catecholamines. Anal. Lett., v.26, n.2,
p.281-294, 1993b.
SHARMA, C.; MOHANTY, S.; KUMAR, S.; RAO, N.J. Gas chromatographic analysis of chlorophenolic, resin and fatty acids in chlorination and caustic extraction stage efluent from kahi-grass. Analyst, v.121, n.12, p.1963-1967, 1996.
SUAREZ, W.T.; VIEIRA, H.J.; FATIBELLO FILHO, O. Determinação de paracetamol em produtos farmacêuticos empregando um sistema de análise por injeção em luxo com geração de ácido nitroso. Eclét. Quím., v.30, n.1,
TSUCHIYA, M.; SATO, M.; KATO, H.; OKUBO, T.; JUNEJA, L.R.; KIM, M. Simultaneous determination of catechins in human saliva by high-performance liquid chromatography. J. Chromatogr. B, v.703, n.1-2, p.253-258, 1997.
UNITED STATES PHARMACOPEIA. 36.ed. Rockville: United States Pharmacopeial Convention, 2013. v.3, p.2889-2890.
VIEIRA, I.C.; FATIBELLO FILHO, O. Spectrophotometric d e t e r m i n a t i o n o f m e t h y l d o p a a n d d o p a m i n e i n pharmaceutical formulations using a crude extract of sweet potato root (Ipomoea batatas (L.) lam.) as enzymatic source. Talanta, v.46, n.4, p.559-564, 1998.
WA L A S H , M . I . ; A B O U O U F, A . ; S A L E M , F. B . Spectrophotometric and titrimetric determination of certain adrenergic drugs, using organic brominating agents. J. Assoc. Off. Anal. Chem., v.65, n.6, p.1445-1451, 1982.
WALASH, M.I.; ABOUOUF, A.; SALEM, F.B. Colorimetric determination of sympathomimetic amines methyldopa and noradrenaline. J. Assoc. Off. Anal. Chem., v.68, n.1,
p.91-95, 1985.
ZIVANOVIC, L.; VASILJEVIC, S.; RADULOVIC, D. Colorimetric assay of methyldopa bulk drug and tablets as Fe(III) complex. Boll. Chim. Farm., v.130, n.5, p.162-165,
1991.
Received for publication on 24th July 2013