N. V. Mahipal Reddy et al. Int. Res. J. Pharm. 2013, 4 (3)
Page 149
INTERNATIONAL RESEARCH JOURNAL OF PHARMACY
www.irjponline.com ISSN 2230 – 8407
Research Article
ANALYTICAL METHOD DEVELOPMENT AND VALIDATION OF METAXALONE IN BULK AND ITS PHARMACEUTICAL FORMULATION BY UV SPECTROSCOPIC METHOD
N. V. Mahipal Reddy, B. Mohammed Ishaq*, V. S. Thiruvengada Rajan, C. Gopinath
Department of Pharmaceutical Analysis and QA, Annamacharya College of Pharmacy, New Boyanapalli, Rajampet, A.P., India
Email: bmdishaq@yahoo.com
Article Received on: 18/01/13 Revised on: 09/02/13 Approved for publication: 01/03/13
DOI: 10.7897/2230-8407.04329
IRJP is an official publication of Moksha Publishing House. Website: www.mokshaph.com
© All rights reserved.
ABSTRACT
Metaxalone, a muscle relaxant used to relax muscles and relieve pain caused by strains, sprains and othermusculoskeletal conditions. A simple, accurate, precise, reproducible, highly sensitive, economic UV spectrophotometric method has been developed for the estimation of metaxalon in bulk and tablet dosage form. In this method metaxalon showed maximum absorbance at 280 nm in methanol. The developed spectrophotometric method was validated in accordance with ICH guidelines. Linearity of the method was found to be 5 - 160µg/ml. The method obeyed Beer’s law in the concentration range of 5 -160 µg/ml. The LOD and LOQ were found to be 3.489μg/ml and 10.575μg/ml respectively. A mean recovery of metaxalon in tablet dosage form was found to be 99.69%.the method was found to be simple, accurate, precise, specific, sensitive, reproducible and can be directly and easily applied to tablet dosage form.
Keywords: Metaxalone, Method Validation, UV- Spectroscopy, ICH guidelines.
INTRODUCTION
Metaxalone is a muscle relaxant used to relax muscles and relieve pain caused by strains, sprains, and other musculoskeletal conditions. Chemically metaxalone is 5-[(3, 5-dimethylphenoxy) methyl]-1, 3-oxazolidin-2-one (Figure 1)1. It is a white to almost white, odorless crystalline powder freely soluble in chloroform, soluble in methanol, 96% ethanol and in propylene glycol, but practically insoluble in ether and water2. Metaxalone has no direct action on the contractile mechanism of striated muscle, the motor end plate, or the nerve fiber. There is very limited or inconsistent data regarding the effectiveness and safety of metaxalone3. Metaxalone is one of the commonly used muscle relaxant therapies for acute low back pain4.
Literature survey carried out revealed that several methods have been reported for estimation of metaxalone by using,, RP-HPLC Method5,6, HPLC7, RP-UPLC Method8, LC-MS Method9, UV spectrophotometric method10, UV Derivative spectrophotometric method11, HPTLC Method12 are available to determine metaxalone in tablet dosage form. However, there is no method reported for estimation of metaxalone in tablet dosage form by using UV spectroscopy.
MATERIALS AND METHODS Instrumentation
A Shimadzu UV –Visible spectrophotometer model 1800 with 1cm matched quartz cells were used for measuring the absorbance.
Chemicals and reagents
Metaxalone pure drug was obtained as a gift sample from MSN Labs, Hyderabad. Tablets of 400mg strength (skelaxi) were purchased from the local market of Rajampet. All the chemicals used were of analytical grade.
Determination of maximum wavelength (λmax)
Preparation of stock solution
Standard stock solution of metaxalone was prepared by dissolving accurately weighed 100mg of metaxalone in
methanol in a 100ml volumetric flask to give a concentration of 1000μg/ml. From this, 10ml of the solution was transferred to a 100ml volumetric flask and made up the volume with methanol to give aconcentration of 100μg/ml which is the standard stock solution.From the above stock solution, pipetted out 6ml and 8ml into 10ml volumetric flask and finally made up the volumewith methanol to produce a concentration of 60μg/ml and 80μg/ml respectively. The samples was then scanned inUV spectrophotometer from a range of 200- 400nm against methanol as blank and the wavelength corresponding tomaximum absorbance in methanol was recorded.
Preparation of sample solution (Assay of marketed formulation)
The proposed method was applied to analyze commercially available metaxalone tablet. Ten tablets were weighed and powdered. The amount of tablet powder equivalent to 250 mg of metaxalone was weighed accurately and transferred to 25ml volumetric flask then 10 ml of methanol was added and kept for 15-20 min with frequent shaking and volume was made up to mark with the same solvent. The solution was then filtered through Whattman filter paper. This filtrate was diluted suitably with solvent to get the solution of 80 μg/ml concentration.
RESULTS
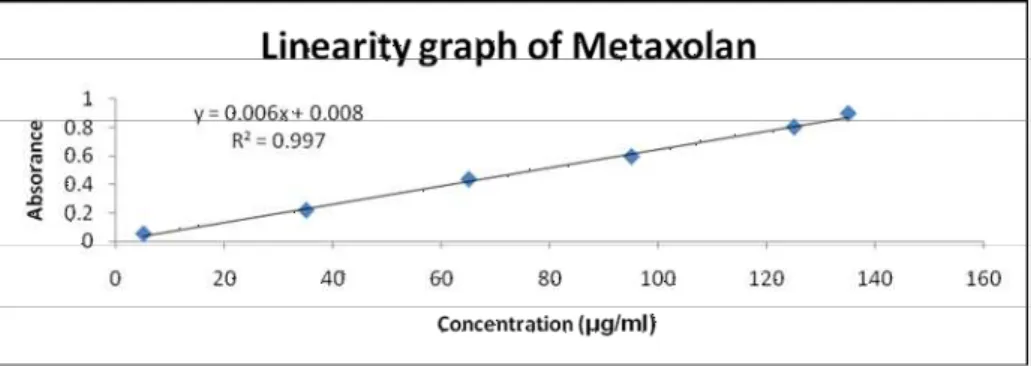
Linearity and Range
N. V. Mahipal Reddy et al. Int. Res. J. Pharm. 2013, 4 (3)
Page 150
Accuracy
Accuracy of the developed method was determined by the recovery study at 3 concentration levels by replicate analysis (n=3). Standard drug solutions were added to a pre-analysed sample solutionand percentage of total drug content was calculated. The results of accuracy studies were reported in Table 2.
Precision
Precision studies were carried out to ascertain the reproducibility of the proposed method. Repeatability was determined by preparing six replicates of same concentration of the sample and the absorbance was measured. Intraday precision study was carried out by preparing drug solution of same concentration and analyzing it at three different times in a day. The same procedure was followed for three different days to determine inter day precision. The results were reported as %RSD. The precision result showed a good reproducibility with percent relative standard deviation less
than 2. The results of intraday and inter day precision studies are shown in (Table 3 and Table 4).
LOQ and LOD
Limit of detection (LOD) is the lowest amount of analyte in the sample that can be detected. Limit of quantification (LOQ) is the lowest amount of analyte in the sample that can be quantitatively determined by suitable precision and accuracy. LOQ and LOD was determined using the following equation LOQ – 10 S/m , LOD – 3 S/m where S is the standard deviation of the response and m is the slope of the related calibration curve. The values of LOD and LOQ was found to be 3.489μg/ml and 10.575μg/ml respectively
Assay of marketed formulation
The optimized concentration of the drug in dosage form, 80μg/ml was determined the absorbance at 280 nm and percentage purity of the metaxolan in tablets was calculated using the following formula:
Percentage purity = X 100
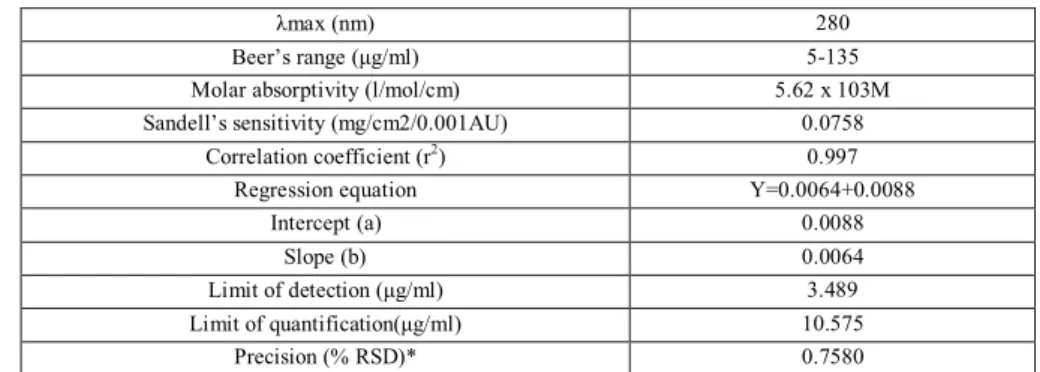
Table 1: Optical characteristics of the proposed method for estimation of metaxalone
λmax (nm) 280
Beer’s range (μg/ml) 5-135 Molar absorptivity (l/mol/cm) 5.62 x 10³M Sandell’s sensitivity (mg/cm2/0.001AU) 0.0758
Correlation coefficient (r2
) 0.997
Regression equation Y=0.0064+0.0088
Intercept (a) 0.0088
Slope (b) 0.0064
Limit of detection (μg/ml) 3.489 Limit of quantification(μg/ml) 10.575
Precision (% RSD)* 0.7580 * Indicates mean of six determinations (n=6); RSD: Relative standard deviation
Table 2: Accuracy data of the proposed method for metaxolan
Amount of sample (µg)
Amount spiked (µg)
Absorbance Amount found
%recovery % Mean Recovery
40 80 0.255 40.02667 99.93333
99.69
80 80 0.475333 80.45 99.43667
160 80 0.937667 160.46 99.70667
Table 3: Intraday assay precision
Concentration(μg/ml) Absorbance1 Absorbance2 Absorbance 3
80 0.477 0.463 0.463
80 0.475 0.458 0.466
80 0.470 0.469 0.460
80 0.476 0.468 0.469
80 0.482 0.466 0.465
80 0.478 0.462 0.462
% RSD 0.825634 0.889702 0.686935
Table 4: Interday assay precision
Concentrations (µg/ml)
Absorbance
Day1 Day2 Day3
80 0.8057 0.9114 0.9234
80 0.8110 0.9128 0.9200
80 0.8099 0.9100 0.9260
N. V. Mahipal Reddy et al. Int. Res. J. Pharm. 2013, 4 (3)
Page 151 Table 5: Assay of marketed formulation
Assay Absorbance %Purity Mean % Purity
Assay1 0.461 101.76 101.11
Assay2 0.459 100.60
Assay3 0.460 100.98
Figure 1: Chemical Structure of Metaxolan
Figure 2: UV spectrum of Metaxalone, showing the λmax at 280 nm.
Figure 3: Linearity graph of Metaxalone
DISCUSSION
The optimized concentration of the drug 80μg/ml was scanned in UV spectrophotometer from a range of 200- 400 nm against methanol as blank and the wavelength corresponding to maximum absorbance in methanol was found to be 280 nm. The developed UV spectroscopic method was then validated according to ICH guidelines and found to be linear over the range of 5-135µg/ml concentration of metaxalone by using methanol as solvent. This method was proved to be accurate and precise as the percentage recovery values was between 99%-101% and the %RSD values for repeatability, intraday precision and inter day precision lie within the limits. LOD and LOQ values were found to be 3.489μg/ml and 10.575 μg/ml respectively. The developed method was highly specific, robust and can be used for routine analysis of metaxalone in tablet formulations.
CONCLUSION
The developed method was found to be sensitive, accurate, precise, reproducible and linear over the concentration range
studied. The proposed method can be used for the routine quality control analysis of metaxalone in bulk and its tablet dosage form.
ACKNOWLEDGEMENTS
Authors are very much thankful to MSN labs, Hyderabad for providing the gift sample of metaxolan. Authors are also thankful to Management and Principal Dr. C. Gopinath, for providing the necessary facilities to carry out the research work.
REFERENCES
1. M.N. Carrol Jr., W.R. Luten, R.W. Southward, The pharmacology of a new oxazolidinone with anticonvulsant, analgesic and muscle relaxant properties, Arch. Int. Pharmacodyn. Ther. 130 (1961) 280–298 2. http://www.medicinenet.com/metaxalone/article.htm Searched on Feb 1st
2013.
3. Chou R, Peterson K and Helfand M, J Pain Symptom Manage., 2004, 28(2), 140-175. http://dx.doi.org/10.1016/j.jpainsymman.2004.05.002 PMid:15276195
4. Toth P E and Urtis J, Clinical Therapeutics, 2004, 26(9), 1355-1367. http://dx.doi.org/10.1016/j.clinthera.2004.09.008 PMid:15530999 5. Prafulla Kumar Sahu, M. Mathrusri Annapurna and Sahoo Dillip
N. V. Mahipal Reddy et al. Int. Res. J. Pharm. 2013, 4 (3)
Page 152
6. Sagar Suman Panda , Debasis Patanaik, Bera V. V. Ravi Kumar; New Stability-Indicating RP-HPLC Method for Determination of Diclofenac Potassium and Metaxalone from their Combined Dosage Form; Sci Pharm. 2012; 80: 127–137. http://dx.doi.org/10.3797/scipharm.1109-16 PMid:22396909 PMCid:3293350
7. Vamsi Krishna Marothu et;al; Kinetics study of metaxalone degradation under hydrolytic, oxidative and thermal stress conditions using stability- indicating HPLC method; Journal of Pharmaceutical Analysis 2012;2(6):431–436. http://dx.doi.org/10.1016/j.jpha.2012.08.004 8. Rakshit Kanubhai Trivedi , Mukesh C. Patel; Development of a
Stability-Indicating RP-UPLC Method for rapid determination of Metaxalone and its degradation products in solid oral dosage form; sci pharm. 2012; 80: 353–366.
9. Kandasamy et al., Bioanalytical Method Development, Validation and Quantification of Metaxalone in Rat Plasma by Liquid Chromatography Tandem Mass Spectrometry; J Bioanal Biomed 2012, S6.
10. Patel et al, Spectrophotometric Estimation of Metaxalone and Diclofenac Potassium by Multicomponent Analytical Method from Tablet Dosage Form; J Anal Bioanal Techniques 2012, 3:3 http://dx.doi.org/10.4172/2155-9872.1000137
11. Ramya et al., UV Derivative spectrophotometric method for simultaneous estimation of Metaxalone And Diclofenac Potassium In combined dosage form Ijpsr, 2012; Vol. 3(11): 4301-4305.
12. Milindkumar P Rajput, Vishal V Bharekar, Savita S Yadav, Toufik S Mulla and Janhavi R Rao; Validated HPTLC Method for simultaneous estimation of Diclofenac Potassium And Metaxalone in bulk drug and formulation; Pharmacie Globale (IJCP) 2011, 12 (04)
Cite this article as:
N. V. Mahipal Reddy, B. Mohammed Ishaq, V. S. Thiruvengada Rajan, C. Gopinath. Analytical method development and validation of Metaxalone in bulk and its pharmaceutical formulation by UV spectroscopic method. Int. Res. J. Pharm. 2013; 4(3):149-152