INTERNATIONAL RESEARCH JOURNAL OF PHARMACY
www.irjponline.com ISSN 2230 – 8407
Research Article
DEVELOPMENT AND VALIDATION OF ANALYTICAL METHOD FOR FLUCONAZOLE AND IVERMECTIN IN TABLET FORMULATION BY USING RP-HPLC
Harod S. Sanjay*, Manocha Nimita, Hingole Ashwin, Dubey P.K.
Department of Pharmaceutical Chemistry, Swami Vivekanand College of Pharmacy, Near Toll Naka, Khandwa Road, Indore, M.P., India
Article Received on: 16/06/12 Revised on: 29/07/12 Approved for publication: 11/08/12
ABSTRACT
A simple, efficient and reproducible RP-HPLC method for the simultaneous determination of Fluconazole and Ivermectin in bulk and tablet formulation has been developed and validated. The separation was carried out using Insertil C18 column (250 mm x 4.6 mm, 5 µ) using Acetonitrile:Methanol:Water (75:15:10 v/v/v) as mobile phase. The flow rate was 1.5 ml/min and detection was carried out 254 nm. The retention time of Fluconazole and Ivermectin were 2.313 and 9.617 respectively. The linear was established in the range of 50-150 µg/ml and 52-156 µg/ml for Fluconazole and Ivermectin respectively. Percentage recoveries for Fluconazole and Ivermectin were found to be 99.830±1.079 and 100.814±1.99 respectively. All the analytical validation parameters were determined and found in the limit as per ICH Guidelines which indicate the validity of the method. The developed method is also found to be precise and robust for the simultaneous determination of Fluconazole and Ivermectin in tablet formulation.
KEYWORDS: Fluconazole, Ivermectin, RP-HPLC, Tablet Dosage Form, Analytical Method Development and Validation.
INTRODUCTION
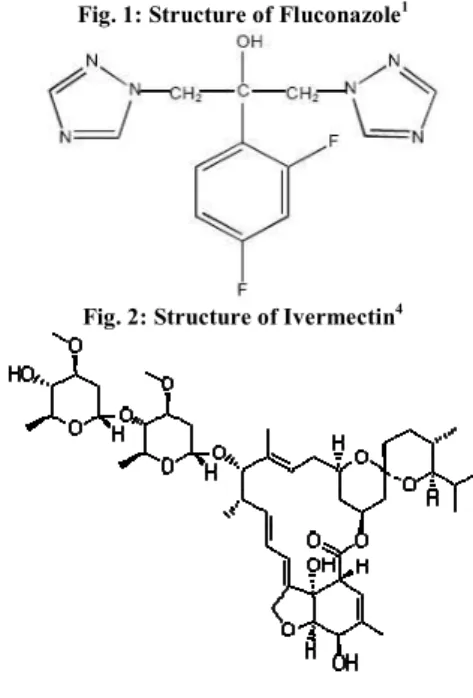
Azole antifungal agents are the largest class of antimycotic available today with more than 20 drugs on the market. Some are primary used topically to treat superficial dermatophytic and yeast infection, whereas others are administered orally for the treatment of systematic fungal infection.1 Fluconazole is chemically 2-(2,4-diflurophenyl)-1,3-bis(1H-1,2,4-triazol-1-yl)-2-propranolol, a synthetic triazole derivatives antifungal agent that has been shown to be effective against a wide range of systemic and superficial fungal infection.2 It has desirable pharmacological properties including a relatively long half-life, the ability to be administered either orally or parenterally.[3] Like other imidazoles and triazoles-class antifungals, Fluconazole inhibits cytochrome P450 enzyme 14α-demethylase. Major advantage of Fluconazole over other antifungal agents is that it can cross the blood-brain barrier.1 Antiparasitic are a class of medications which are indicated for the treatment of parasitic diseases such as nematodes, cestodes, trematodes, infectious protozoa, and amoebas. Ivermectin is a broad-spectrum antiparasitic avermectin medicine. Chemically, Ivermectin is 22,23-dihydroavermectin B1b. Avermectins are basically a series of
16-membered marcocyclic lactone derivatives with potent anthelmintic and insecticidal properties. Ivermectin is traditionally used against worm infections. It also finds it application in veterinary medicine.4
Literature survey reveals a few spectrophotometric and chromatographic methods for the estimation of both drugs as a single component and in combination with other drugs.5-8 However no method has been reported for analysis of these drugs in combined dosage form. The objective of present communication is to develop simple, rapid and precise RP-HPLC method for the estimation of Fluconazole and Ivermectin in combined tablet formulation.
MATERIALS AND METHODS Chemicals
Standard Fluconazole and Ivermectin were collected from Molecule Laboratory, Ahmedabad. Analytical grade solvents and reagents were purchased from SD Fine Chemicals Ltd. Mumbai, India. Nuforce – Plus, Mankind were purchased from local market; each tablet was labeled to contain 150 mg of FLUC and 6 mg of Ivermectin.
Instrumentation
The HPLC method was performed on a Shimadzu HPLC System equipped with LC-20 ATVP Solvent Delivery System pump, SPD M-10 AVP photodiode array detector and Rheodyne Injector system fitted with 20 µl loop.
Chromatographic Condition
The HPLC analysis was performed on reversed-phase high performance liquid chromatographic system with isocratic elution mode using a mobile phase Acetonitrile:Methanol:Water (75:15:10 v/v/v) on Insertil C18 Column (250 mm x 4.6 mm, 5 µ) with 1.5 ml/min flow rate at 254 nm using PDA detector. Spinchrome software was used for data interpretation.
Preparation of Standard Stock Solution
An accurately weighed 100 mg of Fluconazole and 100 mg of Ivermectin were transferred to 10 ml separate volumetric flask and volume was adjust to mark with distilled water to obtain concentration of 1000 µg/ml for Fluconazole and Ivermectin.
Preparation of Sample Solution
Twenty tablets were taken; average weight was determined and mixed well fine powder. Amount equivalent to 100 mg FLUC and 100 mg IVR was taken in 100 ml volumetric flask. This was dissolved in water and sonicate for 3 minutes. The volume was made up to mark with water and filtered through Whatman Filter Paper No. 41. Filtrate was further diluted with solvent to get the final concentration of both drugs on the working range.
Method Validation
The developed analytical method was validated according to the International Conference on Harmonization (ICH) Guidelines for validation of analytical procedures.9-10
Linearity
A series of dilution were prepared in the concentration range of 50-150 µg/ml for FLUC and 52-156 µg/ml for IVR, as per ICH Guidelines. All the solutions were filtered through 0.2
Accuracy
To a pre-analyzed sample solution (100µg/ml for FLUC and 104 µg/ml for IVR), a definite concentration of mixed standard drugs were added. Spiking of concentration of the pre-analyzed sample was done by 80 µg/ml, 100 µg/ml and 120 µg/ml for FLUC and for IVR was done by 83 µg/ml, 104
µg/ml and 124 µg/ml. Triplicate injections for each spiked concentration were injected.9-10
Precision
The repeatability study of the drug was performed for three times in the concentration range of 50-150 µg/ml for FLUC and 52-156 µg/ml for IVR. The intermediate precision was performed by doing day to day variation and analyst to analyst variation. Intermediate precision study of the drug was performed for three times in the concentration range of 50-150 µg/ml for FLUC and 52-156 µg/ml for IVR. As per ICH norms, %RSD for area should be Not More Than 2%.9-10
Robustness
As per ICH norms, small but deliberate variations by altering the operating conditions such as flow rate and/or ratio of the mobile phase were made to check the method’s capacity to remain unaffected. Three injections of 100 µg/ml for FLUC and 104 µg/ml for IVR were injected and flow rate was varied by ±0.2 ml/min. Change in the ratio of mobile phase was done by varying the concentration in range of ±5%. Triplicate injections of formulation were injected and results were analyzed. As per ICH norms, %RSD for area should be Not More Than 2%.9-10
RESULT AND DISCUSSION
The goal of this study was to develop a rapid HPLC method for analysis of Fluconazole and Ivrmectin in its bulk and Tablet formulation using a commonly used reverse phase C18
column. To develop an effective method for the analysis of drug, preliminary tests were performed in order to select adequate and optimum condition parameter such as detection wavelength, ideal mobile phase and its combination. Separation of drugs was achieved by using HPLC system with UV absorbance detector set at 254 nm. Mobile phase used for separation was Acetonitrile:Methanol:Water (75:15:10 v/v/v). Inertsil C18 column (250 mm x 4.6mm, 5 µ)
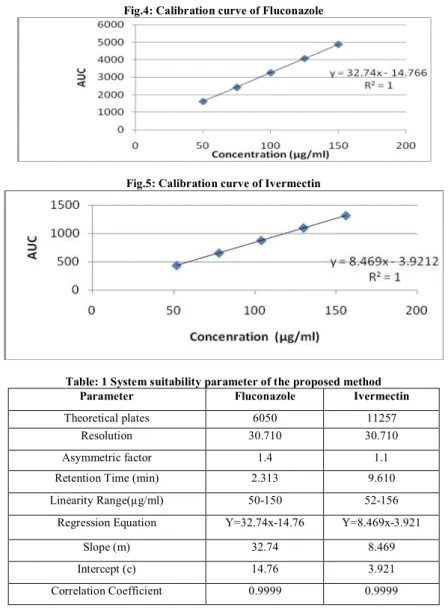
was used a stationary phase containing silica gel. Linearity was observed over a concentration range of 50-150 µg/ml for
Fluconazole and 52-156 µg/ml for Ivermectin. Correlation coefficient was observed 0.999 for both the drugs. In order to validate the accuracy of method, recovery studies were performed. 99.830% and 100.814% amount were recovered for Fluconazole and Ivermectin respectively. The %RSD for area was less than 2, which indicate the accuracy of the method. Precision studies were carried out by studying repeatability studies and intraday precision. %RSD values for areas were observed to be less than 2% and hence it indicates that method is precise. Small and deliberate variations were applied to method parameters in order to assess robustness of the method. %RSD values for area was observed to be less than 2%. This value indicates that method is robust.
CONCLUSION
The following research was done in order to develop a simple, precise and accurate method for analysis of Fluconazole and Ivermectin in bulk and tablet formulation using RP-HPLC. The validation parameters for the analytical method suggest that method is economical and simple and can be used for routine analysis of the drugs.
Fig. 1: Structure of Fluconazole1
Fig. 2: Structure of Ivermectin4
Fig.4: Calibration curve of Fluconazole
Fig.5: Calibration curve of Ivermectin
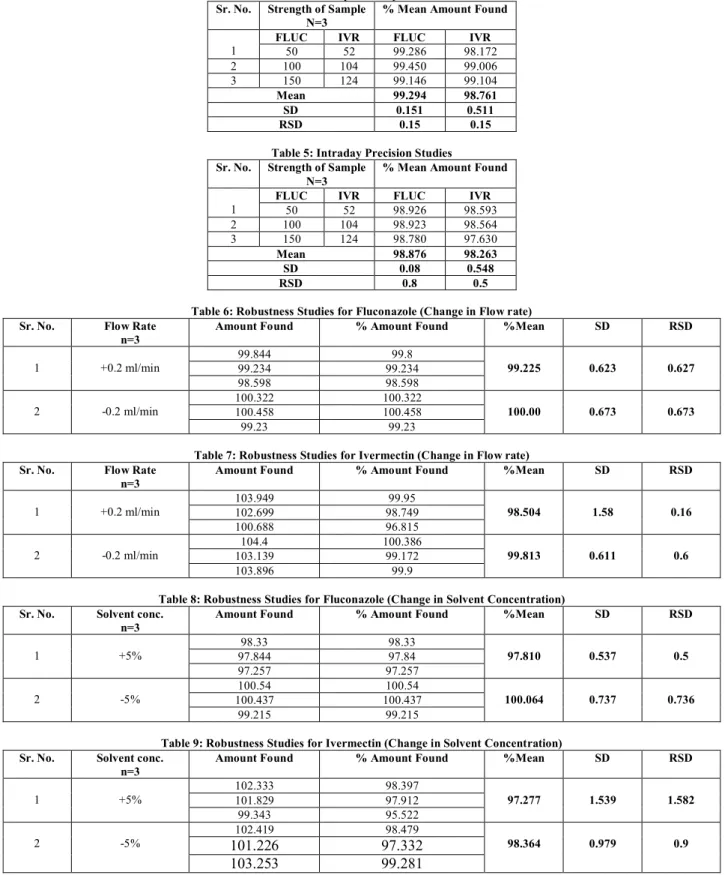
Table: 1 System suitability parameter of the proposed method Parameter Fluconazole Ivermectin
Theoretical plates 6050 11257
Resolution 30.710 30.710
Asymmetric factor 1.4 1.1
Retention Time (min) 2.313 9.610
Linearity Range(µg/ml) 50-150 52-156
Regression Equation Y=32.74x-14.76 Y=8.469x-3.921
Slope (m) 32.74 8.469
Intercept (c) 14.76 3.921
Correlation Coefficient 0.9999 0.9999
Table 2: Accuracy Test Results for Fluconazole Sr. No. Pre-analyzed sample
(µg/ml)
Excess amount added (µg/ml) n=3
AUC Conc. Found (µg/ml)
Amount recovered % Recovery
1 100
80 5901.688 180.710 80.660 100.75
80 5860.421 179.449 79.339 99.17
80 5796.053 178.959 78.849 98.561
2 100
100 6557.438 202.408 102.298 102.298
100 6511.572 199.338 99.228 99.228
100 6466.023 197.946 97.836 97.36
3 100
120 7213.169 222.603 122.493 102.077
120 7162.722 221.049 120.939 100.783
120 7105.478 217.478 117.368 97.806
Mean 99.830
SD 1.707
RSD 1.079
Table 3: Accuracy Test Results for Ivermectin Sr. No. Pre-analyzed sample
(µg/ml)
Excess amount added (µg/ml) n=3
AUC Conc. Found (µg/ml)
Amount recovered % Recovery
1 104
83 1588.003 187.974 83.7 100.95
83 1576.927 186.662 82.48 99.37
83 1559.409 184.594 80.412 96.88
2 104
104 1764.921 208.866 104.684 104.68
104 1752.623 207.408 103.226 103.22
104 1740.386 205.963 101.781 101.78
3 104
124 1944.709 230.089 125.907 101.537
124 1930.611 228.425 124.243 100.195
124 1915.268 226.606 122.424 98.72
Mean 100.814
SD 1.99
Table 4: Repeatability Studies Sr. No. Strength of Sample
N=3
% Mean Amount Found
1
FLUC IVR FLUC IVR
50 52 99.286 98.172
2 100 104 99.450 99.006
3 150 124 99.146 99.104
Mean 99.294 98.761 SD 0.151 0.511 RSD 0.15 0.15
Table 5: Intraday Precision Studies Sr. No. Strength of Sample
N=3
% Mean Amount Found
1
FLUC IVR FLUC IVR
50 52 98.926 98.593
2 100 104 98.923 98.564
3 150 124 98.780 97.630
Mean 98.876 98.263 SD 0.08 0.548
RSD 0.8 0.5
Table 6: Robustness Studies for Fluconazole (Change in Flow rate) Sr. No. Flow Rate
n=3
Amount Found % Amount Found %Mean SD RSD
1 +0.2 ml/min
99.844 99.8
99.225 0.623 0.627
99.234 99.234
98.598 98.598
2 -0.2 ml/min
100.322 100.322
100.00 0.673 0.673
100.458 100.458
99.23 99.23
Table 7: Robustness Studies for Ivermectin (Change in Flow rate) Sr. No. Flow Rate
n=3
Amount Found % Amount Found %Mean SD RSD
1 +0.2 ml/min
103.949 99.95
98.504 1.58 0.16
102.699 98.749
100.688 96.815
2 -0.2 ml/min
104.4 100.386
99.813 0.611 0.6
103.139 99.172
103.896 99.9
Table 8: Robustness Studies for Fluconazole (Change in Solvent Concentration) Sr. No. Solvent conc.
n=3
Amount Found % Amount Found %Mean SD RSD
1 +5%
98.33 98.33
97.810 0.537 0.5
97.844 97.84
97.257 97.257
2 -5%
100.54 100.54
100.064 0.737 0.736
100.437 100.437
99.215 99.215
Table 9: Robustness Studies for Ivermectin (Change in Solvent Concentration) Sr. No. Solvent conc.
n=3
Amount Found % Amount Found %Mean SD RSD
1 +5%
102.333 98.397
97.277 1.539 1.582
101.829 97.912
99.343 95.522
2 -5%
102.419 98.479
98.364 0.979 0.9
101.226 97.332
103.253 99.281
REFERENCES
1. Foye’s Principle of Medicinal Chemistry, 6th Edition, Published by Volters Klaver (India) Pvt. Ltd. New Delhi. Page No. 1116-1120. 2008. 2. Martindale “The Extra Pharmacopeia”, ed. Reynolds, J.E.F. 31st Edition,
Royal Pharmaceutical Soc, London. Page No. 404-406. 1996.
3. Wallace, J.E., Harris, S.C. Gallegos, Jarrett, Foulds, G. Chen, T.J.H., Rinaldi, M.G., Antimicrobial agents and Chemotherapy, 1992, 36(3), 603-606.
4. Omura, S.; Shiomi, K. (2007). "Discovery, Chemistry, and Chemical Biology of Microbial Products". Pure and Applied Chemistry 79 (4): 581–591.
5. Elena Gabriela Oltean ‘Development and Validation of a RP-HPLC Method for the quantitation studies of Ivermectin in solutions dosage forms’. Veterinary Pharmacon, Volume 5, Page 68-70, December 2011.
6. Mohammad Ali, Sanjar Alam, S. Ahmad, A.K. Dinda and F.J. Ahmad, ‘Determination of Ivermectin stability by High-Performance Thin-Layer Chromatography’. International Journal of Drug Development and Research, Volume 3, Page 240-247, April-June 2011.
7. Nalini Shastri, Pothana Sadasivudu, M. Sadanandam, ‘Development and Validation of RP-HPLC and UV methods of analysis for Fluconazole in Pharmaceutical Solid Dosage Forms’. International Journal of ChemTech Research, Volume 1st, Page No. 1131-1136, October-December 2009.
9. International Conference on Harmonization (ICH), Q2A: Text on Validation of Analytical Procedures: Definitions and Terminology, Vol. 60, US FDA Federal Register, 1995.
10. International Conference on Harmonization (ICH), Q2B: Validation of Analytical Martinda, The Complete Drug Reference; Pharmaceutical Press: London 2002, 33rd edition, 321-323.
Source of support: Nil, Conflict of interest: None Declared