AFTAB HUSSAIN AZHAR* AND GHULAM NABI*
RECEIVED ON 02.07.2009 ACCEPTED ON 18.11.2009
ABSTRACT
The impact of physical and management interventions implemented under the PISRP (Punjab Irrigation Sector Reforms Programm) has been assessed. Enhanced funding for M&R (Maintenance and Repair) works during intervention (2006-2007) period facilitated improved canal water supplies as compared to the pre-intervention (2004-2005) period. About 15.1% more water supplies were delivered during Kharif 2006 as compared to Kharif 2004 season. An increase of 41.1% in water supplies during Rabi 2006-2007 was observed as compared to Rabi 2004-2005 season. DPR (Delivery Performance Ratio) analysis revealed that during intervention period overall supply position of canal systems in terms of equity by and large was satisfactory. However, the CV (Spatial Coefficient of Variability) analysis indicated that distribution of supply amongst the distributaries of those canal systems was not satisfactory, highlighting the need for further improvement in terms of water supply reliability along the reach of those canal systems. Crop yields improved ranging from 5-62% as compared to pre-intervention period. The cropped area also increased by about 10% in all canal commands during intervention period. FOs (Farmer Organizations) performance evaluation indicates that these organizations have been reasonably effective for dispute resolution, control over water theft and in ensuring water availability to the tail ends of the channels, and developing sense of ownership for long-term sustainability of irrigation infrastructure. However, FOs need further capacity building to enhance their contribution in this regard. Due to transitioning of T/Ws (Tube Wells), the M&R expenditures for T/Ws were reduced to only 4% during FY 2006-2007 as compared to 37% in FY 2005-2006. T/Ws divesture achieved significant reduction in the electricity bills of IPD (Irrigation & Power Department). Consequently, during November-June months of FY 2007-2008, a savings of Rs. 377.61 million was accrued, compared to the same months of FY 2006-2007. Overall, the investigations revealed that the results of reforms interventions are quite encouraging in terms of uplifting the socio-economic conditions and poverty alleviation in irrigated areas of Punjab province.
Key Words: Irrigation, Reforms, Punjab, Equity, Reliability, Yield, Delivery Performance Ratio.
* Assistant Professor, Centre of Excellence in Water Resources Engineering, University of Engineering & Technology, Lahore.
1.
INTRODUCTION
P
unjab irrigation network is one of the largest contiguous irrigation systems in the world. The surface and groundwater of Indus Basin System constitute vital lifeline of Punjab's agro-based economy. Agriculture contributes 20% to Punjab's GDP andthe objective of bringing as much land under canal command as possible. It was designed only for meeting the requirements of a small population of that time. The designed annual cropping intensities were generally kept low, at 60-80%, and the diversion capacity of the canals aimed at spreading the water thinly over a large area equitably with minimum M&R costs. This policy was considered suitable for meeting the requirements of a small population at that time [2]. However, as a consequence of manifold population growth over time, the water requirements have significantly increased beyond the initially designed capacities of this system. At present the irrigation system serves a CCA of 8.4 Mha with a cropping intensity of about 122%. As such, the Punjab water sector challenges are: (i) growing water shortages, (ii) progressive deterioration of irrigation infrastructure, (iii) lower water productivity, (iv) lack of transparency and inequities in water distribution, (v) gaps in governance and trust, (vi) lack of financial sustainability, and (vii) over exploitation of groundwater, etc. Consequently, it has created a multitude of problems and challenges mainly related to poverty with profound social, economic and environmental implications.
In order to combat the aforementioned challenges, the
Punjab government developed a vision and strategy for the irrigation sector and pursued a reform programme,
which has been articulated in a document, describing the PISRP. For achieving this vision, the government launched a medium term reform programme. The long term vision
envisaged "to provide adequate, equitable and reliable irrigation supplies to the cultivable lands of Punjab aiming
at enhanced agricultural productivity, and sustainable development with focus on holistic management and broad based institutional reforms" [3].
The PISRP has been developed on the basis of lessons learned from past experience and extensive consultations with various stakeholders within and outside the government, including policy and strategic dialogue with the World Bank and other development agencies. The
strategic vision includes institutional and policy reforms as well as critical investments on rehabilitation and system improvement. The reforms program funded by the World Bank through programmatic series of three DPL (Development Policy Loans) during the three years i.e. FY 2005-2008, has been built on the four inter-related pillars viz: Pillar-I, Institutional and Policy Reforms to improve the management and maintenance of the irrigation system to ensure the long-term physical and financial sustainability; Pillar-II, Water Resource Management Reforms to emphasize the critical importance of water entitlements, measurements, and transparency; Pillar-III, Irrigation Service Delivery Reforms to improve the quality, efficiency and accountability of irrigation services, through greater participation of farmers, and; Pillar-IV, Reforms to encourage new technology to improve water use efficiency and on-farm productivity through a system of incentives and reforms in agricultural marketing and research.
In view of the huge investments incurred and associated benefits of these Reforms, it is deemed important to investigate the impact of reform interventions so as to suggest improvements for improved governance and sustainability of irrigation infrastructure in the province. As such, this study was conducted. The findings of this study can facilitate implementing irrigation reform programmes more effectively which are aimed at improving irrigation assets' management as well as quality of service delivery through participatory management, designing of new drainage schemes, and addressing water management issues as reported by [4-6]. This paper first describes an overview of the reforms followed by the impact assessment of these reforms on irrigation performance and agricultural water productivity.
2.
IPD SET-UP
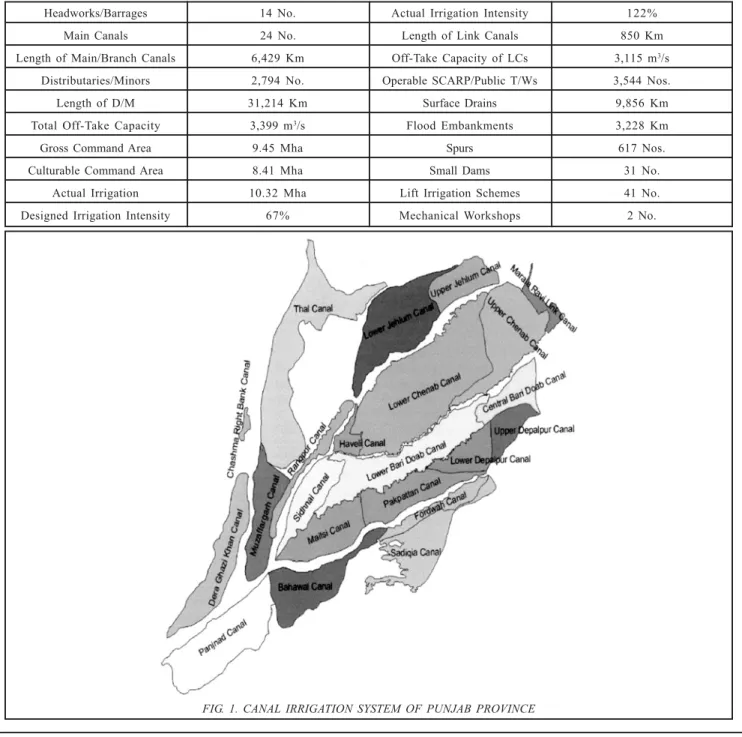
TABLE 1. SALIENT FEATURES OF IPD INFRASTRUCTURE
Headworks/Barrages 14 No. Actual Irrigation Intensity 122%
Main Canals 24 No. Length of Link Canals 850 Km
Length of Main/Branch Canals 6,429 Km Off-Take Capacity of LCs 3,115 m3/s
Distributaries/Minors 2,794 No. Operable SCARP/Public T/Ws 3,544 Nos.
Length of D/M 31,214 Km Surface Drains 9,856 Km
Total Off-Take Capacity 3,399 m3/s Flood Embankments 3,228 Km
Gross Command Area 9.45 Mha Spurs 617 Nos.
Culturable Command Area 8.41 Mha Small Dams 31 No.
Actual Irrigation 10.32 Mha Lift Irrigation Schemes 41 No.
Designed Irrigation Intensity 67% Mechanical Workshops 2 No.
For operational reasons the infrastructure is divided into six territorial Zones viz; Lahore, Sargodha, Faisalabad, Multan, Bahawalpur and Dera Ghazi Khan. There are two other set-ups functioning as zones headed by chief engineers. In addition, there is Directorate of Land Reclamation, being managed by a Director. Each zone except Irrigation Research Zone is split into three or more circles (generally supervising a canal command) headed
by a SE (Superintending Engineer), while the circles are further divided into irrigation or drainage divisions that are headed by XENs (Executive Engineers) who are responsible for carrying out the O&M activities with the assistance of SDOs (Sub-Divisional Officers) and SENs (Sub-Engineers). The Irrigation Research Zone contains only one division that carries out M&R of assets of this zone.
3.
PUNJAB IRRIGATION SECTOR
REFORM PROGRAMME
With regards to the implementation of reforms interventions [7-9], the PISRP framework is hinged on the following main heads:
Revised Organisational set-up.
Enhanced funding for M&R works.
Tube wells divesture.
Computerized system for stakeholders' complaints.
Posting of water accounts on IPD Website, and
TPM (Third Party Monitoring)
The impact assessment pertinent to each of the above components is discussed in Section 5.
4.
MATERIALS AND METHOD
In this study impact assessment of PISRP has been discussed. The irrigation performance was assessed in terms of equity, reliability and land and water productivity. The performance indicators used for equity and reliability were DPR, and CV, respectively. For this purpose, available data on irrigation supplies, agricultural statistics and meteorological information were obtained from various sources such as; PIDA (Punjab Irrigation and Drainage Authority), IWTR (Indus Water Treaty and Regulation), and PMIU (Program Monitoring and Implementation Unit) offices of the Punjab Irrigation & Power Department, Department of Agriculture, Department of Meteorology and IPD reports. The required data were collected for two stages i.e. before and during intervention periods. The collected data were first screened for their integrity using visual judgement; and then analysed in various ways to arrive at the impact assessment of irrigation interventions. Two crop years have been analysed viz. 2004-2005 as pre-intervention period and 2006-2007 as intervention period for both Rabi and Kharif crop seasons. For some components of this
study, where supplemental data were available for the year 2007-2008, those data were also used to augment the impact assessment analysis.
5.
IMPACT ASSESSMENT DISCUSSIONS
Improved M&R and R&U interventions are ultimately expected to provide equitable and reliable irrigation supplies to the irrigable lands of the Punjab province aiming at enhanced agricultural productivity. This aspect is discussed in the following sections.
5.1
Budget Allocations/Releases
Under the reforms programme, the allocations for M&R works were significantly increased. Prior to advent of reforms program, a budget allocation of only Rs. 1.231 billion had been provided for M&R activities during the
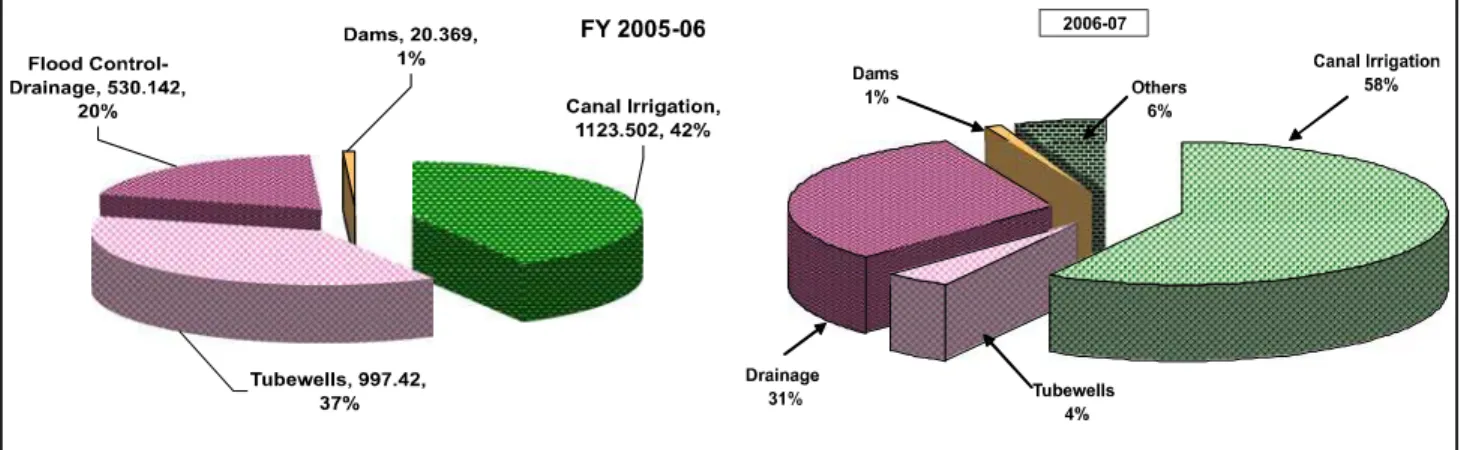
FY 2005-2006 which was increased to Rs. 1.987 billion due to reforms interventions; out of which Rs 1.765 billion (excluding electricity charges) was spent under M&R interventions, indicating 97% utilization of the budgeted amount. Similarly, an allocation of Rs. 2.236 billion was provided for the FY 2006-2007 out of which Rs 2.051 billion was spent on M&R interventions, indicating 92% utilization of the budgeted amount. The overall category wise distribution of expenditures during FY 2005-2006 and 2006-2007 is shown in Fig. 2. As can be observed, percent expenditure for canal irrigation was more (58%) during FY 2006-2007 as compared to FY
2005-2006 (42%). Similarly for flood control/drainage works, allocation during FY 2006-2007 was increased to 31% as compared to FY2005-2006 (20%). Whereas, M&R expenditures for T/Ws during FY 2005-2006 were about 37% which were reduced to only 4% during FY 2006-2007 due to transitioning of TWs.
5.2
Maintenance and Repair Activities
repair-works required to remove defects occurring due to accident or by wear & tear, and (iii) replacement of parts of and/or complete facility that might have worn out or spent its useful life. Due to enhanced funding, the M&R works were effectively carried out during the intervention period. Based on aforementioned three categories, monitoring of various M&R activities was carried out for the intervention period. The overall distribution of outcome-indicators of various M&R works is graphically shown in Fig. 3. As can be observed, due to enhanced budget allocations the percent distribution for desilting of irrigation channels was more (52%) during FY 2006-2007 as compared to FY 2005-2006 (47%). Similarly, more outlets (69%) were repaired during FY 2006-2007 as compared to FY 2005-2006 (38%). However, works pertinent to strengthening
of canal banks (Fig. 3) were less during FY2006-2007 because of relatively less funds available for it. The general impact of M&R works carried out during FY 2005-2007 was that the branch canals passed designed discharges safely due to bank strengthening/berm formation. Similarly desilting of distributaries and minors and setting right of the defective outlets helped in improving the distribution equity and the tails got better canal water supplies. As a result, the water users received more reliable water supplies as compared to pre-intervention period.
5.3
Processing of Complaints
A computerized system has been established to handle the complaints of irrigators. Under this system, the complainant only mentions his Chak No. (Village) on free
help line and other relevant data is automatically generated. On the receipt of complaint, PMIU sends the complaint to the concerned XEN with copy to the SE and CE; and the contents of the complaint are published in the account of the concerned XEN, SE and CE on the PMIU website (http:/ /irrigation.punjab.gov.pk). Focal person has been nominated by each Division to make an immediate contact to the complainant. XENs are required to submit reply within 4-days in their web accounts. In case, no reply is received within prescribed time, an automatic E-mail is generated by the Complaint Message System and sent to the concerned XEN, SE and CE. PMIU sends the consolidated summary of the disposal of complaints fortnightly to the Secretary, IPD.
As of end March 2008, 4451 complaints were received out of which final directions were given by the PMIU on 4211 after receiving response from field offices. The category of complaints is graphically shown in Figure 4. As can be observed, most of the complaints (34%; 1511 out of 4451) were related to water theft, and secondly to tail shortage (27%; 1202 out of 4451). Efficient handling of complaints is playing a vital role for sustainability of the irrigation system.
5.4
T/Ws Disinvestment
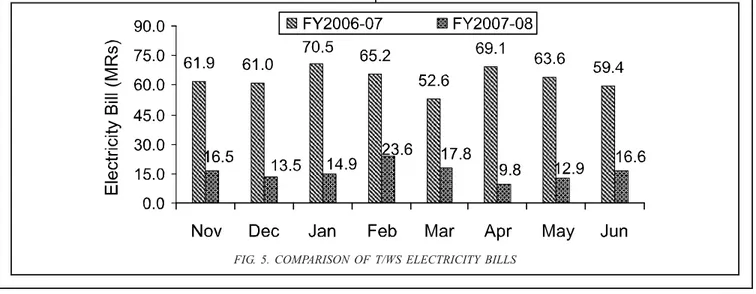
Under reform programme, major portion of IPD T/Ws infrastructure was disinvested to seek reduction in M&R expenditures as well as in annual expenditures on electricity bills for Government T/Ws. Fig. 2 indicates that
M&R expenditures for T/Ws during FY 2005-2006 were about 37% of total allocations, which were reduced to only 4% during FY 2006-2007 mainly attributed to transitioning of T/Ws. A comparison of the electricity billing data of SCARP/Non-SCARP T/Ws is given in Fig. 5. As can be observed, due to T/Ws divesture a significant reduction in the electricity bills of IPD has been achieved. The Fig. 5 shows that during November, December, January, February, March, April, May and June months of FY 2007-2008; savings of Rs. 45.4M, Rs. 47.4M, Rs. 55.6M, Rs. 41.57M, Rs. 34.82M, Rs. 59.37M, Rs. 50.68M and Rs. 42.77M, respectively were accrued, as compared to the same months of FY 2006-2007; leading to a total saving of Rs. 377.61 million.
5.5
Posting of Water Accounts on IPD
Website
Water accounts for 24 main canals regarding entitlements, deliveries and balance share are being posted on the Punjab Portal www.punjab.gov.pk as well as irrigation web site http://irrigation.punjab.gov.pk. Data on the website is updated on 10-daily basis. The relative DPR values of various canal systems is also being displayed. The website has been improved and made more user friendly. Irrigators can watch the data of their channels and also can see the previous 10 daily trends of the flows in the channels. Counter has also been made on the web site which indicates the number of users visited the site. The number of hits recorded on IPD website up to 28th March, 2008 was 2,02,220.
5.6
Third Party Monitoring
In pursuit of Reforms Program, IPD is required to provide a neutral/unbiased monitoring assessment of the reforms' activities. TPM activities specifically include: (i) performance evaluation/engineering audit of M&R works in various zones of the IPD through random checks, (ii) random checking of DPR values in FO-Managed channels and IPD-Managed channels, and (iii) Case studies of FOs using the indicators PIDA has prepared for benchmarking of FOs. In this regard, IPD has retained the services of M/ S NDC for performing TPM. Due to the appointment of Consultants for TPM of the M&R works, the implementation of Performance Evaluation System for M&R works has improved.
5.7
Impact on Water Productivity
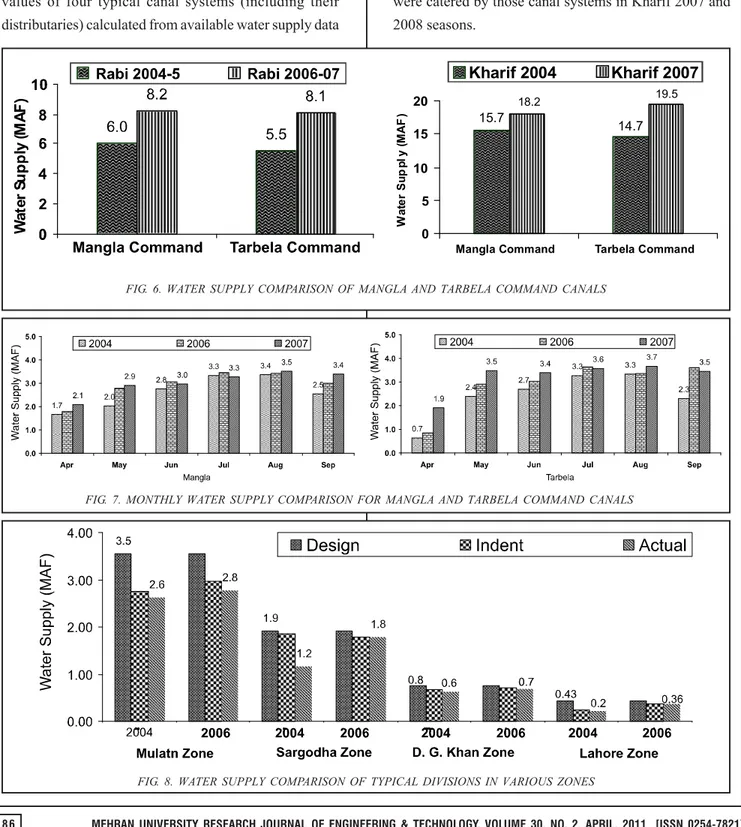
Water Availability/Delivery: The seasonal and annual analysis of water delivery to Punjab irrigation system revealed that during intervention period 2006-2007 the canal supplies were higher as compared to the pre-intervention 2004-2005 year. As can be observed from Fig. 6, for Mangla command canals the Kharif 2004 supply was 15.7 MAF which increased to 18.2 MAF during Kharif 2007. Similarly, for Tarbela command canals the Kharif 2004 supply was 14.7 MAF which increased to 19.5 MAF during Kharif 2007 season. The same pattern can be observed for Rabi seasons too. The monthly water supplies of Mangla and Tarbela command
canals during pre-intervention (2004) and intervention year (2006) are graphically presented in Fig. 7; whereas indent and actual supply comparison of typical divisions is shown in Fig. 8. As can be observed (Fig. 7), water supply position considerably improved in 2006-2007 as compared to pre-intervention year. The analysis revealed that about 15.1 and 24.2% more water supplies were diverted into main canals of Punjab irrigation system during Kharif 2006 and 2007 seasons respectively, as compared to Kharif 2004 season. About 7.9% more water was diverted during Kharif 2007 as compared to Kharif 2006 season. Similarly, an increase of 41.1 and 47.8% in water supplies during Rabi 2006-2007 and 2006-2007-2008 respectively was observed as compared to Rabi 2004-05 season. An increase of 4.8% during Rabi 2007-008 (up to February) was observed as compared to Rabi 2006-2007 (up to February) season. Fig. 8 also reflects the improved canal operations during 2006 compared to pre-intervention (2004) year; mainly attributed to Reforms interventions involving improved and better monitoring along with transparency by providing access to data to everybody through the newly developed website.
DPR: In order to assess the equity performance of the irrigation system, the DPR (ratio of actual discharge, Qa to designed discharge, Qd) of main canals and their distributaries were analysed. It is pertinent to mention
that in this study the relative DPR (DPRTail/DPRHead) were
FIG. 7. MONTHLY WATER SUPPLY COMPARISON FOR MANGLA AND TARBELA COMMAND CANALS 3709
3609 3;07 3:04
2 7 32 37 42
Ocpinc"Eqoocpf Vctdgnc"Eqoocpf
Yc
vg
t
U
w
r
r
n{
*O
C
H
+
Mjctkh"4226 Mjctkh"4229
FIG. 6. WATER SUPPLY COMPARISON OF MANGLA AND TARBELA COMMAND CANALS
FIG. 8. WATER SUPPLY COMPARISON OF TYPICAL DIVISIONS IN VARIOUS ZONES
calculated for main canals and their distributaries. The
relative DPR has an ideal values of 1, which means every changed flow conditions at sub-system are proportionately distributed among the share holders regardless of their
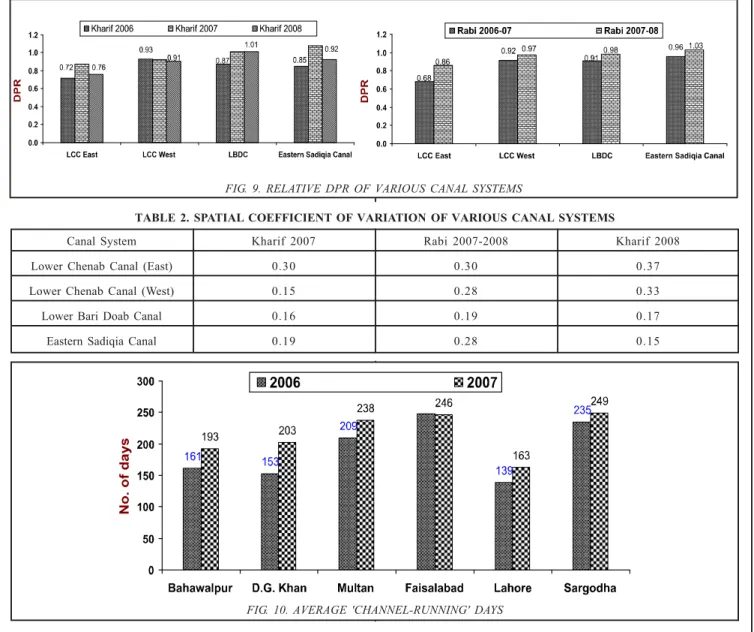
location along the distributaries. The average relative DPR values of four typical canal systems (including their distributaries) calculated from available water supply data
are graphically presented in Fig. 9; and CV of those DPRs
are given in the Table 2. The high DPR (Fig. 9) values clearly indicate that due to reforms interventions (augmented with efficient M&R works carried out during
TABLE 2. SPATIAL COEFFICIENT OF VARIATION OF VARIOUS CANAL SYSTEMS
Canal System Kharif 2007 Rabi 2007-2008 Kharif 2008
Lower Chenab Canal (East) 0.30 0.30 0.37
Lower Chenab Canal (West) 0.15 0.28 0.33
Lower Bari Doab Canal 0.16 0.19 0.17
Eastern Sadiqia Canal 0.19 0.28 0.15
With regards to the reliability performance aspect, as can be observed for DPR data of four canal systems the CV ranged from 0.15-0.36 (Table 2). Although, the high DPR values (Fig. 9) indicate that overall supply position in terms of equity of those canal systems by and large was satisfactory; however, the CV analysis revealed that distribution of supply amongst the distributaries of those canal systems was not satisfactory, highlighting the need for further improvement in terms of water supply reliability along the reach of those canal systems.
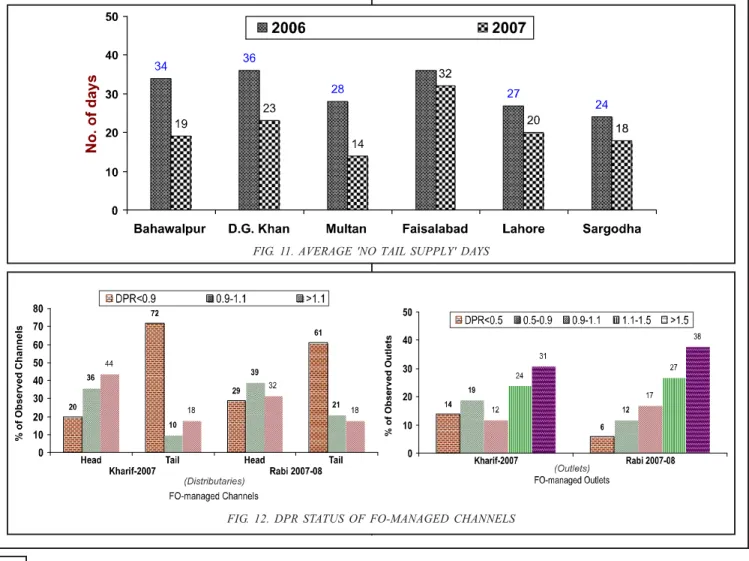
Channel Running Days: As a result of enhanced funding for M&R works during intervention period, the
operational safety of the channels was improved with less breaches resulting in increased 'channel running days'. A comparison of average number of channels' running days in various zones is presented in Fig. 10. A comparison of average number of days during which no water supply was available at tails, in various zones is shown in Fig. 11. As can be observed, considerable improvement in water supplies for irrigated agriculture was achieved during the intervention period. An analysis of tail water supplies indicated that there was about 7% more supply available at tails during the year 2007 in terms of time span (i.e. number of days) as compared to year 2006.
FIG. 9. RELATIVE DPR OF VARIOUS CANAL SYSTEMS
DPR in FO-Managed Channels: In order to determine the equity of water delivered to the farmers and to ascertain transparency of water allocations and entitlements in FO-managed channels, random discharge measurement data
of 39 distributaries of LCC East area available from the TPC (Third Party Consultants) was analysed using the statistical procedures. Based on this data, the relative DPRs of FO-managed channels and their outlets during
2007-2008 are graphically presented in Fig. 12. As can be observed, overall the supply position at head of the channels by and large was satisfactory; whereas at tails the position was relatively better during Rabi 2007-2008
as compared to Kharif 2007 season. Although, the supply to various outlets has improved, the distribution of supply amongst the outlets was not equitable, highlighting the need for further improvement. One of the reasons observed
for low equity was that crests of outlets serving the land of influential farmers were set at levels lower than design, and hence were overdrawing the water.
Cropped Area Changes: The macro-scale land use
classification analysis revealed that in all canal commands,
the cropped area increased during intervention period 2006-2007 as compared to pre-intervention 2004-2005 period. This
increase ranged from 2-26% with overall average of about
10% for the entire irrigation system. For Rabi season the
increase in cropped area ranged from 1-15% [10].
5.8
Crop Yield Improvement
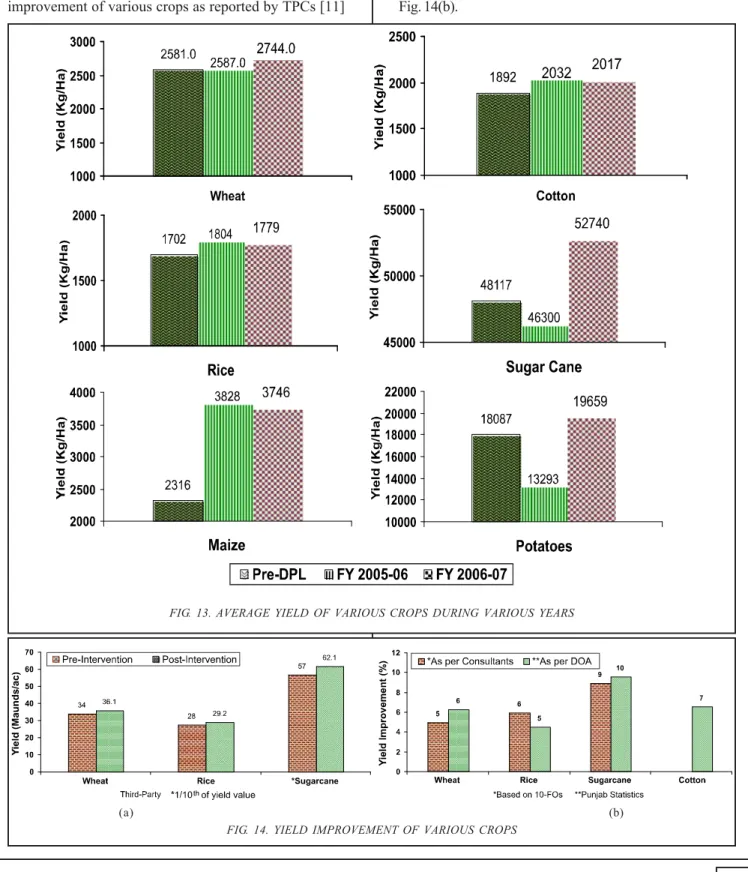
As per information provided by the DoA (Department of Agriculture), the average per hectare yield of various crops in different years is graphically represented in Fig. 13. A general trend of crop yield improvement during the
FIG. 11. AVERAGE 'NO TAIL SUPPLY' DAYS
intervention period as compared to pre-intervention (pre-DPL) period is reflected in the graphical representation of crop yields of the six (6) significant crops. The yield improvement of various crops as reported by TPCs [11]
based on 10-FOs area survey, is graphically presented in Fig.14(a); whereas a comparison of yield improvement as reported by TPC and DOA is graphically presented in Fig. 14(b).
(a) (b)
FIG. 13. AVERAGE YIELD OF VARIOUS CROPS DURING VARIOUS YEARS
5.9
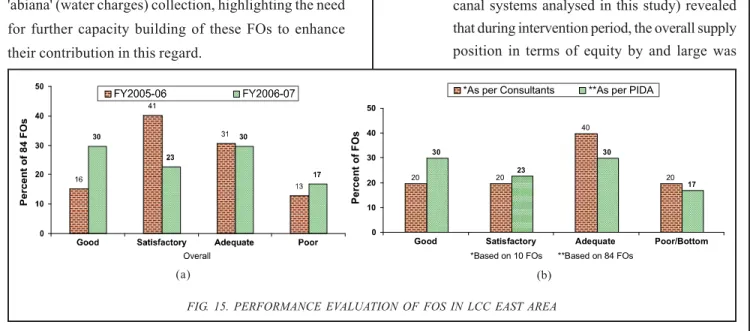
FOs Performance
For long-term sustainability of irrigation infrastructure,
the role of farmers is very important. Based on the
performance evaluation criteria identified by PIDA [7]
for FOs evaluation, the overall performance ranking of
84 FOs in LCC (East) area for 2005-2007 period is
graphically presented in Fig. 15(a). As can be observed,
more than 50% of the FOs fall in satisfactory/good
category whereas only 17% FOs fall in poor category.
Overall, the performance evaluation indicates that these
organizations have been reasonably effective for dispute
resolution, control over water theft and in ensuring water
availability to the tail ends of the channels. This public/
private partnership model in irrigation management is
developing a cultural change in the rural areas to respect
the mutual rights and responsibilities. It is also evolving
a collective approach to resolve the problems at local
level and sense of ownership for the sustainability of
irrigation infrastructure. The performance evaluation of
different number of FOs of the same LCC East area as
reported by PIDA [7] and TPC [11] is graphically shown
in Fig. 15(b). As can be observed, poor/bottom reported
FOs were 20% (by TPC) and 17% (by PIDA). The main
factor for this reckoning was reported mainly due to low
'abiana' (water charges) collection, highlighting the need
for further capacity building of these FOs to enhance
their contribution in this regard.
6.
CONCLUSIONS
(i) Prior to advent of reforms program, the budget allocation for M&R activities during FY 2005-2006 was only Rs. 1.231 billion which was increased to Rs 1.987 billion due to reforms interventions. Similarly, an allocation of Rs. 2.236 billion was provided for FY 2006-2007. As a result of enhanced funding for M&R works during intervention period, the operational safety of the channels was improved with less breaches resulting in increased 'channel running days', and tails got better canal water supplies as compared to the pre-intervention period. The tail water supply analysis indicated that there was about 7% more supply available at tails during the year 2007 in terms of time span (i.e. number of days) as compared to year 2006.
(ii) The investigations revealed that about 15.1% more water supplies were diverted to main canals of Punjab irrigation system during Kharif 2006 as compared to Kharif 2004 season. An increase of 41.1% in water supplies during Rabi 2006-2007 was observed as compared to Rabi 2004-2005.
(iii) The DPR investigations (based on four main canal systems analysed in this study) revealed that during intervention period, the overall supply position in terms of equity by and large was
42 42 62 42 52 45 52 39 2 32 42 52 62 72
Iqqf Ucvkuhcevqt{ Cfgswcvg Rqqt1Dqvvqo
Rgt egp v q h H Q u ,Cu"rgt"Eqpuwnvcpvu ,,Cu"rgt"RKFC ,Dcugf"qp"32"HQu ,,Dcugf"qp":6"HQu (a) (b)
satisfactory; however, the CV analysis revealed that distribution of supply amongst the distributaries of those canal systems was not satisfactory, highlighting the need for further improvement in terms of water supply reliability along the reach of those canal systems.
(iv) The DPR investigations of FO-managed channels and their outlets revealed that overall the supply position at head of the channels by and large was satisfactory. At tails the position was improved during Rabi 2007-2008 as compared to Kharif 2007 season. Although, the supply to various outlets has improved, the distribution of supply amongst outlets in head, middle and tail reaches was not equitable, highlighting the need for further improvement.
(v) Under reforms intervention, the transitioning of T/Ws reduced the M&R expenditures of T/Ws to only 4% during FY 2006-2007 as compared to 37% of FY 2005-2006. A comparison of billing data of T/Ws revealed that due to T/Ws divesture during November-June months of FY2007-2008, a saving of Rs. 377.61 million was accrued compared to the same months of FY2006-2007.
(vi) The analysis of crop yield data revealed that overall crop yield and production has improved as a result of implementation of physical and management interventions under reforms programme as compared to the pre-intervention period. The yield improvement ranged from 5-62%.
(vii) The macro-scale land use classification analysis revealed that the cropped area has also increased in all canal commands during intervention period 2006-2007 as compared to pre-intervention 2004-2005 period, ranging from 2-26% during the Kharif and 1-15% during the Rabi season; with an average of 10% over the entire irrigation system.
(viii) FOs performance evaluation indicates that these organizations have been reasonably effective for dispute resolution, control over water theft and in ensuring water availability to the tail ends of the channels.
7.
RECOMMENDATIONS
(i) Lack of technical control on the parameters of 'outlets' is one of the major reasons for low equity along the distributary channels. Effective control on the technical data of outlets at the time of construction, and periodical checks of the technical data in the field can significantly improve the existing equity levels.
(ii) Outlets serving the land of influential zamindars are overdrawing the water. Better coordination between AWB and FOs supported through effective co-operation by Police in registering the 'water theft' cases can effectively control such pilferage of water. Further, expeditious disposal of Levy of 'Tawan' penalty in water pilferage cases can also help to abate this problem.
(iii) Extensive Capacity building of FOs can help enhancing their contribution towards log-term sustainability of the irrigation infrastructure.
ACKNOWLEDGEMENTS
The authors wish to thank management personnel of the PIDA, Indus Water Treaty and Regulation and PMIU offices of the Punjab Irrigation & Power Department for providing the required data used in this study. The crop yield data provided by the Department of Agriculture, Punjab, and climatic data by the Meteorological Department is also highly appreciated.
REFERENCES
[2] IPD, "Reform Activities: Internal Monitoring and Evaluation Report", SPRU-Punjab Irrigation and Power Department, Lahore, Pakistan, December, 2007.
[3] IPD, "Quarterly Progress Report: Reform Activities Under DPL, for the Quarter Ending December, 2006", SPRU-Punjab Irrigation and Power Department, Lahore, Pakistan, December, 2007.
[4] Panda, R.K., and Rajput, T.B.S., "A Water Budget Technique for the Design of Open Drainage Systems", Journal of Irrigation and Drainage Engineering, ASCE, Volume 130, No. 53, pp. 449-460, 2004.
[5] Nadeem, A., and Haq, A.U., "Punjab Irrigation Sector Reforms Programme-Strategic Interventions and Reforms Management", Proceedings 20th International Congress on Irrigation and Drainage, ICID, Q.55.1.25, Lahore, Pakistan, 2008.
[6] Azhar, A.H., Perera, B.J.C., and Nabi, G., "A Simple Soil Moisture Simulation Model to Address Irrigation Water Management Issues", Mehran University Research Journal of Engineering and Technology, Volume 30, No. 2, Jamshoro, Pakistan, April, 2011.
[7] PIDA, "Performance Monitoring and Evaluation of Farmers Organisations", AWB/LCC (East) Canal Circle
M&E Report, Punjab Irrigation and Drainage Authority,
2008.
[8] IPD, "Reform Activities: Internal Monitoring and
Evaluation Report", SPRU-Punjab Irrigation and Power
Department, April, 2008.
[9] IPD, "Monitoring of Implementation of AMP Activities during FY 2005-2006 and 2006-2007", SPRU-Punjab
Irrigation and Power Department, June, 2008.
[10] IWMI, "Assessing the Impact of Physical and Management Interventions Through RS/GIS Tools on
Irrigation System Performance in Punjab, Pakistan",
International Water Management Institute, Lahore,
Pakistan May, 2008.
[11] IPD, "Third Party Monitoring of DPR Values in
FO-Managed Channels, Case Studies of FOs and Performance
Evaluation/Engineering Audit of M&R Works", NDC-Project Completion Report for Punjab Irrigation and