ISSN 0104-6632 Printed in Brazil
www.abeq.org.br/bjche
Vol. 26, No. 04, pp. 713 - 721, October - December, 2009
Brazilian Journal
of Chemical
Engineering
EFFECT OF SOLID LOADING AND AGGREGATE
SIZE ON THE RHEOLOGICAL BEHAVIOR OF
PDMS/CALCIUM CARBONATE SUSPENSIONS
E. Behzadfar, M. H. Abdolrasouli, F. Sharif
*and H. Nazockdast
Department of Polymer Engineering, Amirkabir University of Technology, Phone: +98(21)6454 2409, +98(912)601 4812, Tehran, Iran.
E-mail: [email protected], *E-mail: [email protected]
(Submitted: March 3, 2009 ; Revised: June 12, 2009 ; Accepted: June 18, 2009)
Abstract - The purpose of this study is to examine the effect of solid loading and aggregate size on the rheological behavior of PDMS (polydimethylsiloxane)/CC (calcium carbonate) suspensions. Mixtures containing 10 to 40 vol% of CC were prepared; the effect of shear rate and particle content on aggregate size and rheological properties was studied. Rheological properties including viscosity, loss modulus, storage modulus and yield stress were measured using rotational and oscillatory rheometry. Casson’s equation was found to satisfactorily model the samples’ stress response as a function of shear rate for different solid content. While solid content did not have any effect on the aggregate size, shear rate did influence the aggregate median diameter. It was observed that suspensions with higher aggregate size had a higher viscosity. In general, for a given volume fraction, a small change in the aggregate size had a significant impact on the viscosity, particularly at low shear rates.
Keywords: Rheological behavior; Aggregate size; PDMS/CC suspensions.
INTRODUCTION
Suspensions and colloids are of considerable industrial and daily life importance. Blood, paint, ink, oil, and food are a few examples indicating the diversity of technological significance of these systems (Larson, 1999).
Rheological study of suspensions and colloidal dispersions provides valuable information for efficient utilization, transport and handling of such materials in industrial applications. Therefore, the rheological behavior of colloids and suspensions has been the subject of interest for many researchers (Krieger and Dougherty, 1959, Russel, 1987, van der Werff et al., 1989, Shikata and Pearson, 1994, Liu and Tseng, 1998, Le Meins et al., 2002, Olhero and Ferreira, 2004). The rheological properties of suspensions are affected by a number of parameters, including particle
concentration, particle shape and size, particle size distribution, rheological characteristics of the matrix fluid and also aggregate size (Russel, 1987, Liu and Tseng, 1998, Jancer, 1999, Shenoy, 1999, Selomulya, 2001, Tseng and Lin, 2003, Grizzuti and Pasquino, 2008).
Studies of the relationship between aggregate size and rheology have generally focused on the effect of initial particles size at the beginning of every process. It is common that aggregate size changes during mixing and other flow processes. Recently, there have been articles considering the effect of aggregate size on the rheological behavior of filled systems (George et al., 2004, Kaully et al., 2007, Colomer et al., 2005).
The present work focuses on the study of aggregate sizes formed in a mixing process and its relation to the rheological behavior of suspensions. The suspension samples were made from a medium viscosity liquid (PDMS100) and micron sized calcium carbonate particles with different volume fractions and mixed at different shear rates.
EXPERIMENTAL
In the next section, experimental issues including details of samples and sample preparation are given. It is then followed by a thorough discussion of the experimental results.
A-Materials
A silicone fluid, dimethylpolysiloxane, (PDMS100) supplied by Wacker-Chemie GmbH was used as the fluid and had a dynamic viscosity of about 96 mPa.s at 25°C as reported by the manufacturer. Treated commercial calcium carbonate with the trade name of 1T-SW, supplied by OmyaPars Company, was dispersed with different
filler concentrations. More details are given in Table 1.
1T-SW powder was micron-sized, with a mean particle size of 1.8 micron as reported by the manufacturer.
B-Sample Preparation
Samples were prepared by direct loading and mixing in a stirred vessel with a volume of 250 mL using a high shear Sawtooth impeller. Samples of 10, 20, 30 and 40% calcium carbonate volume fraction were prepared at a 5000 rpm rotation speed to study the effect of solid volume fraction. Samples with 30% volume fraction were prepared with mixing at different rotation speeds to study the effect of rotation speed on aggregate size and rheological properties. The impeller ran at different speeds, from 500 rpm to 5000 rpm for 20 minutes. The batch volume was 200 mL and the corresponding average shear rates were estimated from equations proposed by Camp and Stein (1943) and Clark (1985). Reynolds numbers were calculated by the following equation:
2
Re= ρND /μ (1)
whereμ, N, D and ρ are the fluid viscosity, rotation speed, impeller diameter and fluid density, respectively. Reynolds numbers and shear rates for different cases are presented in Table 2 and range from 93.44 to 934.43 and from 24.3 to 769s−1, respectively.
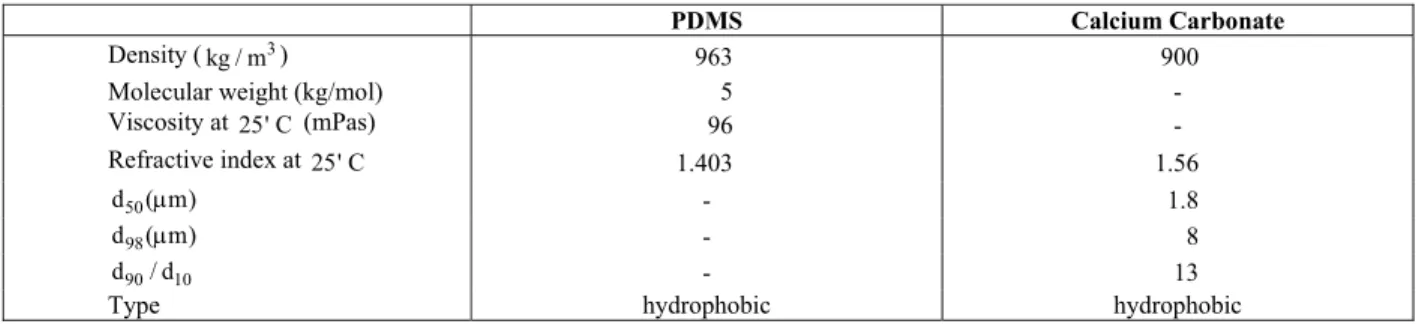
Table 1: Characteristics of matrix and dispersing particles
PDMS Calcium Carbonate
Density (kg / m ) 3 963 900
Molecular weight (kg/mol) 5 -
Viscosity at 25' C (mPas) 96 -
Refractive index at 25' C 1.403 1.56
50
d ( m)μ - 1.8
98
d ( m)μ - 8
90 10
d / d - 13
Type hydrophobic hydrophobic
Table 2: Calculated average shear rate and Reynolds number for each rotation speed
Reynolds number Average shear rate(1/s)
Rotation speed(rpm)
93.44 24.3
500
186.88 68.77
1000
373.77 194.42
2000
560.66 357.35
3000
747.55 550
4000
934.43 769
Sample Characterization
Two types of assessment were performed on the samples; a) particle size measurement and b) rheological measurement in order to know if there had been a change in aggregate size distribution and if that change had any effect on rheological behavior of the samples.
Rheological Measurements
The rheological behavior of the samples was analyzed with an Anton Paar MCR301 rheometer, in both rotational and oscillation modes in coaxial cylinder geometry. The tests were carried out at room temperature starting with an amplitude sweep test to determine the linear viscoelastic limit of samples. Then, a small amplitude oscillatory shear test was performed in the linear region. Finally, steady state tests were carried out to measure the viscosity in the shear rate range of 0.01s−1 to 1000s−1.
Particle Size Measurements
Aggregate sizes were measured after mixing by using a Shimadzu SA-CP3 Particle Size Analyzer in the centrifugal mode and the median aggregate diameter of each sample was reported. Acetone was used to dilute the samples, lowering the viscosity to the instrument requirements. The dilution process was made cautiously to avoid any change in aggregate sizes. All particle size measurements were performed immediately after the mixing and again after several days to make sure that there was no aging effect.
RESULTS AND DISCUSSION
In the following sections, the effects of solid content and mixing shear rate on aggregate size are discussed. The results of rheological measurements have been used to study the influence of solid content and aggregate size on the rheological behavior of samples.
A- Study of Aggregate Size Distribution in Suspensions
Results of aggregate size distribution studies are presented in two sections as follows:
A1- Effect of Solid Content
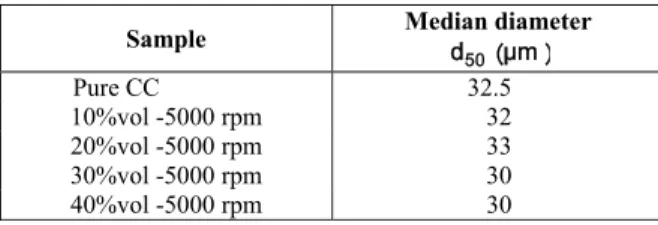
Table 3 presents the median aggregate size for different contents of calcium carbonate. Size measurements did not show any significant change
for various volume fractions in the range of 10 to 40 vol%. This can be attributed to equal improvement in the rate of aggregation and breakage, as had been assumed in some earlier modeling efforts (Kim and Kramer, 2005). However, Selomulya et al. (2001) reported formation of larger aggregates of polystyrene latex at higher solid content. It may be concluded that changes in aggregate size due to the solid content are system dependent and may be different in different ranges.
Table 3: Particle size measurement results for samples with different solid contents at a rotation speed of 5000 rpm
Sample Median diameter d5 0 μ m
Pure CC 32.5 10%vol -5000 rpm 32 20%vol -5000 rpm 33 30%vol -5000 rpm 30 40%vol -5000 rpm 30
A2- Effect of Shear Rate
Table 4 shows the median diameter of aggregates as a function of rotation speed for suspensions filled with 30 vol% calcium carbonate particles. In comparison with other studies (Selomulya et al., 2001; Colomer et al., 2005), our results did not exhibit a unique trend of increasing or decreasing median aggregate size as the rotation speed and, accordingly, the shear rate is increased. Colomer et al. (2005) showed that, upon increasing the shear rate, aggregate size increased in an aqueous solution of polystyrene sulfate latex, although their shear rates and loading were low. On the contrary, Selomulya et al. (2001) reported a drop in the aggregate size of aqueous solutions of polystyrene latex with shear rate growth at higher shear rates, although they did not observe a unique trend in the aggregate size upon increasing shear rate in the primary stages of mixing after 20 minutes. As it can be seen in Table 4, our results showed a minimum for aggregate median size when shear rate steps up in the mixing process.
with a change in flow regime, passing from laminar to turbulent regime.
This phenomenon shows that increasing the shear rate or input energy in the transient regime is not necessarily followed by a decrease in aggregate sizes for a suspension and that the opposite may occur.
Table 4: Particle size measurement results for samples with 30% volume fraction at different rotation speeds
Sample Median diameter d5 0 μ m
30%vol -500 rpm 30 30%vol -1000 rpm 22 30%vol -2000 rpm 25 30%vol -3000 rpm 26 30%vol -4000 rpm 28 30%vol -5000 rpm 30
B- Study of the Rheological Properties of Suspensions
The main objective of this study was to illustrate the effect of solid content and aggregate size on the rheological behavior.
B1- Effect of Particle Content
The particle content in suspensions clearly influences the rheological behavior. The presence of particles in filled systems results in higher viscosity, shear thinning behavior, and appearance of yield stress (Kaully et al., 2007). Hence, several researchers focused on the suspensions’ rheology as a function of solid loading and monoparticle size (Mooney, 1951, Thomas, 1965, Farris, 1968, Patzold, 1980, Cohen and Metzner, 1981, Cheng, 1984, Kaully et al., 2007). In the present study, the viscosity, stress response, and dynamic moduli of samples of different volume fractions were taken into consideration.
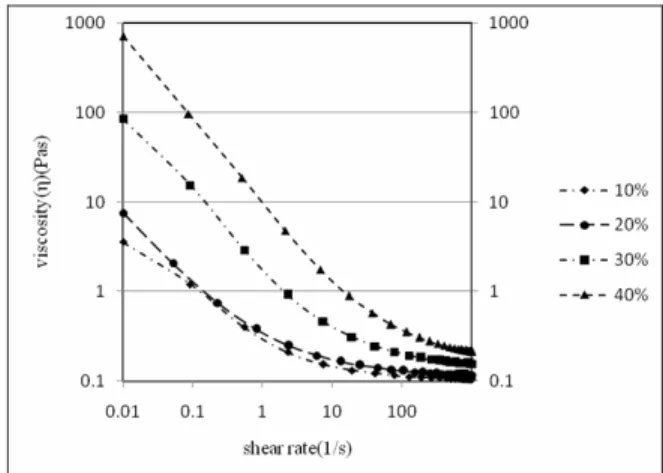
In Figure 1, the steady shear viscosity of suspensions,η, with different solid volume fractions,
φ, is given as a function of shear rate, γ•. Increasing the solid content, the viscosity increased, particularly at low shear rates. Higher viscosity of suspensions is mainly due to the existence of local structures in the media that immobilize the fluid, preventing it from participating in the hydrodynamic flow field. In all samples, shear thinning behavior was observed. Higher filler content intensified the shear thinning behavior. Quemada (1998) proposed that the structure breakdown is the reason for shear thinning
behavior in non-Brownian concentrated suspensions. The higher the filler content in the samples, the more aggregates in the system, the more susceptibility to break and the more shear thinning behavior.
Figure 1: Steady shear viscosity against shear rate for suspensions with various volume concentration of calcium carbonate
At a higher volume fraction of particles, an increase in the filler content results in a higher rate of viscosity increase. Therefore, the viscosity difference between the samples with 30% and 40% of filler is higher than the difference between 20% and 30% or 10% and 20% of calcium carbonate. This is because the former is getting closer to the maximum volume fraction of particles.
As shown in Figure 1, for suspensions with different filler content, the viscosity reaches the lowest value at high shear rates. The high shear rate viscosity was plotted against particle volume fraction in Figure 2.
Einstein and Batchelor considered the motion of a single particle and pairs of particles in the fluid equations, respectively. Their models cannot be employed to predict viscosity in our samples because ternary and multi-particle collisions become important in the suspensions containing more than 10 vol% of solid particles (Batchelor, 1977, Labanda et al., 2004). Einstein and Batchelor models are valid for dilute and semi-dilute suspensions. Jones and Dole (1929) and Krieger and Dougherty (1959) developed models for more concentrated suspensions but the measured viscosity values were lower than their predictions. The prediction was in good agreement only for the 10% suspension. The Jones and Krieger-Dougherty equations, which were obtained semi-empirically, are as follows (Jones and Dole, 1929, Krieger and Dougherty, 1959):
2 3
0(1 [ ] 5 53 )
Jonesequation
η = η + η φ+ φ + φ
(2)
m
[ ] 1.5125
0(1 / m) 0(1 / 0.605)
Krieger Dougherty equation
− η φ −
∞
η = η + φ φ = η + φ
− (3)
where φ, ηand η0 are the particle volume fraction,
suspension viscosity and fluid viscosity, respectively. [ ]η is the intrinsic viscosity, having a typical value of 2.5 for monodisperse dispersions of hard spheres, and φm is the maximum particle packing fraction, which varies from 0.495 to 0.54 under quiescent conditions and is approximately 0.605 at high shear rates (Chen et al., 2007). In equation 3, η∞is the viscosity at high shear rates. Assuming the aggregates to be hard spheres and considering the high shear rate viscosity, the right hand side of equation 3 was obtained. The equation fitted to our results, also depicted in Figure 2, was as follows:
2 3
0
5
(1 3 0.5 )
2
∞
η = η + φ+ φ + φ (4)
Compared to the Jones equation, equation 4 indicates that viscosity has a weak dependency on the cube of the volume fraction, while the coefficient of φ2 is in the range of the Jones equation.
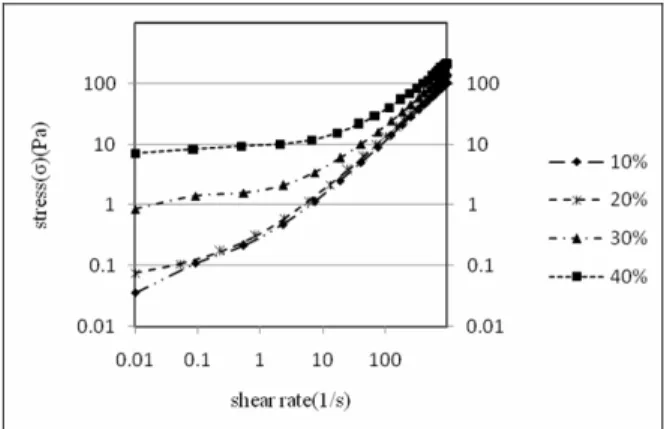
Figure 3 presents the stress values versus shear rate for samples with different solid content, showing good conformity with Casson’s equation. Casson’s equation is (Casson, 1959):
0.5
0.5 0.5
yield k
•
σ = σ + γ (5)
whereσ, σyield, •γ and k are shear stress, yield stress, shear rate and fitting parameter denoting viscosity, respectively. The values of σyield and k for each sample are given in Table 5.
Figure 3: Shear stress as a function of shear rate for various volume fractions of particles in suspensions
Table 5: σyield andkvalues for prepared samples
Sample
0 . 5 y i e l d
σ
k
10%vol -5000 rpm 0.205 0.317 20%vol -5000 rpm 0.258 0.334 30%vol -500 rpm 0.671 0.377 30%vol -1000 rpm 0.504 0.371 30%vol -2000 rpm 1.046 0.362 30%vol -3000 rpm 1.147 0.361 30%vol -4000 rpm 1.218 0.355 30%-5000 rpm 0.887 0.365 40%-5000 rpm 2.486 0.380
Increasing the volume fraction of calcium carbonate results in an increase in yield stress because of the higher number of local structures formed. Since the volume fraction of particles did not have much influence on aggregate diameter (see Table 3), it can be concluded that the volume fraction of CC was proportional to the number of aggregates. Thus, the higher the number of aggregates in the system, the higher the stress required to break up the networks.
Results of small amplitude oscillatory strain rheometry are presented in Figures 4 and 5 in terms of loss and storage moduli versus frequency. The loss and storage moduli of samples were approximately constant over the applied frequency range, increasing with the filler content. Increase of dynamic moduli for high solid content has also been reported by Palierne (1990) and Grizzuti and Pasquino (2008).
Scaling concepts introduced by De Gennes for polymer melts and gels have been applied (Buscall et al., 1988, Shih et al., 1994) to suspensions and it has been shown that there is a power law type relationship between values for the storage modulus plateau and the particle volume fraction. In agreement with scaling concepts, the experimental results showed the power law
equation, 4.122
G '=1830φ .
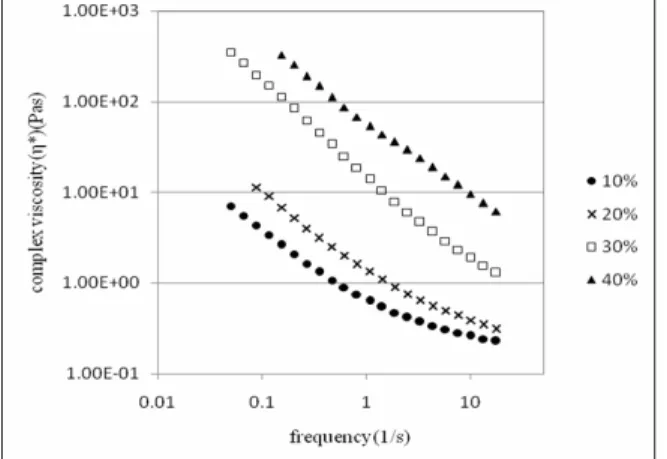
Figure 7 shows the complex viscosity of suspensions as a function of frequency. This graph confirms the shear thinning behavior. The Cox-Mertz rule was checked and, in contrast to Kaully et al. (2007), it was not valid for any of the samples due to structural changes in the steady shear tests.
Figure 4: Samples’ loss modulus against frequency for various volume fractions of calcium carbonate
Figure 5: Samples’ storage modulus against frequency for various volume fractions of calcium carbonate
Figure 6: Storage modulus in the plateau region against volume fractions of calcium carbonate and fitted line
B2- Effect of Aggregate Size
Apart from the effect of particle content and number of aggregates on the rheological behavior of suspensions, aggregate size, determined with the Particle Size Analyzer, was found to have a great influence on the viscosity of the samples. In previous studies, the effect of particle size was taken into consideration and the rheological behavior of a bimodal particle size distribution has also been examined (Kaully et al., 2007). The aggregate sizes for the samples with 30% solid content are presented in Table 4. Figure 8 shows the viscosity of the samples with 30% solid content versus shear rate that were mixed with different speeds. Kaully et al. (2007) reported that the viscosity is unaffected by particle size up to roughly 40 vol% of calcium carbonate in PDMS and found that fine filler suspensions exhibit much higher viscosity at a given loading, but made no argument about the aggregate size composed of monoparticles in the system. On the other hand, Quemada (1998) proposed the effective volume fraction concept to show the structural variation at a constant solid content and illustrated that structure breakdown leads to a drop in the viscosity. As shown in Figure 8, small changes in aggregate size can have a large impact on suspension viscosity. Increasing the aggregate size resulted in higher viscosity, markedly at low shear rates. When the shear rate increases, the sensitivity to the local structure size decreases and approximately vanishes at high shear rates. The shear rate ranges from 24.3 to 769s−1in our experiments and mixing time was 20 minutes. Shear deformation
in dynamic tests (γ = γ ω•/ )was much lower than what was in the mixing process. Therefore, shear thinning was attributed to the breakdown of agglomerates composed of aggregates that had been obtained at the end of the mixing process and could be formed by short-range interactions in the period after the mixing process and before the rheometry tests. A relationship was found between the aggregate size obtained after the mixing process and the suspension viscosity in the rotational tests. The results may be explained in terms of agglomerates composed of bigger aggregates greater in size than those formed from smaller aggregate attachment, leading to more fluid captivity and thus higher viscosity. George et al. (2004) studied the effect of aggregate size of alumina particles in distilled water on sediment bed rheological properties. They produced two different aggregate sizes in low and high salt aggregation conditions and they found that increasing the aggregate size causes higher yield stresses.
Figure 8: Shear steady viscosity of 30 vol% suspensions as a function of shear rate
The viscosity difference in suspensions filled with 30% vol of calcium carbonate was higher at lower shear rates. Passing a critical shear rate, no matter how a sample is prepared, the viscosity values increase up to the same value. This is due to the fact that the viscosity of a suspension with constant particle content depends strongly on the aggregate size and amount of imposed strain. The aggregate size is determined by the prior processes performed on the suspension and the shear deformation value is dictated by circumstances of application. The viscosity of a suspension, therefore, can be tailored through adjusting the aggregate size in prior processes and adjusting the shear strain, which can be applied in a defined geometry.
CONCLUSION
Casson’s model properly explained the stress response of the prepared samples. At a constant solid loading, the aggregate size has a great influence on the viscosity of suspensions particularly at lower shear rates. Bigger aggregates cause higher viscosity in suspensions due to the higher effective volume of particles and more immobilized liquid inside the local structures. The viscosity of a suspension can be influenced by aggregate sizes formed in earlier processes and the shear strain, which can be applied in a defined geometry.
REFERENCES
Batchelor, G. K., The effect of Brownian motion on the bulk stress in a suspension of spherical particles, J. Fluid Mech. 83, pp. 97-117 (1977). Buscall R., Mills P. D. A., Goodwin J. W. and
Lawson D. W., Scaling behavior of the rheology of aggregate networks formed from colloidal particles, J. Chem. Soc. Faraday Trans. 84, pp. 4249-4260 (1988).
Camp, T. R., Stein, P. C., Velocity gradients and internal work in fluid motion, J. Boston Soc. Civ. Eng. 30, pp. 219-237 (1943).
Casson, N., A Flow Equation for Pigmented-Oil Suspensionof the PrintingInkType, inRheology of Disperse Systems, edited by C. C. Mill, PergamonPress, New York, pp. 82-104 (1959).
Chen, H., Ding, Y., Tan, C., Rheological behavior nanofluids, New J. Phys. 9, pp. 367-382 (2007). Cheng, D. C. H., Further observations on the
rheological behavior of dense suspensions, Powder Technology 37, pp. 255-273 (1984). Chong J. S., Christiansen E. B., Baer A. D., Rheology
of concentrated suspensions, J. Appl. Polym. Sci, 15, pp. 2007-21 (1971).
Clark, M. M., Critique of Camp and Stein’s RMS velocity gradient. J. Env. Eng., 111 (6), pp. 741-754 (1985).
Cohen, Y. and Metzner, A. B., Wall effects in laminar flow of fluids through packed beds. AIChE J., 27, pp. 705-714 (1981).
Colomer, J., Peters, F., Marrase, C., Experimental analysis of coagulation of particles under low-shear flow, Water Research 39, pp. 2994-3000 (2005). Farris, R. J., Prediction of the viscosity of multimodal
suspensions from unimodal viscosity data, Trans. Sot. Rheol., 12, pp. 281-301 (1968).
Franks, G, V., Ying Zhou, Yao-de Yan, Jameson, G. J. and Biggs, S., Effect of aggregate size on sediment bed rheological properties, Phys. Chem. Chem. Phys., 6, pp. 4490-4498 (2004).
Grizzuti, N., Pasquino, R., Effects of matrix viscoelasticity on rheology of dilute and semi-dilute suspensions of non-Brownian rigid spheres, The Society of Rheology 80th Annual Meeting, California (2008).
Jancar, J., Mineral fillers in thermoplastics I, Advances in Polymer Science 139, Berlin: Springer (1999).
Jones, G., and Dole, M., Viscosity of aqueous solutions of strong electrolytes with special reference to barium chloride, J. Amer. Chem. Soc., 51, pp. 2950-2964 (1929).
Kaully, T., Siegmann, A., Shacham, D., Rheology of highly filled natural CaCO3 composites, I. Effects of solid loading and particle size distribution on capillary rheometry, Polymer Composites 28, pp. 512-523 (2007).
Kaully, T., Siegmann, A., Shacham, D., Rheology of highly filled natural CaCO3 composites II. Effects of solid loading and particle size distribution on rotational rheometry, Polymer Composites 28, pp. 524-533 (2007).
Kim, J., and Kramer, T. A., Improved models for fractal colloidal agglomeration: computationally efficient algorithms, Coll. Surf., A 253, pp. 33-49 (2005).
Krieger, I. M., and Dougherty, T. J., A mechanism for non-Newtonian flow in suspensions of rigid spheres, Trans. Soc. Rheol., 20, pp. 137-152 (1959).
Labanda, J., Marco, P. and Llorens, J., Rheological model to predict the thixotropic behaviour of colloidal dispersions, Colloids and Surfaces A, 49, pp. 123-126 (2004).
Larson, R. G., The structure and rheology of complex fluids, Oxford University Press, New York (1999).
Le Meins, J. F., Moldenaers, P., and Mewis, J., Suspensions in polymer melts. 1. Effect of particle size on the shear flow behavior, Ind. Eng. Chem. Res. 41, pp. 6297-6304 (2002).
Liu, D. M., Tseng, W. J., Yield behavior of Zirconia-Wax suspensions, Mat. Sci. Eng. A, 254, pp. 136-146 (1998).
Mooney, M., The viscosity of a concentrated suspension of spherical particles, J. Colloid Sci., 6, pp. 162-170 (1951).
Olhero, S. M., Ferreira, J. M. F., Influence of particle size distribution on rheology and particle packing of silica-based suspensions, J. Powder. Technol., 139, pp. 69-75 (2004).
Patzold, R., Die Abhängigkeit des Fließverhaltens konzentrierter Kugelsuspensionen von der Strömungsform: Ein Vergleich der Viskosität in Scher-und Dehnströmungen, Rheol. Acta, 19, pp. 322-344 (1980).
Quemada, D., Rheological modeling of complex fluids. I. The concept of effective volume fraction revisited, European Physical Journal, Applied Physics, 1 (1), pp. 119-127 (1998).
Richmond, W. R., Jones, R. L., Fawell, P. D., The relationship between particle aggregation and rheology in mixed silica-titania suspensions, Chemical Engineering J., 71, pp. 67-75 (1998). Russel, W. B., Theoretical approaches to the
rheology of concentrated dispersions, Powder Technol., 51, pp.15-25 (1987).
Selomulya, C., Amal, R., Bushell, G. and Waite, T. D., Evidence of shear-rate dependence on restructuring and breakup of latex aggregates, J. Colloid Interface Sci., 236, pp. 67-77 (2001). Selomulya, C., The effect of shear on flocculation
and floc size/structure, Ph.D. thesis, University of New South Wales, Australia (2001).
Shenoy, A. V., Rheology of filled polymer systems,
Kluwer Academic Publishers, London (1999). Shih, W. H., Shih, W. Y., Kim, S. J., Lui, J., and
Aksay, I. A., Scaling behavior of elasticity properties of colloidal gels, Phys. Rev. A, 42, pp. 4772-4779 (1994).
Shikata, T., Pearson, D. S., Viscoelastic behavior of concentrated spherical suspensions, J. Rheol., 38, pp. 601-616 (1994).
Teleki, A., Wengeler, R., Wengeler, L., Nirschl, H., and Pratsinis, S. E., Distinguishing between aggregates and agglomerates of flame-made TiO2 by high-pressure dispersion, Powder Technology 181, pp. 292-300 (2008),
Thomas, D. G., Transport characteristics of suspension: VIII. A Note the Viscosity of Newtonian suspensions of uniform spherical particles, J. Colloid Science, 20, pp. 267-277 (1965).
Tseng, W. J. and Lin, K. C., Rheology and colloidal structure of aqueous TiO nanoparticle suspensions, Mater. Sci. Eng., A, 355, pp. 186-192 (2003). van der Werff, J. C., de Kruif, C. G., Blom, C. and