BGD
11, 8861–8923, 2014Pasture degradation modifies the water and carbon cycles of the Tibetan highlands
W. Babel et al.
Title Page
Abstract Introduction
Conclusions References
Tables Figures
◭ ◮
◭ ◮
Back Close
Full Screen / Esc
Printer-friendly Version
Interactive Discussion
Discussion
P
a
per
|
Discus
sion
P
a
per
|
Discussion
P
a
per
|
Discussion
P
a
per
|
Biogeosciences Discuss., 11, 8861–8923, 2014 www.biogeosciences-discuss.net/11/8861/2014/ doi:10.5194/bgd-11-8861-2014
© Author(s) 2014. CC Attribution 3.0 License.
This discussion paper is/has been under review for the journal Biogeosciences (BG). Please refer to the corresponding final paper in BG if available.
Pasture degradation modifies the water
and carbon cycles of the Tibetan
highlands
W. Babel1, T. Biermann1,*, H. Coners2, E. Falge1, E. Seeber3, J. Ingrisch4,**, P.-M. Schleuß4, T. Gerken1,5,***, J. Leonbacher1, T. Leipold1, S. Willinghöfer2, K. Schützenmeister6, O. Shibistova7,8, L. Becker7, S. Hafner4, S. Spielvogel4,6, X. Li9, X. Xu4,10, Y. Sun4,10, L. Zhang11, Y. Yang12, Y. Ma11, K. Wesche3,13, H.-F. Graf5, C. Leuschner2, G. Guggenberger7, Y. Kuzyakov4,14,15, G. Miehe16, and T. Foken1,17
1
University of Bayreuth, Department of Micrometeorology, Bayreuth, Germany 2
University of Göttingen, Department of Plant Ecology and Ecosystem Research, Göttingen, Germany
3
Senckenberg Museum Görlitz, Department of Botany, Görlitz, Germany 4
University of Göttingen, Department of Soil Sciences of Temperate Ecosystems, Göttingen, Germany
5
BGD
11, 8861–8923, 2014Pasture degradation modifies the water and carbon cycles of the Tibetan highlands
W. Babel et al.
Title Page
Abstract Introduction
Conclusions References
Tables Figures
◭ ◮
◭ ◮
Back Close
Full Screen / Esc
Printer-friendly Version
Interactive Discussion
Discussion
P
a
per
|
Discus
sion
P
a
per
|
Discussion
P
a
per
|
Discussion
P
a
per
|
6
University of Koblenz-Landau, Institute of Integrated Environmental Sciences, Koblenz, Germany
7
Leibniz Universität Hannover, Institute for Soil Science, Hannover, Germany 8
V. N. Sukachev Institute of Forest, Krasnoyarsk, Russia 9
School of Life Sciences, Lanzhou University, Lanzhou, China 10
Chinese Academy of Sciences, Institute of Geographical Sciences and Natural Resources Research, Beijing, China
11
Chinese Academy of Sciences, Institute of Tibetan Plateau Research, Key Laboratory of Tibetan Environment Changes and Land Surface, Processes, Beijing, China
12
Chinese Academy of Sciences, Institute of Tibetan Plateau Research, Laboratory of Alpine Ecology and Biodiversity Focuses, Processes, Beijing, China
13
German Centre for Integrative Biodiversity Research (iDiv) Halle–Jena–Leipzig, Germany 14
University of Göttingen, Department of Agricultural Soil Science, Göttingen, Germany 15
Institute of Environmental Sciences, Kazan Federal University, Kazan, Russia 16
University of Marburg, Faculty of Geography, Marburg, Germany 17
Member of Bayreuth Center of Ecology and Ecosystem Research, Bayreuth, Germany *
now at: Lund University, Centre for Environmental and Climate Research, Lund, Sweden **
now at: University of Innsbruck Institute of Ecology Research, Innsbruck, Austria ***
now at: The Pennsylvania State University, Department of Meteorology, University Park, PA, USA
Received: 21 May 2014 – Accepted: 29 May 2014 – Published: 12 June 2014
Correspondence to: T. Foken (thomas.foken@uni-bayreuth.de)
BGD
11, 8861–8923, 2014Pasture degradation modifies the water and carbon cycles of the Tibetan highlands
W. Babel et al.
Title Page
Abstract Introduction
Conclusions References
Tables Figures
◭ ◮
◭ ◮
Back Close
Full Screen / Esc
Printer-friendly Version
Interactive Discussion
Discussion
P
a
per
|
Discus
sion
P
a
per
|
Discussion
P
a
per
|
Discussion
P
a
per
|
Abstract
The Tibetan Plateau has a significant role with regard to atmospheric circulation and the monsoon in particular. Changes between a closed plant cover and open bare soil are one of the striking effects of land use degradation observed with unsustainable
range management or climate change, but experiments coupling changes of surface 5
properties and processes with atmospheric feedbacks are rare and have not been undertaken in the world’s two largest alpine ecosystems, the alpine steppe and the Ko-bresia pygmaeapastures of the Tibetan plateau. We coupled measurements of micro-lysimeter, chamber,13C labeling, and eddy-covariance and combined the observations with land surface and atmospheric models, adapted to the highland conditions. This 10
allowed us to analyze how three degradation stages affect the water and carbon cycle
of pastures on the landscape scale within the core region of the Kobresia pygmaea
ecosystem. The study revealed that increasing degradation of theKobresiaturf affects
carbon allocation and strongly reduces the carbon uptake, compromising the function ofKobresiapastures as a carbon sink. Pasture degradation leads to a shift from transpi-15
ration to evaporation while the total sum of evapotranspiration remains unaffected. The
results show an earlier onset of convection and cloud generation, likely triggered by enhanced evaporation. Consequently, precipitation starts earlier and clouds decrease the incoming solar radiation. In summary, the changes in surface properties by pasture degradation found on the highland have a significant influence on larger scales. 20
1 Introduction
Alpine ecosystems are considered as highly vulnerable to the impact of climate and land use change. This is especially the case for two of the world’s highest and largest alpine ecosystems: theKobresia pygmaeapastures covering 450 000 km2in the south-east and the alpine steppe covering 600 000 km2 in the northwest of the Tibetan 25
BGD
11, 8861–8923, 2014Pasture degradation modifies the water and carbon cycles of the Tibetan highlands
W. Babel et al.
Title Page
Abstract Introduction
Conclusions References
Tables Figures
◭ ◮
◭ ◮
Back Close
Full Screen / Esc
Printer-friendly Version
Interactive Discussion
Discussion
P
a
per
|
Discus
sion
P
a
per
|
Discussion
P
a
per
|
Discussion
P
a
per
|
2 cm in height with up to 98 % cover ofKobresia pygmaea, as main constituent of a felty turf (Kaiser et al., 2008; Miehe et al., 2008b). The alpine steppe is a central Asian short grass steppe with alpine cushions and a plant cover declining from 40 % in the east to 10 % in the west (Miehe et al., 2011). Both ecosystems are linked by an ecotone of 200 km in width over 2000 km length (Fig. 1).
5
Obvious features of degradation in theKobresiapastures and their ecotone are con-troversially discussed as being caused by either natural abiotic and biotic processes or human impacts (Zhou et al., 2005). The most widespread pattern are mosaics of (i) closed Kobresia grazing lawns (later named as Intact root Mat, IM), (ii) root turf that is only sparsely vegetated byKobresia pygmaeabut sealed with Cyanophyceae (later 10
named as partly Degraded root Mat, DM), and (iii) open loess and gravels that are sparely colonised by cushions, rosettes and small grasses of the alpine steppe (later named as Bare Soil, BS).
Assessments of pasture degradation have been either based on biotic parameters such as decreasing vegetation cover, species diversity, productivity and forage qual-15
ity, or alternatively on abiotic factors including nutrient loss, soil compaction and on-going soil erosion (Harris, 2010). A definition of degradation stages was given by Liu et al. (2003) and later on used by Zhou et al. (2005). According to a study by Niu (1999), 30 % of theKobresiagrassland is degraded at various levels. Holzner and Kriechbaum (2000) reported that about 30 % is in optimal condition, about 30 % shows characteris-20
tics of overgrazing where regeneration seems to be possible after improved utilisation and about 40 % shows recent or ancient complete degradation. Here, we regard bare silty soil as the final degradation stage of a formerKobresiapasture with its intact root turf. Loss ofKobresiacover goes along with a decrease of palatable species and thus pasture quality.
25
BGD
11, 8861–8923, 2014Pasture degradation modifies the water and carbon cycles of the Tibetan highlands
W. Babel et al.
Title Page
Abstract Introduction
Conclusions References
Tables Figures
◭ ◮
◭ ◮
Back Close
Full Screen / Esc
Printer-friendly Version
Interactive Discussion
Discussion
P
a
per
|
Discus
sion
P
a
per
|
Discussion
P
a
per
|
Discussion
P
a
per
|
atmospheric processes as well as more general analysis of interactions is necessary (Cui and Graf, 2009). Only when this challenge has been met can the effect be
inves-tigated in climate models, both for the past, but mainly for a future climate. Therefore, there is an urgent need to identify the parameters and factors influencing the pastures and to quantify energy and matter fluxes.
5
In order to model fluxes overKobresiaand degraded areas, it is necessary to identify those model parameters which change significantly due to any degradation present. Three parameters could reflect these problems:
– Missing vegetation: the difference is considered in the simulation through the
frac-tion of vegetated areas and the respective parameter differences between bare
10
soil evaporation and grassland evapotranspiration, as well as assimilation and respiration.
– Different soil properties: due to the missing Kobresia turf, soil properties of the
upper layer might be changed: less living and dead organic material lead to poor isolation and switch from hydrophobic to more hydrophilic properties, thus leading 15
to higher infiltration capacity and higher soil hydraulic conductivity.
– The available energy changes mostly due to albedo differences and outgoing
longwave radiation. Furthermore, the direct solar irradiation is much larger than diffuse radiation compared to other regions of the world.
Degradation of vegetation and soil surface at the plot scale leads to changes of water 20
and carbon fluxes, as well as carbon stocks, at the ecosystem level, with consequences for the whole Tibetan plateau. The aim of this study was to analyze and model for the first time the water and carbon fluxes in the above-mentioned three types of surface patterns of Kobresia pastures on the Tibetan Plateau. We combine the benefits of observing water and carbon fluxes at the plot scale, using micro-lysimeter, chamber-25
BGD
11, 8861–8923, 2014Pasture degradation modifies the water and carbon cycles of the Tibetan highlands
W. Babel et al.
Title Page
Abstract Introduction
Conclusions References
Tables Figures
◭ ◮
◭ ◮
Back Close
Full Screen / Esc
Printer-friendly Version
Interactive Discussion
Discussion
P
a
per
|
Discus
sion
P
a
per
|
Discussion
P
a
per
|
Discussion
P
a
per
|
are focused on land surface models, where the description of plant and soil parame-ters is more explicitly parameterized than in larger-scale models. They bridge between the plot and the ecosystem scale and simulate the influence of increasing degrada-tion on water and carbon fluxes, which ultimately leads to changes of cloud cover and precipitation.
5
2 Material and methods
2.1 Study sites
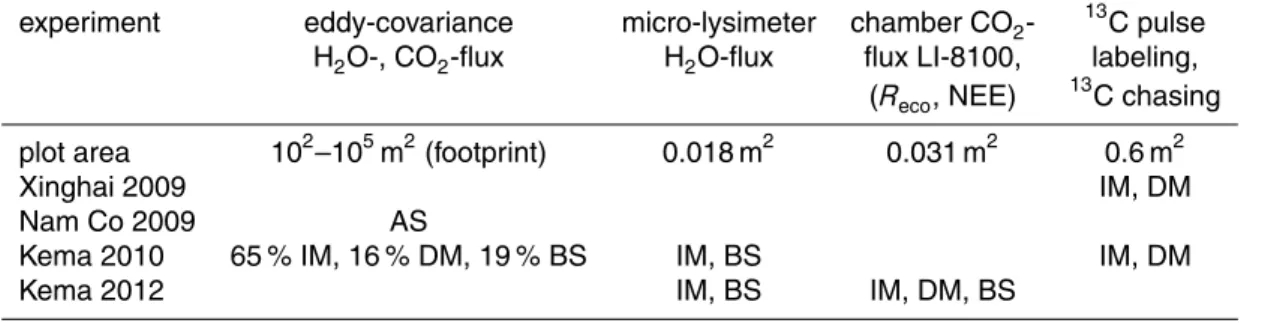
For the present study, measurements were taken at three study sites on the Tibetan plateau. Details are given in Table 1. For the experimental activities at the sites see Sect. 2.5.
10
Xinghai: The experimental site is located in Qinghai province in the northeastern Tibetan Plateau, approximately 200 km southwest of Xining, and about 15 km south of Xinghai city. The montane grassland has developed on a loess-covered (1.2 m) terrace of the Huang He River. The grassland is used as a winter pasture for yaks and sheep 15
for 6–7 months of the year (Miehe et al., 2008b; Unteregelsbacher et al., 2012). About 20 % of the pasture at the experiment site is completely covered with blue-green algae and crustose-lichens.
Kema: The “Kobresia pygmaea Research Station Kema”, established in 2007, is lo-20
cated in the core area of alpine Kobresia pygmaea pasture. All measurements were established either within or in the close surroundings of an area of 100 m by 250 m, fenced in 2009, on a pasture where grazing was restricted to a few months during winter and spring. The growing season strongly depends on the availability of water, and usually starts at the end of May with the onset of the monsoon and ends with 25
BGD
11, 8861–8923, 2014Pasture degradation modifies the water and carbon cycles of the Tibetan highlands
W. Babel et al.
Title Page
Abstract Introduction
Conclusions References
Tables Figures
◭ ◮
◭ ◮
Back Close
Full Screen / Esc
Printer-friendly Version
Interactive Discussion
Discussion
P
a
per
|
Discus
sion
P
a
per
|
Discussion
P
a
per
|
Discussion
P
a
per
|
vegetation grazed height of 1–2 cm (Miehe et al., 2008b) and forms a very tough felty root turf of living and deadKobresiaroots, leaf bases and soil organic matter (Kaiser et al., 2008). It is designated asKobresia root mat throughout this study and attains a thickness of 14 cm.
The site is covered with Kobresia pygmaea (Cyperaceae), accompanied by other 5
monocotyledons (Carex ivanoviae, Carex spp., Festuca spec., Kobresia pusilla, Poa
spp.,Stipa purpurea) and to a minor degree by perennial herbs. For more details on the species diversity see Biermann et al. (2011, 2013).
Nam Co:The “Nam Co Monitoring and Research Station for Multisphere Interactions” 10
(NAMORS) of the Institute of Tibetan Plateau Research of the Chinese Academy of Science (Ma et al., 2008) is located within an intramontane basin, 1 km SE of Lake Nam Co and in approximately 10 km distance NNW of the foot of the Nyainqentanglha mountain range. The zonal vegetation comprises mosaics ofKobresiaturfs and open alpine steppe; water surplus sites have degraded Cyperaceae swamps (Mügler et al., 15
2010; Wei et al., 2012; Miehe et al., 2014).
2.2 Classification of the degradation classes at Kema site
The degradation classes were recorded at a defined area of 5 cm×5 cm over a regular grid according to the step point method (Evans and Love, 1957), yielding a total of 2618 observations. The vegetation distribution is then calculated from the frequency of 20
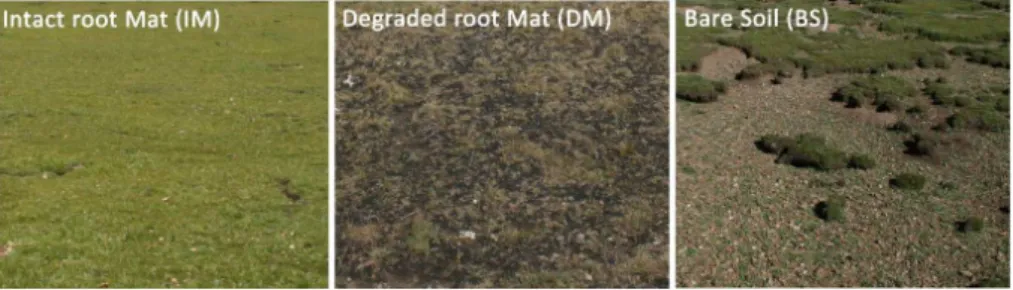
a given vegetation type vs. the total number of sampling points. Vegetation along each transect was classified according to the following classes (Fig. 2, Table 2): Intact root Mat (IM), Degraded root Mat (DM) and Bare Soil (BS).
Intact root Mat (IM)
Although this degradation class is named as IM in this study, according to the definition 25
char-BGD
11, 8861–8923, 2014Pasture degradation modifies the water and carbon cycles of the Tibetan highlands
W. Babel et al.
Title Page
Abstract Introduction
Conclusions References
Tables Figures
◭ ◮
◭ ◮
Back Close
Full Screen / Esc
Printer-friendly Version
Interactive Discussion
Discussion
P
a
per
|
Discus
sion
P
a
per
|
Discussion
P
a
per
|
Discussion
P
a
per
|
acterized as 90–98 % cover ofKobresia pygmaea,and additionally occurring biennial rosette species (Miehe et al., 2008b), which is not the case at Kema site. Neverthe-less, soil is covered completely with the characteristic root turf of these Cyperaceae communities and a fairly closed cover of vegetation can be observed.
Degraded root Mat (DM) 5
For the DM class, not only is the spatial cover ofKobresia pygmaeamuch lower (less than 26 %), but also the proportion of crusts compared to IM is much higher; the root turf is still present. Crusts were formed by Cyanophyceae (blue algaea, Miehe et al., 2008b; Unteregelsbacher et al., 2012) and were a characteristic property of this clas-sification.
10
Bare soil (BS)
In contrast to IM and DM, this surface class is missing the dense root turf andKobresia pygmaeacompletely, resulting in a height step change (Table 2). Most of the surface is unvegetated, nevertheless annual and perennial plants still occur, e.g.Lancea tibetica
andSaussurea stoliczkai, described as endemic biennial rosettes and endemic plants 15
with rhizomes, adapted to soil movement and the occurrence of trampling (Miehe et al., 2011).
With a Kobresia pygmaea (Cyperaceae) cover of approximately 65 %, an area of 16 % crust-covered turf as well as 19 % bare soil spots, the main study site is consid-ered to be a typical alpineKobresia pygmaeapasture with a low to medium degradation 20
BGD
11, 8861–8923, 2014Pasture degradation modifies the water and carbon cycles of the Tibetan highlands
W. Babel et al.
Title Page
Abstract Introduction
Conclusions References
Tables Figures
◭ ◮
◭ ◮
Back Close
Full Screen / Esc
Printer-friendly Version
Interactive Discussion
Discussion
P
a
per
|
Discus
sion
P
a
per
|
Discussion
P
a
per
|
Discussion
P
a
per
|
2.3 Measuring methods
2.3.1 Micrometeorological measurements
The measurements of the water and carbon fluxes with the eddy-covariance (EC) method were conducted at Nam Co site in 2009 and at Kema site in 2010. The EC tow-ers were equipped with CSAT3 sonic anemomettow-ers (Campbell Sci. Inc.) and LI-7500 5
(LI-COR Biosciences) gas analyzers. The complete instrumentation, including radia-tion and soil sensors, is given in Appendix A; for more details see Zhou et al. (2011) and Biermann et al. (2011, 2013).
Turbulent fluxes were calculated and quality controlled based on micrometeorolog-ical standards (Aubinet et al., 2012) through the application of the software pack-10
age TK2/TK3 developed at the University of Bayreuth (Mauder and Foken, 2004, 2011). This includes all necessary data correction and data quality tools (Foken et al., 2012a), was approved by comparison with six other commonly used software pack-ages (Mauder et al., 2008) and successfully applied in numerous international field campaigns. It also offers a quality flagging system evaluating stationarity and
devel-15
opment of turbulence (Foken and Wichura, 1996; Foken et al., 2004). Furthermore, a footprint analysis was performed (Göckede et al., 2004, 2006), which showed that the footprint area was within the classified land use type.
For the interpretation of the results, the so-called un-closure of the surface energy balance (Foken, 2008) with eddy-covariance data must be taken into account, espe-20
cially when comparing eddy-covariance measurements with models that close the en-ergy balance, like SEWAB (Kracher et al., 2009), or when comparing evapotranspi-ration sums with micro-lysimeter measurements. For Nam Co site Zhou et al. (2011) found that only 70 % of the available energy (net radiation minus ground heat flux) con-tributes to the sensible and latent heat flux, which is similar to the findings of other 25
BGD
11, 8861–8923, 2014Pasture degradation modifies the water and carbon cycles of the Tibetan highlands
W. Babel et al.
Title Page
Abstract Introduction
Conclusions References
Tables Figures
◭ ◮
◭ ◮
Back Close
Full Screen / Esc
Printer-friendly Version
Interactive Discussion
Discussion
P
a
per
|
Discus
sion
P
a
per
|
Discussion
P
a
per
|
Discussion
P
a
per
|
we assume that the missing energy is to a large extent part of the sensible heat flux (Foken et al., 2011; Charuchittipan et al., 2014), which was also postulated from model studies (Ingwersen et al., 2011). We thus corrected the turbulent fluxes for the miss-ing energy accordmiss-ing to the percentage of sensible and latent heat flux contributmiss-ing to the buoyancy flux following the suggestion of (Charuchittipan et al., 2014). This cor-5
rection method attributes most of the residual to the sensible heat flux depending on the Bowen ratio; i.e. more than 90 % in case of Bo=1, and roughly 60 % in case of
Bo=0.1. In contrast, eddy-covariance derived NEE fluxes were not corrected (Foken
et al., 2012a).
2.3.2 Soil hydrological measurements 10
In order to directly assess hydrological properties of the different degradation stages
we used small weighing micro-lysimeters as a well-established tool to monitor evapo-transpiration, infiltration and volumetric soil water content (Wieser et al., 2008; van den Bergh et al., 2013). As it was necessary to allow for quick installation with minimum disturbance, we developed a technique based on near-natural monoliths extracted in 15
transparent plexiglass tubes (diameter 15 cm, length 30 cm). The monoliths were visu-ally examined for intactness of the soil structure and artificial water pathways along the sidewall and then reinserted in their natural place inside a protecting outer tube (inner diameter 15 cm).
A general problem with soil monoliths is the disruption of the flow paths to the lower 20
soil horizons leading to artificially high water saturation in the lower part of the monolith (Ben-Gal and Shani, 2002; Gee et al., 2009). This was prevented by applying a con-stant suction with 10 hPa of a hanging water column maintained by a spread bundle of 20 glass wicks (2 mm diameter) leading through the bottom plate into a 10 cm long downward pipe (15 mm diameter). Drained water was collected in a 200 mL PE bottle. 25
BGD
11, 8861–8923, 2014Pasture degradation modifies the water and carbon cycles of the Tibetan highlands
W. Babel et al.
Title Page
Abstract Introduction
Conclusions References
Tables Figures
◭ ◮
◭ ◮
Back Close
Full Screen / Esc
Printer-friendly Version
Interactive Discussion
Discussion
P
a
per
|
Discus
sion
P
a
per
|
Discussion
P
a
per
|
Discussion
P
a
per
|
of 1 m. All micro-lysimeters were weighed every 2 to 10 days with a precision hanging balance from 23 June to 5 September 2010 and from 2 June to 5 September 2012. Soil cores (3.3 cm diameter, 30 cm depth) were taken near every micro-lysimeter on 29 June 2010. The soil samples were weighed fresh and after drying in the laboratory at Lhasa. By relating the given water content to the weight of the corresponding micro-5
lysimeter at that date, we were able to calculate volumetric soil water content for each micro-lysimeter over the whole measuring period.
2.3.3 Soil gas exchange measurements
In 2012, CO2 flux measurements were conducted with a long-term chamber system from LI-COR Biosciences (Lincoln, NE, USA). This LI-COR long term chamber sys-10
tem contains a LI-8100 Infrared Gas Analyser (LI-COR Lincoln, NE, USA), is linked with an automated multiplexing system (LI-8150) and two automated chambers, one opaque and the other transparent forRecoand net ecosystem exchange (NEE), respec-tively. The chambers are equipped with a fully automatically rotating arm that moves the chamber 180◦ away from the collar and therefore ensures undisturbed patterns 15
of precipitation, temperature and radiation. Furthermore, by moving the chamber in-between measurements the soil and vegetation itself experiences less disturbance. The applied LI-COR chambers were compared during a separate experiment against eddy-covariance measurements by Riederer et al. (2014). Besides differences – mainly
under stable atmospheric stratification – the comparison was satisfactory. For daily 20
sums, the reported differences should compensate.
The three surface types IM, DM and BS were investigated with respect to their CO2 fluxes between 30 July and 26 August 2012 at Kema. The CO2-flux measurements of the three treatments were conducted consecutively. Therefore, the long–term cham-bers were moved to a patch representing the surface of interest. Measurements were 25
BGD
11, 8861–8923, 2014Pasture degradation modifies the water and carbon cycles of the Tibetan highlands
W. Babel et al.
Title Page
Abstract Introduction
Conclusions References
Tables Figures
◭ ◮
◭ ◮
Back Close
Full Screen / Esc
Printer-friendly Version
Interactive Discussion
Discussion
P
a
per
|
Discus
sion
P
a
per
|
Discussion
P
a
per
|
Discussion
P
a
per
|
Intact root mat has been measured twice during the observation period to provide information about possible changes in the magnitude of CO2-fluxes, due to changing meteorological parameters. The two measurements will be denoted as IM period 1 and IM period 4. Note that during the measurement of IM period 4, other collars than during IM period 1 have been investigated. Nevertheless, the patches selected for the 5
collar installation consisted of the same plant community, and showed the same soil characteristics. Because of lack of time the other two surfaces BS and DM were only measured once, but as long as possible to gather sufficient information on diurnal
cy-cles for these treatments.
2.3.4 13C labeling 10
13
CO2 pulse labeling experiments were used to trace allocation of assimilated C in the shoot–root–soil system in a montaneKobresia pygmaeapasture 2009 in Xinghai (Hafner et al., 2012) and in alpineKobresia pygmaeapasture 2010 in Kema (Ingrisch et al., 2014). Plots (0.6×0.6 m2) with plants were labelled with 13C-enriched CO2 in transparent chambers over four hours at the periods of maximal Kobresia growth in 15
summer. Afterwards,13C was chased in the plant–soil system over a period of 2 months with increasing sampling intervals (10 times).
Aboveground biomass was clipped and belowground pools were sampled with a soil core (0–5, 5–15 cm and in Xinghai additionally in 15–30 cm). After drying and sieving (2 mm), two belowground pools were separated into soil and roots. As the only means 20
of obtaining measurements of soil CO2 efflux and its δ 13
C in a remote location, the static alkali absorption method with installation of NaOH-traps was used (Lundegardh, 1921; Singh and Gupta, 1977; Hafner et al., 2012). Natural13C abundance in the pools of plant–soil systems, including CO2 efflux, was sampled with a similar procedure on unlabelled spots. Total carbon and nitrogen content and δ13C of the samples were 25
BGD
11, 8861–8923, 2014Pasture degradation modifies the water and carbon cycles of the Tibetan highlands
W. Babel et al.
Title Page
Abstract Introduction
Conclusions References
Tables Figures
◭ ◮
◭ ◮
Back Close
Full Screen / Esc
Printer-friendly Version
Interactive Discussion
Discussion
P
a
per
|
Discus
sion
P
a
per
|
Discussion
P
a
per
|
Discussion
P
a
per
|
All data from13C labelling experiments are presented as means±standard errors. The significance of differences was analyzed by ANOVA atα=0.05.
2.4 Soil–vegetation–atmosphere transfer models
We conducted model experiments in order to estimate the impact of the defined degra-dation classes on water and carbon fluxes, including feedback on atmospheric circu-5
lation. Therefore three 1-D soil–vegetation–atmosphere transfer models were utilized to examine, (i) evapotranspiration: SEWAB (Mengelkamp et al., 1999, 2001), (ii) car-bon fluxes: SVAT-CN (Reichstein, 2001; Falge et al., 2005), (iii) surface feedbacks: hy-brid vegetation dynamics and biosphere model (Friend et al., 1997; Friend and Kiang, 2005). While the first two models were driven by measured standard meteorological 10
forcing data, the latter is fully coupled to the atmosphere with the cloud-resolving Active Tracer High-resolution Atmospheric Model (ATHAM, Oberhuber et al., 1998; Herzog et al., 2003), which allows for feedbacks of land surface exchange to the atmosphere (see Appendices B and C for more detailed descriptions of the models).
Land surface modelling of energy and carbon dioxide exchange faces specific prob-15
lems on the Tibetan Plateau due to its high elevation and semi-arid conditions: a strong diurnal cycle of the surface temperature (Yang et al., 2009; Hong et al., 2010), a diurnal variation of the thermal roughness length observed on the Tibetan Plateau (Ma et al., 2002; Yang et al., 2003), and high bare soil evaporation in semiarid areas (e.g. Agam et al., 2004; Balsamo et al., 2011).
20
Especially theKobresiamats are characterised by changing fractions of vegetation cover and partly missing root mats, exposing almost bare soil with properties different
from the turf below the Kobresia. The models have therefore been adapted to these conditions and specific parameter sets have been elaborated from field measurements for Nam Co and Kema (Gerken et al., 2012; Biermann et al., 2014)
BGD
11, 8861–8923, 2014Pasture degradation modifies the water and carbon cycles of the Tibetan highlands
W. Babel et al.
Title Page
Abstract Introduction
Conclusions References
Tables Figures
◭ ◮
◭ ◮
Back Close
Full Screen / Esc
Printer-friendly Version
Interactive Discussion
Discussion
P
a
per
|
Discus
sion
P
a
per
|
Discussion
P
a
per
|
Discussion
P
a
per
|
2.5 Experimental and modelling concept
Experimental investigations on the Tibetan Plateau are not comparable with typical me-teorological and ecological experiments. Not only do the high altitude and the remote area impose limitations, but also unforeseeable administrative regulations challenge the organization of experiments with different groups and large equipment. It was
ini-5
tially planned to investigate small degraded plots with chambers and micro-lysimeters and to use a larger plot, in the size of the eddy-covariance footprint, as a reference area to investigate the daily fluctuations of the evaporation and carbon dioxide flux. Due to customs and permit problems, this was unfortunately only partly possible at Kema site in 2010, but not during the main chamber experiment in 2012. Therefore, 10
model-specific parameters were investigated in 2012 and the models were adapted to the specific Tibetan conditions with the chamber data. These model versions were then tested with the eddy-covariance data in 2010 at Kema site with nearly intactKobresia
cover. A summary of the experimental setup according to measurement technique is given in Table 3.
15
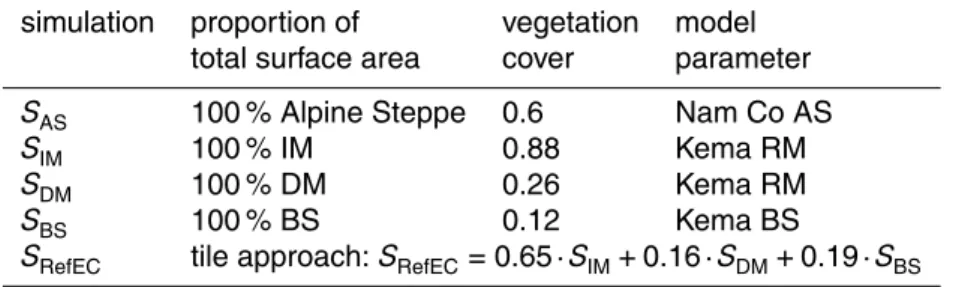
In accordance with this concept, we adapted both SEWAB and SVAT-CN to the Kema site using the vegetation and soil parameters elaborated in 2012, and chamber mea-surements from 2012 for calibration. Two parameter sets were established: one for sur-faces with root mat (Kema RM: IM and DM differ only in vegetation fraction), and one
for BS conditions (Kema BS). Simulations with in situ measured atmospheric forcing 20
data were performed specifically for each of the degradation classesSIM,SDMandSBS according to the definition in Table 2. These model runs serve to expand the chamber data beyond their measurement period, and we are now able to compare the class-specific fluxes over a 46 day period (12 July to 26 August 2012).
Furthermore, we compared the adapted model versions with eddy-covariance data 25
BGD
11, 8861–8923, 2014Pasture degradation modifies the water and carbon cycles of the Tibetan highlands
W. Babel et al.
Title Page
Abstract Introduction
Conclusions References
Tables Figures
◭ ◮
◭ ◮
Back Close
Full Screen / Esc
Printer-friendly Version
Interactive Discussion
Discussion
P
a
per
|
Discus
sion
P
a
per
|
Discussion
P
a
per
|
Discussion
P
a
per
|
2013), and therefore represent H2O and CO2fluxes from IM, DM and BS according to their proportion of total surface area in Table 2. In order to ensure comparability we re-produce this composition with the simulations as well using the tile approach (SRefEC). An overview of model scenarios conducted at Kema site is given in Table 4.
For the investigation of the atmospheric impact of surface degradation, it was de-5
cided to run a relatively simple numerical experiment prescribing a symmetric, two-dimensional Tibetan valley with 150 km width, and surrounded by Gaussian hills with 1000 m altitude. A sounding taken at Nam Co at 17 July 2012 was used as the initial profile. The setup is comparable to Gerken et al. (2013, 2014). A total of four cases were chosen for this preliminary analysis. A dry scenario with initial soil moisture of 10
0.5×field capacity and a wet scenario with soil moisture at field capacity, as might be the case during the monsoon season, were used. For both surface states, simulations were performed with a vegetation cover of 25 % and 75 % corresponding to a degraded and intact soil-mat scenario.
The study is limited by conceptual restrictions mainly due to the scale problem in 15
the different compartments (Foken et al., 2012b, see Appendix of this paper) and the
working conditions in remote and high altitudes. Only one more-or-less uniform type of degradation has been investigated within the footprint area of the eddy-covariance measurements (Göckede et al., 2006) up to 50–200 m extension, which is, in the case of this study, an almost non-degradedKobresiapasture. The other types could only be 20
found on much smaller plots, and had no significant influence on the whole footprint area, even when considering the non-linear influence of the different land-cover areas
on the fluxes of the larger area (Mölders, 2012). However, the investigation of degraded stages could only be done with small-scale measurements like chambers and micro-lysimeters.
BGD
11, 8861–8923, 2014Pasture degradation modifies the water and carbon cycles of the Tibetan highlands
W. Babel et al.
Title Page
Abstract Introduction
Conclusions References
Tables Figures
◭ ◮
◭ ◮
Back Close
Full Screen / Esc
Printer-friendly Version
Interactive Discussion
Discussion
P
a
per
|
Discus
sion
P
a
per
|
Discussion
P
a
per
|
Discussion
P
a
per
|
3 Results and discussion
3.1 Comparison of measured and modelled fluxes
In order to test the performance of evapotranspiration (ET) with SEWAB and net ecosystem exchange (NEE) with SVAT-CN, we compared the model results for Kema with the eddy-covariance measurements from 2010 (Sect. 2.5). The results show that 5
SEWAB simulations represent the half-hourly measured turbulent fluxes at Kema gen-erally well (y=1.03x−0.28 mm d−1, r2=0.72, n=577, Appendix D). Therefore, the
simulations are well suited to filling the gaps in the eddy-covariance measurements for comparison of evapotranspiration with micro-lysimeter measurements. Model per-formance at Nam Co for the measurements in 2009 was very similar, as well as the 10
magnitude of the fluxes (Biermann et al., 2014). Measured hourly medians of NEE at Kema ranged between−2.8 and 1.5 g C m−2d−1over the course of the day, whereas modelled medians reached a minimum −3.0 and a maximum of 1.7 g C m−2d−1. Al-though the model overestimated the CO2 uptake, especially in the midday hours, the correlation between hourly medians of model output and measured NEE was gener-15
ally realistic (y=0.99x−0.02 g C m−2d−1,r2=0.81,n=24). Compared to Kema data,
mean diurnal patterns of measured and modelled NEE showed smaller fluxes and less variation. Measured hourly medians of NEE ranged between−2.3 and 1.0 g C m−2d−1 over the course of the day, and modelled medians between−2.7 and 1.0 g C m−2d−1 (y=1.15x−0.15 g C m−2d−1,r2=0.9,n=24).
20
3.2 Evapotranspiration: EC – Micro-Lysimeter – SEWAB
Daily evapotranspiration (ET) of theKobresia pygmaeaecosystem was about 2 mm d−1
during dry periods and increased to 6 mm d−1after sufficient precipitation (not shown).
This was confirmed with three different approaches: small weighable micro-lysimeters
giving a direct measure of ET from small soil columns over several days, eddy-25
BGD
11, 8861–8923, 2014Pasture degradation modifies the water and carbon cycles of the Tibetan highlands
W. Babel et al.
Title Page
Abstract Introduction
Conclusions References
Tables Figures
◭ ◮
◭ ◮
Back Close
Full Screen / Esc
Printer-friendly Version
Interactive Discussion
Discussion
P
a
per
|
Discus
sion
P
a
per
|
Discussion
P
a
per
|
Discussion
P
a
per
|
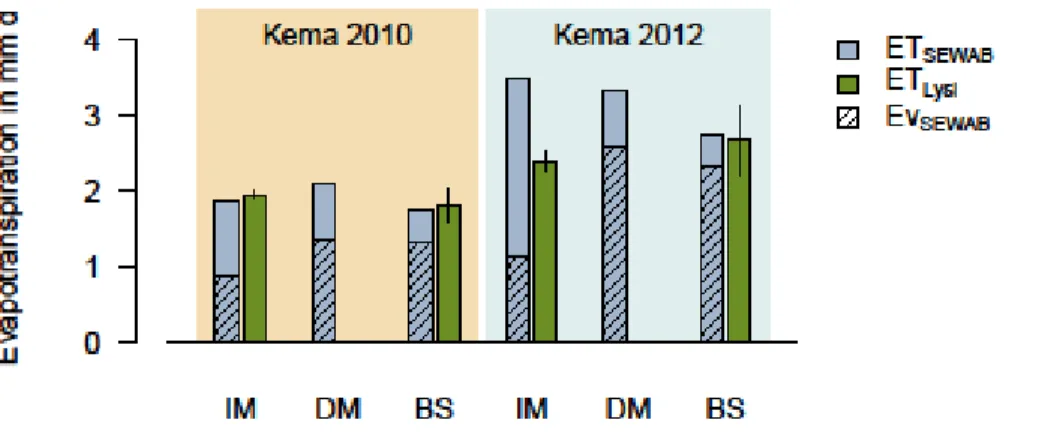
SEWAB simulations. For a 33 day period at Kema 2010, ET for both micro-lysimeter and simulations varied around 1.9 mm d−1, reflecting drier conditions, while in 2012 the micro-lysimeter showed a maximum ET of 2.7 mm d−1 at BS, and the simulations 3.5 mm d−1at IM (Fig. 3). In summary, all approaches showed no clear differences
be-tween ET from IM and BS spots. Even for dense vegetation cover (IM), a considerable 5
part of ET stems from evaporation. At DM and BS, transpiration of the small above-ground part ofKobresiais decreasing, but it is compensated by evaporation. Therefore, the water balance is mainly driven by physical factors, i.e. atmospheric evaporative de-mand and soil water content.
3.3 Carbon flux: chamber – SVAT-CN 10
During the Kema 2012 campaign the carbon fluxes for different degradation levels
were investigated with chamber-based gas exchange measurements. Parallel mea-surements could not be established due to instrumental limitations, therefore the SVAT-CN model is utilised to compare the degradation classes over the whole period. In order to adapt SVAT-CN to the chamber measurements, the parameters of leaf phys-15
iology and soil respiration have been set to values that accommodate the different
vegetation types and cover of the plots (Appendix C, Table C2).
Daily sums of ecosystem respiration (Reco) over IM were overestimated by the model during period 1, but underestimated during the second setup over IM (period 4); see Fig. 4. Overall, the model predicted a meanReco of 2.37 g C m−
2
d−1 for IM, whereas 20
the mean of the chamber data yield 2.31 g C m−2d−1. For the chamber setup over bare soil (BS, period 2),Reco were, on average, represented well by the model (on average 0.77 g C m−2s−1) as compared to the data average of 0.81 g C m−2d−1. Similarly, for DM (period 3) modelled (1.81 g C m−2d−1) and measured (1.69 g C m−2d−1) average
Recocompared well. Analogous patterns were found for daily sums of gross ecosystem 25
exchange (GEE=NEE−R
BGD
11, 8861–8923, 2014Pasture degradation modifies the water and carbon cycles of the Tibetan highlands
W. Babel et al.
Title Page
Abstract Introduction
Conclusions References
Tables Figures
◭ ◮
◭ ◮
Back Close
Full Screen / Esc
Printer-friendly Version
Interactive Discussion
Discussion
P
a
per
|
Discus
sion
P
a
per
|
Discussion
P
a
per
|
Discussion
P
a
per
|
analyzing period 1 and 4 together (modelled average GEE −5.39 g C m−2d−1, mea-sured average GEE−4.96 g C m−2s−1). Average modelled GEE over BS with−0.89 g C m−2
d−1
compared well to measured GEE for period 2 (−0.69 g C m−2d−1). Over DM, the average modelled GEE was −1.64 g C m−2d−1, and measured GEE showed an average of−1.94 g C m−2d−1.
5
The mean carbon fluxes derived from SVAT-CN simulations for the different
degrada-tion classes over the vegetadegrada-tion period are shown in Fig. 5. A noticeable carbon uptake of−2.89 g C m−2d−1for IM reduces to−0.09 for BS and even shifts to a weak release of 0.2 at DM. This is mainly related to a drop in GEE by 83 % for BS and 64 % for DM, compared to IM (100 %). While Reco for BS is reduced by 66 %, it only reduces by 10
12 % for DM, leading to the small net release already mentioned.
Cumulative NEE was calculated applying the four different model setups previously
described: IM, DM and BS stages ofKobresia pastures at Kema, and Alpine Steppe (AS) ecosystem at Nam Co (Fig. 6). The simulation period ranged from period 12 July to 26 August 2012. For this period, only the IM stage showed significant carbon 15
uptake of −133 g C m−2. DM and BS ecosystems were more-or-less carbon neutral (−4 g C m−2uptake at BS, and 9 g C m−2release at DM). The model for AS resulted in a carbon loss of 24 g C m−2for the investigated period.
3.4 Distribution of the assimilated carbon inKobresiapastures and the soil
The results from two13CO2pulse labelling experiments at Xinghai 2009 (Hafner et al., 20
2012) and Kema 2010 (Ingrisch et al., 2014) show the distribution of assimilated carbon (C) in a montane and alpineKobresiapasture (Fig. 7). The study in Xinghai showed that C translocation was different on plots where vegetation had changed from Cyperaceae
to Poaceae dominance, induced by grazing cessation. Less assimilated C was stored in belowground pools. The study in Kema showed that roots within the turf layer act 25
BGD
11, 8861–8923, 2014Pasture degradation modifies the water and carbon cycles of the Tibetan highlands
W. Babel et al.
Title Page
Abstract Introduction
Conclusions References
Tables Figures
◭ ◮
◭ ◮
Back Close
Full Screen / Esc
Printer-friendly Version
Interactive Discussion
Discussion
P
a
per
|
Discus
sion
P
a
per
|
Discussion
P
a
per
|
Discussion
P
a
per
|
experiments on the two sites as in the case of the alpine pasture (Kema) more C was allocated belowground than in montane pasture. However, as the experiments were conducted under different conditions and in consecutive years, a comparison of
absolute values is not possible as the determined C fraction varies also throughout the growing season (Swinnen et al., 1994; Kuzyakov and Domanski, 2000).
5
At Kema, the13CO2 labelling was furthermore coupled with eddy-covariance mea-surements to determine absolute values of the carbon distribution in the plants, roots and the soil following a method developed by Riederer (2014). In addition, the continu-ous observation of the exchange regime with the EC confirms that the pulse labelling was conducted under atmospheric conditions similar to the ones of the whole alloca-10
tion period. This leads to more representativeness of the result of the13CO2labelling experiment, which could not be repeated due to the remote and restricted access on the Plateau.
3.5 Influence of plant cover on convection and precipitation
For investigating the influence of degradation on the development of convection and 15
precipitation, the ATHAM model was applied for 25 % (V25) and 75 % (V75) plant cover at the Nam Co basin, with each of these in a dry and a wet scenario. From Fig. 8 it becomes immediately apparent that wet surface conditions are associated with higher deposited precipitation. At the same time, near-surface relative humidities are higher (not shown). For both the dry and wet cases an earlier cloud and convection devel-20
opment is observed for the less vegetated surface: simulations produce higher cloud cover and more convection from 10:00 local solar time (LST) onward. At Nam Co we observed the frequent development of locally generated convective systems at similar hours in the field. Thus clouds block more incoming solar radiation between 10:00 and 14:00 LST, the time with the potentially highest shortwave radiation forcing, for the less 25
BGD
11, 8861–8923, 2014Pasture degradation modifies the water and carbon cycles of the Tibetan highlands
W. Babel et al.
Title Page
Abstract Introduction
Conclusions References
Tables Figures
◭ ◮
◭ ◮
Back Close
Full Screen / Esc
Printer-friendly Version
Interactive Discussion
Discussion
P
a
per
|
Discus
sion
P
a
per
|
Discussion
P
a
per
|
Discussion
P
a
per
|
albedo effect can be excluded since the observed albedo of the vegetated surface is
similar to that of the bare surface and surface temperatures remain virtually identical until convection develops.
The mechanism for this process is presumably that the vegetation cover reduces bare soil evaporation. At the same time, higher surface temperatures due to higher 5
radiation input result in both larger sensible and latent heat fluxes in the afternoon hours, while the plant cover is able to access water that is not available for surface evaporation.
This hypothesis obviously needs to be investigated more thoroughly with field ob-servations and simulations, but the findings indicate that changes in surface condi-10
tions can affect convective dynamics and local weather. This preliminary investigation
of vegetation–atmosphere feedbacks did not take into account any spatial patterns in surface degradation that may result in larger patches with different surface conditions
that may then affect circulation. However, such circulation effects are typically found
in modelling studies using patch sizes with length scales that are several times the 15
boundary-layer height.
3.6 Simulation of different degradation states
The results for the different degradation states allow the simulation of the NEE and
evapotranspiration for a gradual change from IM to BS using a tile approach of the fluxes (Avissar and Pielke, 1989). Such a tile approach is exemplarily shown for diff
er-20
ent percentages of the ecosystem types IM and BS for a 46 days period in July and Au-gust 2012 at Kema site, with simulated NEE (Fig. 9a) and evapotranspiration (Fig. 9b). As expected from the cumulative carbon gains forSIM and SBS shown in Fig. 5, SIM developed the largest carbon sink over the investigated summer period, whereasSBS is nearly carbon neutral in summer and a source for longer periods. The intermediate 25
BGD
11, 8861–8923, 2014Pasture degradation modifies the water and carbon cycles of the Tibetan highlands
W. Babel et al.
Title Page
Abstract Introduction
Conclusions References
Tables Figures
◭ ◮
◭ ◮
Back Close
Full Screen / Esc
Printer-friendly Version
Interactive Discussion
Discussion
P
a
per
|
Discus
sion
P
a
per
|
Discussion
P
a
per
|
Discussion
P
a
per
|
as indicated by the interquartile ranges in the box plot. The related mean diurnal cycles are given in Appendix B, Fig. B1.
Evapotranspiration decreases fromSIM toSBSin this model degradation experiment, while the day-to-day variability increases (Fig. 9b). This is connected to a larger vari-ability of simulated soil moisture in the uppermost layer, as the turf layer retains more 5
water due to its higher field capacity and lower soil hydraulic conductivity, and the roots can extract water for transpiration from lower soil layers as well.
4 Conclusions
The approach to the investigation of the three prevailing degradation stages, Intact root Mat (IM), Degraded root Mat (DM) and Bare Soil (BS), opened new insights and 10
perspectives, using and integrating chamber measurements, micro-lysimeter, eddy-covariance measurements, and model studies.
Increasing degradation of the Kobresia pygmaea turf significantly reduces the car-bon uptake and the function ofKobresiapastures as a carbon sink, while the influence on the evapotranspiration is less dominant. However, the shift from transpiration to 15
evaporation was found to have a significant influence on the starting time of convection and cloud and precipitation generation: convection starts above a degraded surface around noon instead of later in the afternoon. Due to the dominant direct solar ra-diation on the Tibetan Plateau, the early-generated cloud cover reduces the energy input and therefore the surface temperatures. Therefore the degradation state of the 20
Kobresia pastures has a significant influence on the water and carbon cycle and, in consequence, on the climate system. Due to the relevance of the Tibetan Plateau on the global circulation changes, the surface properties on the highland have influences on larger scales. These changes in the water and carbon cycle are furthermore influ-enced by global warming and an extended growing season (Che et al., 2014; Shen 25
BGD
11, 8861–8923, 2014Pasture degradation modifies the water and carbon cycles of the Tibetan highlands
W. Babel et al.
Title Page
Abstract Introduction
Conclusions References
Tables Figures
◭ ◮
◭ ◮
Back Close
Full Screen / Esc
Printer-friendly Version
Interactive Discussion
Discussion
P
a
per
|
Discus
sion
P
a
per
|
Discussion
P
a
per
|
Discussion
P
a
per
|
Plot size experiments are a promising mechanistic tool for investigating processes that are relevant for larger scales. Since all results showed a high correlation between modelled and experimental data, a combination is possible with a tile approach with flux averaging to realize model studies that consider gradual degradation schemata. The consequent combination of plot scale, ecosystem scale and landscape scale shows 5
the importance of the integration of experimental and modelling approaches.
The palaeo-environmental reconstruction (Miehe et al., 2014) as well as the simula-tions of the present study suggest that the present grazing lawns ofKobresia pygmaea
are a synanthropic ecosystem that developed through long-lasting selective free-range grazing of livestock. This traditional and obviously sustainable rangeland management 10
would be the best way to conserve and possibly increase the carbon stocks in the turf and its functions. Otherwise, an overgrazing connected with erosion would destroy the carbon sink. Considering the large area, even the loss of this small sink would have an influence on the climate relevant carbon balance of China.
From our investigation we propose the need for the following additional research. 15
– Extension of this integrated experimental-modelling research scheme to the full annual cycle.
– The results obtained so far on just these three sites should be extended to an increased number of experimental sites, supported by appropriate remote sensing tools, in order to regionalize degradation patterns and related processes.
20
– Investigation of the processes along elevation gradients, with special reference to functional dependences.
BGD
11, 8861–8923, 2014Pasture degradation modifies the water and carbon cycles of the Tibetan highlands
W. Babel et al.
Title Page
Abstract Introduction
Conclusions References
Tables Figures
◭ ◮
◭ ◮
Back Close
Full Screen / Esc
Printer-friendly Version
Interactive Discussion
Discussion
P
a
per
|
Discus
sion
P
a
per
|
Discussion
P
a
per
|
Discussion
P
a
per
|
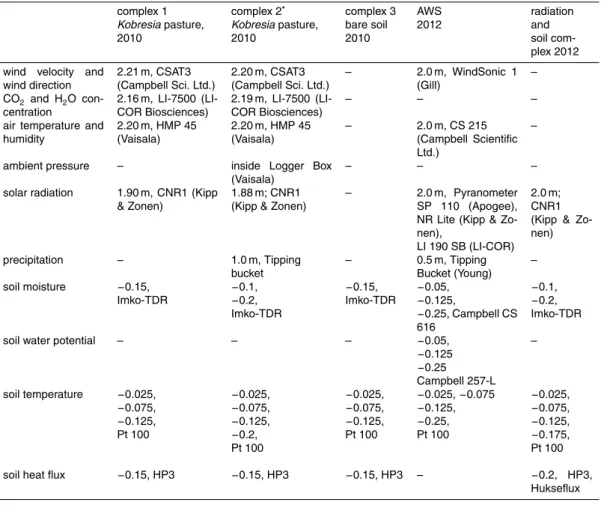
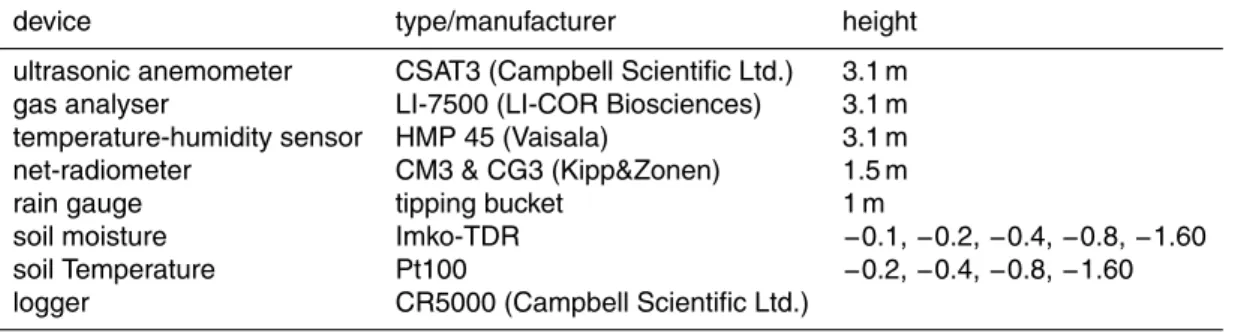
Appendix A: Instrumentation of the measurement sites
The instrumentation of the measurement sites is given for Kema in Table A1 and for Nam Co in Table A2.
Appendix B: Soil–vegetation–atmosphere transfer models
Land surface modelling of energy and carbon dioxide exchange faces specific prob-5
lems on the Tibetan Plateau. Most influential is the strong diurnal cycle of the surface temperature, observed in dry conditions over bare soil or very low vegetation, leading to overestimation of surface sensible heat flux (Yang et al., 2009; Hong et al., 2010) caused by too high turbulent diffusion coefficients. Land surface models usually
pa-rameterize these coefficients by a fixed fraction between the roughness length of
mo-10
mentum and heat, however, Yang et al. (2003) and Ma et al. (2002) observed a diurnal variation of the thermal roughness length on the Tibetan Plateau. As another special feature, land surface models tend to underestimate bare soil evaporation in semiarid areas (e.g. Agam et al., 2004; Balsamo et al., 2011); even for soil moisture below wilting point some evaporation could be observed.
15
Especially the Kobresia pygmaea mats are characterised by changing fractions of vegetation cover and partly missing root mats, exposing almost bare soil with prop-erties different from the turf below the Kobresia pygmaea. From investigations of soil
vertical heterogeneity by Yang et al. (2005) it can be concluded that such variations will significantly influence the exchange processes, posing a challenge for land surface 20
modelling.
B1 Evapotranspiration – the SEWAB model
BGD
11, 8861–8923, 2014Pasture degradation modifies the water and carbon cycles of the Tibetan highlands
W. Babel et al.
Title Page
Abstract Introduction
Conclusions References
Tables Figures
◭ ◮
◭ ◮
Back Close
Full Screen / Esc
Printer-friendly Version
Interactive Discussion
Discussion
P
a
per
|
Discus
sion
P
a
per
|
Discussion
P
a
per
|
Discussion
P
a
per
|
by the diffusion equation and vertical movement of soil water is described by the
Richards equation (Richards, 1931). Relationships between soil moisture character-istics are given by Clapp and Hornberger (1978). Atmospheric exchange is given by bulk approaches, taking into account aerodynamic and thermal roughness lengths with respect to atmospheric stability (Louis, 1979). The latent heat flux is split up into veg-5
etated surface flux and bare soil evaporation. The flux from vegetation is composed of wet foliage evaporation and transpiration of dry leaves. For the latter, the stomata resis-tance is constrained by minimum resisresis-tance and stress factors in a Jarvis-type scheme (Noilhan and Planton, 1989). In contrast to many other SVAT models, SEWAB param-eterizes all energy balance components separately and closes the energy balance by 10
an iteration for the surface temperature using Brent’s method.
B2 Carbon dioxide exchange – the SVAT-CN
The model SVAT-CN (Reichstein, 2001; Falge et al., 2005) simulates CO2 and H2O gas exchange of vegetation and soil. It consists of a 1-D canopy model (Caldwell et al., 1986; Tenhunen et al., 1995), a 1-D soil physical model of water and heat fluxes (Mol-15
drup et al., 1989, 1991), and a model of root water uptake (Reichstein, 2001). The model has been further developed with respect to soil gas emissions of CO2and N2O from forest, grassland, and fallow (Reth et al., 2005a, b, c). In combination with a 3-D model it has been used to simulate vertical profiles of latent heat exchange and suc-cessfully compared to vertical profiles of latent heat exchange in a spruce forest canopy 20
(Staudt et al., 2011; Foken et al., 2012b). Plant canopy and soil are represented by several horizontally homogeneous layers, for which microclimate and gas exchange is computed. The soil module simulates unsaturated water flow according to Richards equation (Richards, 1931) parameterized with van Genuchten (1980) soil hydraulic parameters. C3 photosynthesis is modelled using the basic formulation described by 25
BGD
11, 8861–8923, 2014Pasture degradation modifies the water and carbon cycles of the Tibetan highlands
W. Babel et al.
Title Page
Abstract Introduction
Conclusions References
Tables Figures
◭ ◮
◭ ◮
Back Close
Full Screen / Esc
Printer-friendly Version
Interactive Discussion
Discussion
P
a
per
|
Discus
sion
P
a
per
|
Discussion
P
a
per
|
Discussion
P
a
per
|
equation (gfac) is modelled depending on soil matrix potential (Ψ) in the main root
layer.
B3 2-D atmospheric model – ATHAM
In a separate work (Gerken et al., 2012), the SEWAB model compared well with the Hy-brid vegetation dynamics and biosphere model (Friend et al., 1997; Friend and Kiang, 5
2005)), which is coupled to the cloud-resolving Active Tracer High-resolution Atmo-spheric Model (ATHAM, Oberhuber et al., 1998; Herzog et al., 2003). The fully coupled system was successful in simulating surface–atmosphere interactions, mesoscale cir-culations and convective evolution in the Nam Co basin (Gerken et al., 2013, 2014). In a coupled simulation, surface fluxes of energy and moisture interact with the flow field. 10
At the same time, wind speed as well as clouds, which modify the surface radiation-balance, provide a feedback to the surface and modify turbulent fluxes. Such simula-tions can produce a complex system of interacsimula-tions.
Appendix C: Model adaption to the Tibetan Plateau
C1 Adaption of SEWAB 15
Considering the specific problems on the Tibetan Plateau, three changes have been implemented in SEWAB. Those are a variable thermal roughness length (Yang et al., 2008), soil thermal conductivity calculation (Yang et al., 2005) and the parameterization of bare soil evaporation (Mihailovic et al., 1993). These changes have been already ap-plied and evaluated at the alpine steppe site Nam Co using the same data set (Gerken 20
et al., 2012; Biermann et al., 2014)
BGD
11, 8861–8923, 2014Pasture degradation modifies the water and carbon cycles of the Tibetan highlands
W. Babel et al.
Title Page
Abstract Introduction
Conclusions References
Tables Figures
◭ ◮
◭ ◮
Back Close
Full Screen / Esc
Printer-friendly Version
Interactive Discussion
Discussion
P
a
per
|
Discus
sion
P
a
per
|
Discussion
P
a
per
|
Discussion
P
a
per
|
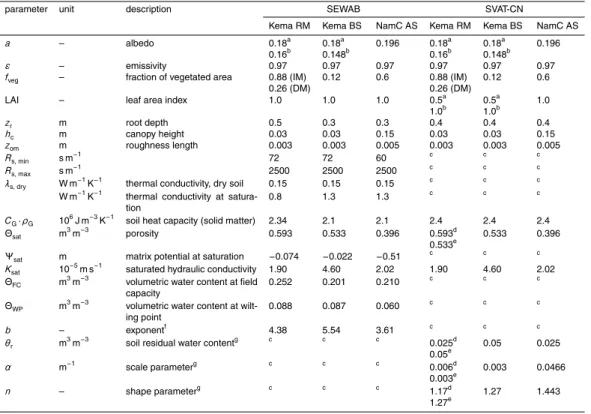
laboratory measurements. Specific parameters for the Kema site have been elabo-rated as follows: albedo has been estimated from radiation measurements individually for the 2010 and 2012 data set. The fraction of vegetated area has been surveyed (Sect. 2.2), root depth is assessed from soil profiles (Biermann et al., 2011, 2013) and the roughness length for momentum is estimated from eddy-covariance friction 5
velocity under neutral conditions. The LAI for the vegetated area has been calculated from a biomass survey (September 2012,n=5) and subsequent scans of leaf surface
using WinSeedle. Maximum stomatal conductance has been elaborated by gas ex-change measurements withKobresia pygmaeain Göttingen (see Appendix C2), which has been translated to minimum stomatal resistance.
10
Soil properties have been estimated from measurements separately for conditions with root mat (RM: IM and DM) and without root mat (BS). As SEWAB accepts only one soil parameter set for the whole soil column, the properties of the uppermost 5 cm have been used. The bulk density has been surveyed in 2012 for soil layers of 5 cm thickness, down to 30 cm for RM and 14 cm for BS (n=4 plots×4 replicates=16 for
15
each layer). Average soil organic carbon content of the turf layer was 9 %, measured by dry combustion (Vario EL, Elementar, Hanau), corresponding to approximately 18 % or-ganic matter, which is in agreement with previous analyses by Kaiser et al. (2008). This amount has been distributed to three layers of 5 cm according to the relative content of root mass in each layer, sampled in 2010 (n=4 plots×3 replicates=12 for each
20
layer). From bulk density and mass fraction of organic matter the porosity in 0–5 cm depth is estimated with 0.593 m3m−3, assuming densities of 2.65 g m−3 for mineral content and 1.2 g m−3for organic content. The soil heat capacity of solid matter is
com-bined from 2.1×10⁶J m−3K−1 for mineral content and 2.5×10⁶J m−3K−1 for organic matter according to Hillel (1980). Thermal conductivities for dry soil and at saturation, 25
BGD
11, 8861–8923, 2014Pasture degradation modifies the water and carbon cycles of the Tibetan highlands
W. Babel et al.
Title Page
Abstract Introduction
Conclusions References
Tables Figures
◭ ◮
◭ ◮
Back Close
Full Screen / Esc
Printer-friendly Version
Interactive Discussion
Discussion
P
a
per
|
Discus
sion
P
a
per
|
Discussion
P
a
per
|
Discussion
P
a
per
|
2010 (Biermann et al., 2011, 2013). An in-situ soil water retention curve was estab-lished from tensiometer and TDR profile measurements in 2012, reflecting the prop-erties of RM in the first 15 cm and the propprop-erties of BS in 25 cm depth. From this data the matrix potential at saturationΨ
sat and the exponentb for the relationship by Clapp and Hornberger (1978) is estimated via linear regression of the logarithmic form: 5
log(ΨΘ)=log(Ψsat)+b·log(Θsat
Θ ). Further, the soil water content at field capacity and wilting point has been derived from this relationship assuming pF values (=log(ΨΘ))
of 2.5 log(hPa) and 4.5 log(hPa) forΘ
FCandΘWP, respectively.
C2 Adaption of SVAT-CN
Species parameterization of the leaf model forKobresia pygmaea: 10
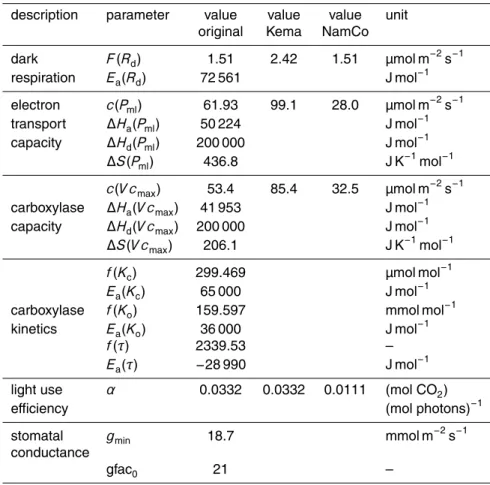
Measurements of in situ CO2and H2O leaf gas exchange in response to temperature, radiation, CO2 mixing ratio, and relative humidity were made using a portable gas ex-change system (WALZ GFS3000, Walz, Effeltrich/Germany). Single factor
dependen-cies of leaf gas exchange to light, temperature, CO2mixing ratio, and relative humid-ity, were performed for copiously wateredKobresia pygmaea plants from greenhouse 15
experiments at the University of Göttingen. The measurement setup was situated in a greenhouse chamber regulated to 15◦C. GFS3000 gas exchange measurements were performed at six different temperatures (7.5, 10, 15, 20, 25, and 30◦C) inside the
cuvette and a series of different relative humidities of the inlet air, ranging between 20
and 65 %, matching meteorological conditions found at the field site during the inten-20
sive campaign in 2010. As high humidity inside the chamber system leads to problems with water condensation in the tubes, the conditions were restricted to relative humidity up to 65 %. Data have been analyzed using with the physiologically based leaf gas exchange model (Farquhar et al., 1980; Ball et al., 1987) to derive estimates for those parameters that describe the carboxylase kinetics, electron transport, respiration and 25
BGD
11, 8861–8923, 2014Pasture degradation modifies the water and carbon cycles of the Tibetan highlands
W. Babel et al.
Title Page
Abstract Introduction
Conclusions References
Tables Figures
◭ ◮
◭ ◮
Back Close
Full Screen / Esc
Printer-friendly Version
Interactive Discussion
Discussion
P
a
per
|
Discus
sion
P
a
per
|
Discussion
P
a
per
|
Discussion
P
a
per
|
residuals, assumed to indicate data contamination or data-model inconsistencies. Sets of parameter values forKobresia pygmaea(Appendix, Table C2) were obtained as the basis for calculating canopy flux rates at the different field sites.
Parameterization of soil retention curve:
In SVAT-CN the relationship between soil matrix potentialΨ (or better water suction,
5
in units of m) and soil water contentθ(m3m−3) is described by a retention curve after van Genuchten (1980)
Ψ(θ)= 1 α ·
"
θ
−θr
θs−θr −m1
−1 #1n
, (C1)
whereθis soil water content (m3m−3),θrsoil residual water content (m 3
m−3),θs soil saturated water content (m3m−3),αa scale parameter (m−1), andnandmshape pa-10
rameters, withm=1–1/n. Site-specific data of measured retention curves (soil
mois-ture and soil water potential from AWS, Table A1) have been used to parameterizeθr,
α, andn(Appendix, Table C1) by non-linear least square regression.
Parameterization of soil respiration:
Soil respiration (Rs, µmol m− 2
s−1
) is modelled as a function of modelled soil tempera-15
tureTs(K) and soil water contentθ(m 3
m−3) in 10 cm depth as follows:
Rs=Rnorm·e
E0·Tref1−T0·Ts1−T0
·max
0.01, θ−θ0
(θhalf−θ0)+(θ−θ0)
(C2)