www.atmos-meas-tech.net/6/2007/2013/ doi:10.5194/amt-6-2007-2013
© Author(s) 2013. CC Attribution 3.0 License.
Atmospheric
Measurement
Techniques
Geoscientiic
Geoscientiic
Geoscientiic
Geoscientiic
The Airborne Multiangle SpectroPolarimetric Imager (AirMSPI):
a new tool for aerosol and cloud remote sensing
D. J. Diner1, F. Xu1,2, M. J. Garay1, J. V. Martonchik1, B. E. Rheingans1, S. Geier1, A. Davis3, B. R. Hancock1, V. M. Jovanovic1, M. A. Bull1, K. Capraro1, R. A. Chipman4, and S. C. McClain4
1Jet Propulsion Laboratory, California Institute of Technology, Pasadena, CA 91109, USA 2University of California, Los Angeles, CA 90095, USA
3University of Texas, Center for Space Research, Austin, TX 78759, USA 4University of Arizona, College of Optical Sciences, Tucson, AZ 85721, USA
Correspondence to:D. J. Diner (david.j.diner@jpl.nasa.gov)
Received: 9 January 2013 – Published in Atmos. Meas. Tech. Discuss.: 14 February 2013 Revised: 3 July 2013 – Accepted: 4 July 2013 – Published: 13 August 2013
Abstract.The Airborne Multiangle SpectroPolarimetric Im-ager (AirMSPI) is an eight-band (355, 380, 445, 470, 555, 660, 865, 935 nm) pushbroom camera, measuring polariza-tion in the 470, 660, and 865 nm bands, mounted on a gimbal to acquire multiangular observations over a±67◦along-track range. The instrument has been flying aboard the NASA ER-2 high altitude aircraft since October ER-2010. AirMSPI em-ploys a photoelastic modulator-based polarimetric imaging technique to enable accurate measurements of the degree and angle of linear polarization in addition to spectral intensity. A description of the AirMSPI instrument and ground data processing approach is presented. Example images of clear, hazy, and cloudy scenes over the Pacific Ocean and Cali-fornia land targets obtained during flights between 2010 and 2012 are shown, and quantitative interpretations of the data using vector radiative transfer theory and scene models are provided to highlight the instrument’s capabilities for deter-mining aerosol and cloud microphysical properties and cloud 3-D spatial distributions. Sensitivity to parameters such as aerosol particle size distribution, ocean surface wind speed and direction, cloud-top and cloud-base height, and cloud droplet size is discussed. AirMSPI represents a major step toward realization of the type of imaging polarimeter envi-sioned to fly on NASA’s Aerosol-Cloud-Ecosystem (ACE) mission in the next decade.
1 Introduction
Terra spacecraft (Diner et al., 1998a), MSPI is envisioned to observe Earth at multiple view angles using a set of multi-spectral pushbroom cameras. Relative to MISR, new capabil-ities in MSPI will include ultraviolet and shortwave infrared bands in addition to those in the visible and near-infrared, a wider field of view (hence more frequent global coverage), and polarimetric imaging in selected spectral bands (MISR, by design, is polarization insensitive).
Development of the MSPI instrument has proceeded via construction of a series of prototype cameras with progres-sively increasing spectral capability. The initial prototype, designated LabMSPI, was a single wavelength (660 nm) camera designed to demonstrate our dual photoelastic mod-ulator (PEM)-based polarimetric imaging approach. Exam-ple images and calibration results are presented in Diner et al. (2010). LabMSPI has since been upgraded to ultra-violet (UV)/visible/near-infrared (VNIR) operation and re-named GroundMSPI to distinguish it from its predecessor (Diner et al., 2012). A second, airborne version of the camera – AirMSPI, also operating in the UV/VNIR – has been flying on NASA’s ER-2 high-altitude aircraft since 2010. Section 2 of this paper describes the AirMSPI instrument. Section 3 presents examples of intensity and polarization images, along with model results aimed at interpreting the observations. Concluding remarks are provided in Sect. 4.
2 AirMSPI instrument description
2.1 Optics
AirMSPI is an eight-band pushbroom camera, mounted on a gimbal to acquire multiangular observations over a±67◦
along-track range. As in GroundMSPI, the AirMSPI spec-tral bands are centered near 355, 380, 445, 470P, 555, 660P, 865P, and 935 nm. Those bands marked with the letter “P” provide polarimetric information. The 935 nm channel is an experimental band included to explore the possibility of re-trieving column water vapor abundance using multiangle ob-servations. AirMSPI’s telescope has an effective focal length of 29 mm and cross-track field of view of±15◦. Incoming light is brought to a focus using a three-mirror f/5.6 anas-tigmatic, telecentric system of the same design as used in LabMSPI/GroundMSPI (Diner et al., 2010). To increase op-tical throughput, particularly in the UV, AirMSPI employs redesigned mirror coatings. In addition to high reflectance, design goals for the coatings included low diattenuation and low retardance (relative difference in reflectance and phase, respectively, for light polarized in perpendicular planes). Pre-cision Asphere, Inc. fabricated the mirrors and Surface Op-tics Corporation applied the optical coatings. Over the entire UV-shortwave infrared (SWIR) spectral range, the measured diattenuation is <0.5 %, reflectance is >85 %, and retar-dance is<10◦. Because diattenuation is intrinsically low for the new coating design, the diattenuation balancing approach
used in GroundMSPI (Mahler et al., 2008) was not required and each mirror was identically coated.
2.2 Retardance modulator
AirMSPI uses a time-varying retardance in the optical path to modulate the orientation of the linearly polarized ponent of the incoming light, described by the Stokes com-ponents Q(excess of horizontally over vertically polarized light) andU(excess of 45◦over 135◦polarized light) (Diner et al., 2007, 2010; Mahler et al., 2011a). This oscillating re-tardance is achieved by placing a pair of Hinds Instruments Series II/FS42 PEMs in the optical train. PEMs are fused silica plates coupled to quartz piezoelectric transducers that induce a rapidly oscillating retardance via the photoelastic effect. The fast axes of the two PEMs are aligned and nomi-nally parallel to the long dimension of the focal plane line arrays. The AirMSPI PEMs have resonant frequencies of
f1= 42 060 andf2= 42 037 Hz at 18◦C. These frequencies shift by about 2.6 Hz per 1◦C change in temperature, but the difference frequencyδf =f1−f2(23 Hz) is much less temperature sensitive, changing by only 15 mHz◦C−1. The
difference in resonant frequency of the two PEMs generates a beat signal whose period defines the duration of an image frame (tframe= 1/δf= 43.5 ms). This beat modulation is
typ-ically sampled 23 times per frame, and the time-varying sig-nal is processed using the algorithm described in Diner et al. (2010) to retrieveIandQsimultaneously from those pix-els overlain by an analyzer that transmits light polarized in an orientation parallel to the line arrays, andIandUfrom those pixels overlain by a polarization analyzer oriented at 45◦to this direction.I is the first Stokes component (intensity). By virtue of this approach, the ratiosq=Q/I andu=U/I are, to first order, insensitive to the absolute radiometric calibra-tion of a given pixel because both the numerator and de-nominator are determined from signals acquired by the same detector element. The degree of linear polarization (DOLP) and angle of linear polarization (AOLP) derived from these ratios, equal topq2+u2and 0.5 tan−1(u/q), respectively,
are similarly insensitive to absolute calibration. To compen-sate for instrumental polarization aberrations (e.g., mirror di-attenuation, imperfect retardance), a set of 10 polarimetric calibration coefficients is established for every pixel (Diner et al., 2010). These features enable the MSPI class of in-struments to meet the ACE DOLP uncertainty requirement of ±0.005 (ACE Science Working Group, 2010). Results from LabMSPI (Diner et al., 2010) and GroundMSPI (Diner et al., 2012) show DOLP uncertainties, determined as the root-mean-square (RMS) residual in DOLP as a polarizer is rotated in stepwise fashion in front of the camera (see Diner et al., 2010, for a description of the methodology), of ±0.003 or better. Preliminary results for AirMSPI show sim-ilar residuals.
desired linear Stokes vector components, Q andU. With-out the QWPs, the camera would be sensitive toU andV, the latter being the excess of right-handed over left-handed circular polarization. SinceV is typically small for natural scenes (Plass et al., 1976; Kawata, 1978), measurement of this Stokes component is sacrificed in order to obtain sensi-tivity to bothQandU. In the single-band LabMSPI cam-era, zero-order quartz QWPs were used. For GroundMSPI, these were replaced with commercial QWPs constructed from quartz and magnesium fluoride (MgF2). Custom QWPs
were designed and fabricated to meet the more stringent AirMSPI performance requirements (Mahler et al., 2011b). The design goal was to achieve retardance within±10◦ of 90◦(one quarter wave) in the polarimetric bands and<0.1◦ retardance change with 1◦C change in temperature. The use
of a composite, three-element retarder provides three degrees of freedom, two of which were designated for the shape of the retardance curve and the third for athermalization. The three materials employed are quartz, MgF2, and sapphire.
Karl Lambrecht Corporation assembled the AirMSPI com-pound retarders. Nominal retardance is 90, 92, and 86◦, re-spectively, at 470, 660, and 865 nm. Deviations of QWP per-formance from exact quarter-wave and the effect of finite spectral bandwidth are accounted for in the coefficients de-rived as part of the polarimetric calibration process (Diner et al., 2010).
2.3 Focal plane spectropolarimetric filters
A miniaturized focal-plane assembly consisting of spectral filters and wire-grid polarizers (WGPs) provides wavelength and polarimetric discrimination. Intensity measurements in the near-UV are beneficial because most surfaces are dark at these wavelengths, and the interaction between aerosols and enhanced Rayleigh scattering provides sensitivity to aerosol height (e.g., Torres et al., 2002). Visible and near-infrared intensity and polarization measurements provide sensitivity to particle size and complex refractive index. The longest-wavelength channel of AirMSPI is located in a water va-por absorption band. The nominal band center wavelengths and bandpass specifications (shown in parentheses) provided to the filter manufacturer were 355(30), 380(32), 445(36), 470(37), 555(31), 660(42), 865(39), and 935(48) nm. To en-able spectral and polarimetric selection for different rows of the photodetector line arrays, the manufactured spectral fil-ters were sliced into thin strips (80 µm wide by 17 mm long), bonded together, and polished. Materion Barr Precision Op-tics designed and fabricated this “butcher block” assembly. Design and manufacture of the filters, slicing and bonding to a substrate, incorporation of WGPs into the polarimet-ric channels, and integration of the resulting filter assembly with the camera optics and detectors can cause the system-level spectral characteristics of the AirMSPI channels to differ slightly from the specified values. This paper refer-ences and analyzes data from each channel using the nominal
(i.e., specified) band-center wavelengths. System-level spec-tral characterization is underway, and details will be sum-marized in a separate publication. Preliminary analyses of monochromator measurements of the as-built system indi-cate that the above specifications are met within a few nm.
The butcher-block filter assembly makes use of high opti-cal density black epoxy between the spectral filters for stray light reduction. This assembly was bonded to a fused sil-ica substrate containing patterned WGPs in the polarization channels. Moxtek, Inc. supplied the WGPs. Application of a cement bond to the WGPs results in reduced transmittanceT
and polarization extinction ratioε(ratio of transmittance of the polarization state aligned with polarizer to the transmit-tance for the orthogonal state) relative to their pre-bond val-ues. The use of high-contrast WGP stock results in post-bond
T exceeding 75 % andεvalues between 40 and 100, depend-ing on channel. These parameters affect the magnitude of the modulation pattern from the PEMs. As discussed in Diner et al. (2010), the systematic reduction in magnitude of the mod-ulation pattern due to imperfectT andεis corrected by in-strument polarimetric calibration, though with increased sen-sitivity to random noise. For the worst-case values ofT andε
relevant to AirMSPI, the corresponding reduction in signal-to-noise ratio (SNR) introduces a random error in DOLP of less than±0.0009. A Mueller Matrix Imaging Polarimeter (MMIP) at the University of Arizona was used for inspection and characterization of the spectropolarimetric filter compo-nents. Alignment and bonding of the filter to the silicon com-plementary metal oxide semiconductor (Si-CMOS) imager was done at the Jet Propulsion Laboratory (JPL). The com-posite filter assembly is situated above the detector array in the camera focal plane. The precision positioning equipment used to accomplish this step is able to ensure alignment to within±2 µm over the 17 mm length of the filter.
2.4 Focal plane detectors
33
Fig. 1.Left panel: pressure vessel and cylindrical drum housing the AirMSPI camera. Right panel: AirMSPI installed in the nose of the ER-2. The instrument is visible protruding below the fuselage.
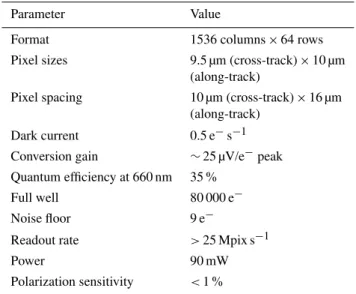
Table 1. Top-level characteristics of the AirMSPI focal plane detector.
Parameter Value
Format 1536 columns×64 rows
Pixel sizes 9.5 µm (cross-track)×10 µm (along-track)
Pixel spacing 10 µm (cross-track)×16 µm (along-track)
Dark current 0.5 e−s−1 Conversion gain ∼25 µV/e−peak Quantum efficiency at 660 nm 35 %
Full well 80 000 e−
Noise floor 9 e−
Readout rate >25 Mpix s−1
Power 90 mW
Polarization sensitivity <1 %
2.5 Electronics
AirMSPI electronic circuits were designed and built to meet the dual-PEM polarimeter signal timing and phasing require-ments outlined in Diner et al. (2007). Polarimetric accu-racy is maximized by properly sampling the video signal and by synchronizing the sampling with the retardance mod-ulation of the dual PEM. Each of the two AirMSPI PEM controllers drives an all-digital phase locked loop (PLL). This enables the phase of each PEM to be available at all times. Synchronization to the high frequency modulation and low beat frequency is accomplished by computing the sum and difference of the two PEM phases. In GroundMSPI, the support electronics are divided between a focal plane array (FPA) board and a data recovery board (DRB) (Diner et al., 2012). For AirMSPI, these circuits were combined into a single focal plane control and processing (FPCP) board that makes use of a Xilinx military-grade Virtex-5FXT field pro-grammable gate array (FPGA) in place of the Spartan-3 used
in GroundMSPI. Wide dynamic range is made possible by the large detector full well and 9 bit nonlinear quantization during each image frame. Digital encoding is linear at very low signal levels, and follows a square root law for most of the dynamic range. This is designed to keep quantization noise below 50 % of the shot noise level. Finer quantization would not improve system SNR significantly because shot noise is the dominant source of measurement uncertainty.
2.6 Instrument housing
The AirMSPI housing reuses much of the hardware devel-oped for its nonpolarimetric precursor, AirMISR (Diner et al., 1998b). The camera is mounted on a gimbal to permit multiangle imaging. Like AirMISR, the housing containing the AirMSPI gimbal assembly is mounted in the nose of the NASA high-altitude ER-2 aircraft. As shown in Fig. 1, the aluminum cylinder assembly protrudes below the aircraft fuselage. A pressure box around the gimbal assembly main-tains 276 hPa (4 psi) pressure inside the nose compartment, and the sensor head experiences outside ambient pressure (∼48 hPa or 0.7 psi at 20 km altitude). The camera and rotary stage cabling is led out through a set of pressure bulkhead connectors to the instrument electronics rack. The ER-2 sup-plies 28 VDC power to the instrument. The instrument draws ∼181 W of power during data acquisition, with an additional 70 W worth of independent heaters distributed through the camera volume to ensure that the instrument temperature does not drop below the dew point during aircraft descent. Re-engineering of the electronics and data system layout re-duced instrument mass from∼170 kg for AirMISR to 86 kg for AirMSPI.
2.7 Gimbal drive
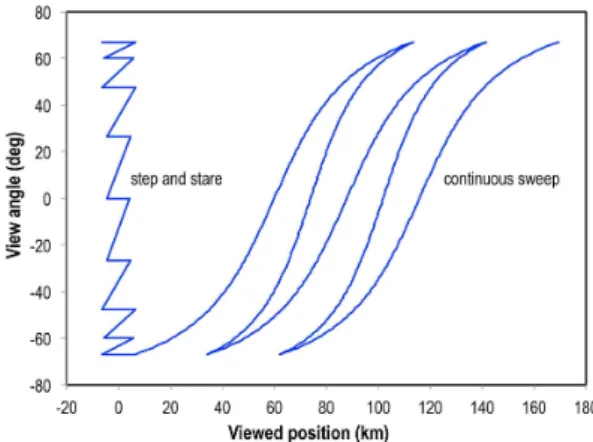
a predefined set of nine view angles). The gimbal enables image acquisition at a programmable set of along-track an-gles between ±67◦. While it is possible to acquire
obser-vations at larger view angles, aircraft attitude fluctuations significantly degrade the quality of the imagery. Sequences to be used during a given flight are pre-programmed on the ground, and are constructed from two basic operating modes, illustrated in Fig. 2. In “step and stare” mode, the camera is pointed at the same target area at a fixed set of view angles beginning with the most forward view and then stepping aft-ward as the aircraft flies downtrack. The camera then slews forward and the sequence repeats for the next target, about 100 km downtrack. This mode is most useful where the high-est possible spatial resolution (∼10 m) is desired. Target area is∼10.6 km cross-track (at nadir)×9.5 km along-track for a nominal sequence containing nine view angles. An odd num-ber of “stares” is typically selected so that the images are acquired for a set of symmetric view angles forward and aft-ward of the nadir (0◦) view angle. The along-track sample spacing (8 m at any angle) is set by the frame time and air-craft speed. In “continuous sweep” mode, the gimbal slews back and forth. Because the gimbal moves continuously, spa-tial resolution is reduced to∼50 m due to smear. However, this mode enables better spatial coverage of multilayered cloud fields. AirMSPI’s actuator permits the slew rate to vary as a continuous function of angle in order to keep the amount of image smear constant at all angles.
A variant of the first operating mode, dubbed “step and pseudostare”, is made possible by the programmable nature of the AirMSPI actuator. During each of the “stare” portions of the sequence, the gimbal drifts forward at a slow rate (be-tween a few hundredths and a few tenths of a degree per second, depending on view angle), enabling extension of the along-track length of the observed target areas. For example, without the drift, overlap imagery of nine multiangle views can be obtained with a 9.5 km target length, as noted above. Allowing a small amount of forward drift in the view an-gle during image acquisition introduces only 2 m of along-track smear and extends the target length to 11.5 km. This mode has been successfully tested in flight. Acquisition of step and pseudostare imagery at up to 31 view angles has been demonstrated.
2.8 On-board polarization monitoring and control systems
Two specialized pieces of equipment for verifying and con-trolling the performance of the polarimetric measurement approach during in-flight operations of AirMSPI were de-veloped and implemented. The first is a simple polarization “validator.” As described above, the temperature sensitivity of QWP retardance has been minimized by design, though it is still possible that the retardance may shift somewhat due to temperature changes during flight. Illumination of the cam-era with light polarized at 0, 15, 60, and 75◦provides a useful
Fig. 2.Example of the AirMSPI “step and stare” mode, with nine view angles, showing view zenith angle at the center of the cam-era field of view as a function of viewed downtrack position on the ground, and the “continuous sweep” mode, in which the gimbal slews back and forth providing variable view angles and wider areal coverage than is possible in step and stare mode.
means for determining the deviations of the polarization cal-ibration coefficients from their nominal values as a result of QWP retardance shifts. A source of light linearly polarized in these different orientations was designed and constructed for the AirMSPI camera to view in flight. This source consists of nine light-emitting diodes (LEDs), three each at the AirM-SPI polarimetric wavelengths. These illuminate a plastic dif-fuser. In front of this source, sheet polarizers at the required orientations were installed, and this assembly was integrated into the AirMSPI instrument. The validator is not designed for absolute polarimetric calibration, but rather to provide a sufficiently polarized input to the AirMSPI camera such that the shape of the modulation waveform can be used to derive the average PEM retardance. The degree of linear polariza-tion of the validator varies across the camera field of view, and has average values of 0.79, 0.88, and 0.16 at 470, 660, and 865 nm, respectively. The validator is viewed by rotating the gimbal forward to an angle of 87◦. The LEDs flash for 1 s every 10 s so that dark data can be collected between the illumination flashes. Validator data have been used to eval-uate the in-flight PEM retardance and phase control system, known as the “optical probe.”
The feedback control system then adjusts the PEM parame-ters to drive the error signals to zero. The same Virtex-5FXT FPGA that operates the rest of the AirMSPI camera performs probe data acquisition and processing. During an AirMSPI flight on 31 August 2011, the probe was operated open loop (i.e., the PEMs were monitored but not controlled). Subse-quently, a feedback algorithm was implemented to enable closed-loop operation, which was first used during a flight on 6 January 2012. Analysis of imagery of the light flashes from the onboard validator hardware enabled an independent measure of PEM retardance. The resulting data demonstrated the ability to control the PEM retardance and phase param-eters to within a fraction of 1 mrad, keeping contributions to the overall DOLP uncertainty budget at<0.001.
2.9 Data acquisition and ground processing
Flight control software consists of data acquisition routines, gimbal operation instructions, and a main program. A Con-dor CEI-200 two-channel ARINC-429 board in the AirMSPI on-board computer receives ER-2 attitude and position data. The original AirMISR on-board data system was upgraded by replacing the hard disks with solid state memory and adding a CameraLink data collection system. An IO Indus-tries frame grabber and disk shuttle packs are used. The current 4×256GB Serial Advanced Technology Attachment (SATA) solid-state drives (SSDs) provide∼1 TB of memory, enabling storage of∼10 h of data. The SSDs are exchange-able after a flight within minutes, allowing the instrument to be immediately flight-ready for a follow-up mission.
Accurate position and attitude data are required for geo-rectification and co-registration of the different channels of AirMSPI data. The camera acquires image data in pushbroom fashion (one image line at a time for each chan-nel). Image lines (frames) are acquired at a rate of 23 Hz. To georectify and co-register the acquired imagery with sub-pixel accuracy, aircraft position and attitude data are used to define the viewing geometry of each image line. AirMSPI’s ARINC-429 board receives attitude and position data at 64 Hz from the ER-2’s inertial navigation/global positioning system (INS/GPS) to meet ground data processing require-ments for image navigation (Jovanovic et al., 2001, 2012).
Data product generation makes use of the AirMSPI Data Processing System (AMDPS), which employs software de-veloped for AirMISR (Jovanovic et al., 2001) and MISR (Jovanovic et al., 2002). Level 1A1 processing reformats the raw AirMSPI output into hierarchical data format (HDF). Level 1A2 performs data conditioning, such as compen-sation for detector nonlinearity and dark level subtraction. Level 1B1 extracts the Stokes parametersI,Q, andU and their linear gradients during each image frame, and applies pixel-by-pixel radiometric gain coefficients. Level 1B2 spa-tially co-registers the channels, maps the observations to the surface terrain, corrects for residual instrument polariza-tion, and derives DOLP and AOLP relative to both the view
meridian plane (the plane containing the view vector and the surface normal) and the scattering plane (the plane contain-ing the view vector and the solar illumination vector).
3 AirMSPI flight imagery
3.1 Data product examples
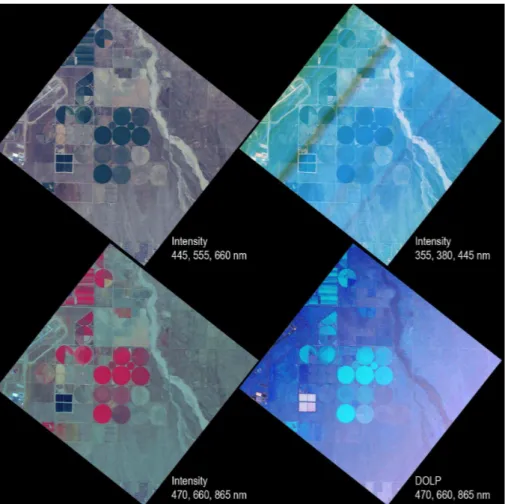
The maiden flight of AirMSPI took place on 7 October 2010 and demonstrated successful operation of the dual-PEM po-larimetric imaging technology in the high-altitude airborne flight environment (Diner et al., 2011). Figure 3 shows ex-amples of georectified nadir imagery of the area near Palm-dale, CA, acquired during this flight. Compared with the nat-ural color image (upper left), the lower surface contrast and bluish hue in the image generated from the shortest wave-length bands (upper right) result from the increase in atmo-spheric path radiance in the blue and UV. In the latter image, the discolored, darker stripes are parallel to the flight direc-tion and are due to imperfecdirec-tions in the spectral filters, lead-ing to inaccurate radiometric calibration. A correction algo-rithm is currently under development. The lower left image shows intensity at 470, 660, and 865 nm. Vegetated areas ap-pear red due to the high reflectance of leaves in the NIR. The lower right image is DOLP at 470, 660, and 865 nm. The highly polarized square features in the lower left portion of the image are wastewater treatment ponds at the Palmdale Water Reclamation Plant.
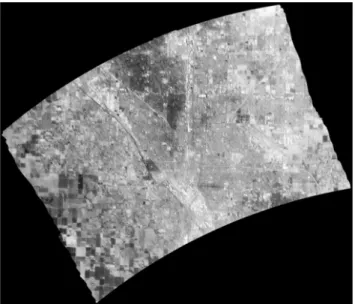
Figures 4 and 5 demonstrate the effectiveness of the AirMSPI georectification process. Figure 4 is a Level 1B1 660 nm intensity image acquired on 6 January 2012 over Fresno, CA, at a view angle of 67◦. Distortions due to
air-craft attitude fluctuations are apparent in the image. Imagery at this oblique angle is most sensitive to variations in aircraft pitch. The georectified and map projected (Level 1B2) image is shown in Fig. 5. Automated data processing makes use of aircraft navigation information to correct for image distor-tions. In general, the navigation information is used in con-junction with any available ground control and multi-image tie points to establish and account for absolute orientation of the camera to the platform frame of reference and potential time dependent drift (Jovanovic et al., 2001, 2012).
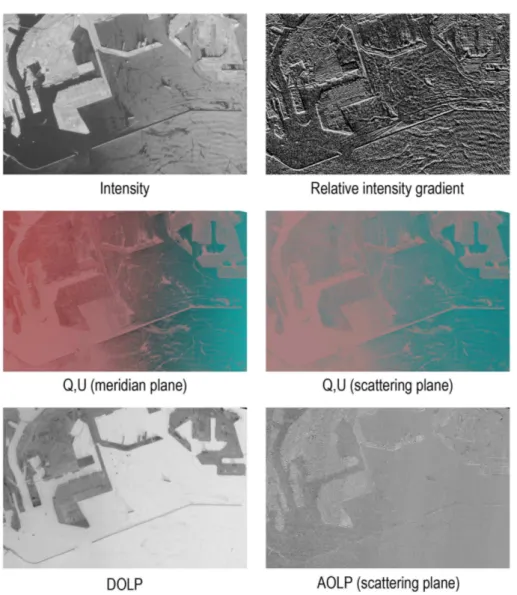
Figure 6 shows examples of the AirMSPI image products generated by the AMDPS. The data shown are from a flight over the ports of Los Angeles and Long Beach on 26 Octo-ber 2010. The wavelength is 865 nm and the view angle is 24.6◦aftward of nadir as the ER-2 was flying on a heading
of∼11◦east of north. Solar zenith and azimuth angles were 46.8 and 350.3◦, respectively (azimuth angles are defined as the direction of photon travel relative to local north). The data have been map-projected to a 10 m grid, and the area shown measures 8.7 km×5.7 km. Each of the images was individu-ally contrast enhanced to highlight detail, except thatQand
Fig. 3.Georectified imagery acquired during AirMSPI’s maiden flight on 7 October 2010. Top left panel: intensity at 445, 555, and 660 nm displayed as blue, green, and red. Top right panel: intensity at 355, 380, and 445 nm displayed as blue, green, and red. Bottom left panel: intensity at 470, 660, and 865 nm displayed as blue, green, and red. Bottom right panel: DOLP in the same spectral bands. Flight direction is from upper right to lower left. The darker, discolored stripes in the top right image are due to defects in the spectral filters. Improved calibration of these pixels is under investigation.
magnitudes. In the intensity image, the water is somewhat darker than the land and exhibits a gradient toward the lower right portion of the image where specular reflection off the water (sunglint) becomes brighter. Boat wakes and surface waves are apparent in the water. Sunglint off the ocean sur-face results in high values of DOLP (up to∼0.70). AOLP with respect to the scattering plane takes on values close to 90◦, as expected for a scene dominated by Fresnel surface reflection and single scattering. The “Q,U” images are false color composites in whichQandU are displayed in shades of red and cyan, respectively. Two versions are shown, one in whichQandUare defined with respect to the view meridian plane, the other in which they are defined with respect to the scattering plane. In addition toI,Q,Uand the derived prod-ucts DOLP and AOLP, the subframe sampling also enables determination of the linear gradient in intensity during the course of an image frame (Diner et al., 2010). This parame-ter is deparame-termined in both the polarimetric and nonpolarimet-ric channels, and can be used either as a textural measure or a
means of enhancing the along-track spatial resolution of the imagery. The relative change in intensity (1I /I) is displayed as the upper right panel in Fig. 6.
3.2 Clear sky observations over ocean
Fig. 4.Among the steps in AirMSPI ground data processing is gen-eration of Level 1B1 calibrated imagery. Rapid aircraft attitude fluc-tuations give rise to distortions from line to line. This 660 nm inten-sity image over Fresno, CA, on 6 January 2012 was acquired at a view angle of 67◦and shows these distortions, which are particu-larly evident at the top and center of the image.
et al., 2012). Hasekamp et al. (2011) applied a coupled ocean–atmosphere algorithm to Polarization and Direction-ality of Earth’s Reflectances (POLDER) satellite data to re-trieve chlorophyllaconcentration, surface wind velocity, and fractional foam coverage, along with optical and microphys-ical parameters describing a bimodal aerosol model. The in-clusion of polarization reduced both the bias and spread of aerosol optical depth (AOD) and Angstrom exponent (AE) retrievals relative to Aerosol Robotic Network (AERONET) data (Holben et al., 1998), with the most significant improve-ment occurring in AE, most likely due to increased sensitiv-ity to particle size. An intercomparison of satellite aerosol retrieval algorithms suggests that supplementing multiangle intensity observations with polarimetric measurements in-creases sensitivity to complex refractive index (Kokhanovsky et al., 2010).
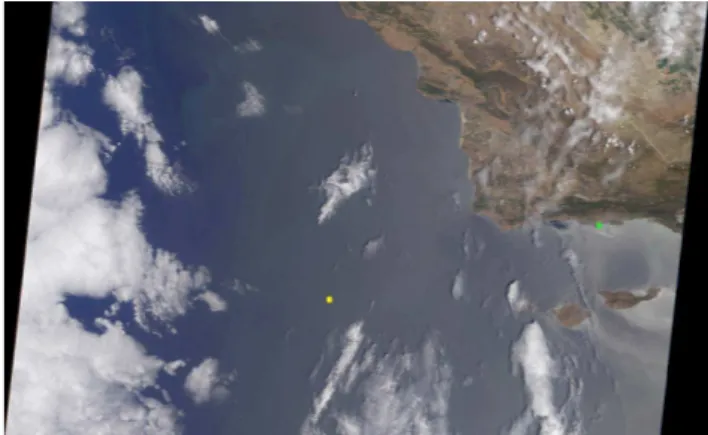
A near-simultaneous overpass of a patch of clear sky over ocean by both MISR on the Terra satellite and AirMSPI on the ER-2 on 19 July 2012 supports many of these ar-guments. Figure 7 shows a MISR natural color, nadir im-age acquired at 11:58 PDT (18:58 UTC), within which is the area observed by AirMSPI (denoted by the yellow marker) at 32.4◦N, 121.6◦W. The AirMSPI data were acquired as part of a 21-angle step-and-pseudostare sequence. The se-quence took about 7.6 min, and the nadir view shown in Fig. 8 was acquired about 28.5 min after the MISR over-pass. The MISR standard V22 aerosol product (Kahn et al., 2010) reported low AOD; two of the 74 aerosol models in the MISR database that passed the goodness-of-fit metrics
Fig. 5.Georectification and map projection at Level 1B2 makes use of high frequency navigation information to correct for distortions due to aircraft attitude fluctuations. Here, the data from Fig. 4 have been mapped to a Universal Transverse Mercator projection.
were Mixture 11, consisting of a single lognormal size dis-tribution having median radius of 0.06 µm, standard devi-ation of lognormal radius distribution = 0.53, effective ra-dius = 0.12 µm, and Mixture 8, consisting of 40 % (fractional AOD at 558 nm) of a fine mode (median radius = 0.03 µm, standard deviation of lognormal radius distribution = 0.50, effective radius = 0.06 µm) and 60 % of a coarse mode (me-dian radius = 1.00 µm, standard deviation of lognormal ra-dius distribution = 0.64, effective rara-dius = 2.80 µm). All parti-cles are nonabsorbing and have a spectrally invariant refrac-tive index of 1.45. The retrieved AODs at 558 nm for Mix-tures 11 and 8 were 0.077 and 0.078, respectively. The near-est AERONET site (green marker,∼170 km away) is on the coast at the University of California, Santa Barbara (UCSB). At 12:21 PDT (19:21 UTC) the Level 1.5 AERONET AOD, interpolated to 558 nm, is 0.077 (Level 2.0 AERONET data are currently not available for this site on this date).
Fig. 6.Ports of Los Angeles/Long Beach data acquired 26 October 2010. Images are from the 26◦aftward view at 865 nm. The area shown measures 8.7 km×5.7 km. Spatial resolution is 10 m. The “Q,U” images are false color composites in whichQandUare displayed in shades of red and cyan, respectively. Two versions are shown, one defined with respect to the view meridian plane, the other defined with respect to the scattering plane. AOLP derived from the latter takes on values very close to 90◦. Sunglint results in high values of DOLP over the water.
recently sent to the manufacturer (Labsphere, Inc.), recoated, and outfitted with Luxim light emitting plasma (LEP) lamps to improve light levels, particularly at the short wavelengths. In addition, measurements of the per-pixel spectral response functions are currently being performed using a monochro-mator, which will allow more accurate determination of the exo-atmospheric solar irradiance to be assigned to each chan-nel. As these improved laboratory calibrations are not yet complete, the near-simultaneous, well-calibrated MISR ob-servations were used to achieve a vicarious calibration of the AirMSPI flight data.
Under the assumption that ambient conditions varied lit-tle between the MISR and AirMSPI overpasses, the MISR Mixture 11 aerosol model was used to predict upwelling ra-diances in the AirMSPI spectral bands, taking into account
Fig. 7.MISR nadir image (Orbit 66950, Path 43) of an area off the coast of Southern California, acquired on 19 July 2012 at 11:58 PDT (18:58 UTC). The imaged area is about 380 km wide. The yellow marker below image center shows the location of an AirMSPI 21-angle image sequence acquired shortly after the MISR overpass. The green marker on the coast near the right-hand edge of the image shows the location of the UCSB AERONET site.
microfacets reflecting according to Fresnel’s equations and uses a generalized Gaussian slope distribution parameterized by the wind direction relative to the solar azimuthal plane and the RMS slope components in the upwind and cross-wind directions, σu andσc, respectively, which depend on wind speed. The model has been used successfully by Br´eon and Henriot (2006) to retrieve wind speeds from POLDER sunglint data. To account for shadowing, the shadow function derived for an isotropic Gaussian facet distribution (Tsang et al., 1985 and references therein) is adopted here, with
σ2 replaced by σuσc. The spectral variation in water
re-fractive index is included in the model. As the AirMSPI flight line was close to the principal plane, the anisotropic Cox–Munk model and variation in the sunglint magnitude with view angle enabled retrieval of the surface wind vec-tor. Water-leaving radiance was taken to be zero at 660 and 865 nm, and values in the blue and green were derived from MISR, assuming a Lambertian and depolarizing bidirec-tional reflectance distribution function. Although more so-phisticated models of scattering by hydrosols are available (e.g., Chowdhary et al., 2006; Zhai et al., 2010), we opted for a simple model to capture the main features of the ob-servations. The water-leaving bidirectional reflectance fac-tors were linearly extrapolated into the UV, based on the relative trend with wavelength indicated by Koelemeijer et al. (2003). Correction for ozone absorption used a climato-logical value of 314 Dobson units, the same value used in the MISR aerosol retrievals, with the assumption that only 20 % of the ozone column-integrated optical depth is situ-ated below 20 km. Because AirMSPI determines DOLP as a relative measurement independent of instrument radiometric gain, polarized intensities in the 470, 660, and 865 nm bands
Fig. 8.AirMSPI nadir intensity image of the location marked in Fig. 7. This image was acquired 28.5 min after the MISR nadir im-age was acquired. The ER-2 with AirMSPI aboard was flying to-ward the northwest very close to the principal scattering plane, and a 21-angle image sequence was acquired. Here, sunglint illuminates the surface wave structure.
were calculated by taking the calibration-adjusted total inten-sities and multiplying by DOLP.
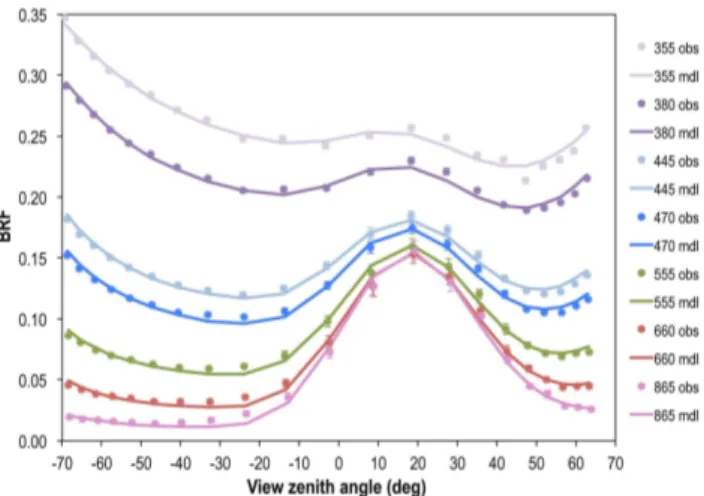
Fig. 9. Comparison of vicariously calibrated BRFs observed in seven AirMSPI bands with results of the coupled atmosphere– surface model. Observations are shown by the circles. Error bars represent the standard deviation in observed BRF within the 100 m×100 m target area. Model results are the solid lines. Pos-itively signed view zenith angles are those for which the relative view–Sun azimuth angle is>90◦or >270◦; otherwise the view zenith angle is given a negative sign.
Fig. 10.Similar to Fig. 9 but for polarized BRFs in the three polari-metric AirMSPI bands.
polarimetric observations aids in constraining particle micro-physical properties, even when aerosol loading is small.
The surface wind speed derived from modeling of the AirMSPI data is 6.7 m s−1. This compares well with a
value of about 8 m s−1 obtained from daily Special
Sen-sor Microwave/Imager (SSM/I) morning overpass data (http: //www.remss.com/ssmi/ssmibrowse.html) at the same loca-tion. The wind direction retrieved from AirMSPI has an az-imuth of 26◦measured clockwise from the solar azimuth an-gle. An independent estimate of wind direction is obtained from visual analysis of the wave patterns observed in the AirMSPI imagery (see Fig. 8). The visually estimated nor-mal to the oceanic wave fronts makes a clockwise angle of
Fig. 11.Measured DOLP in the three polarimetric AirMSPI bands (circles) as a function of view zenith angle compared to results for the monomodal model with 0.06 µm median particle radius (solid lines). Error bars represent the standard deviation in observed DOLP within the 100 m×100 m target area.
Fig. 12.Same as Fig. 11 but for the bimodal model with 40 % of the 558 nm optical depth due to a fine mode with 0.03 µm median particle radius and 60 % due to a coarse mode with 1.00 µm median particle radius. Relative to Fig. 11, fits are improved at the most oblique view zenith angles; however, the large particles in the model give rise to a bow between−30 and−40◦view zenith angle that is not observed in the AirMSPI data.
about 24◦to the flight heading, which is 325◦ from north. The average solar azimuth of 320◦during the AirMSPI im-age sequence therefore yields a wind direction of 29◦from solar meridian plane. The value derived using the Cox–Munk model to fit the angular sunglint pattern is in good agreement with this result.
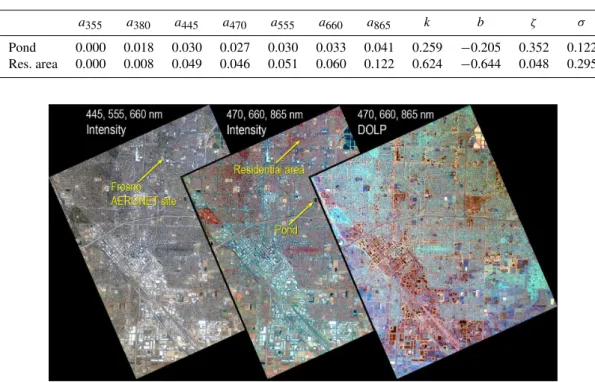
3.3 Hazy sky observations over land
Table 2.Surface parameters retrieved from fitting the AirMSPI data over the Fresno pond and residential area targets.
a355 a380 a445 a470 a555 a660 a865 k b ζ σ
Pond 0.000 0.018 0.030 0.027 0.030 0.033 0.041 0.259 −0.205 0.352 0.122 Res. area 0.000 0.008 0.049 0.046 0.051 0.060 0.122 0.624 −0.644 0.048 0.295
Fig. 13.AirMSPI nadir imagery of Fresno, CA, acquired on 6 January 2012. The left and middle images are intensity data using different spectral band combinations. The right image displays DOLP in the three polarimetric bands. The images have been contrast enhanced to highlight details. The locations of the Fresno AERONET site, the pond, and the residential area are indicated.
aerosol characteristics over land (e.g., Waquet et al., 2009; Tanr´e et al., 2011). Dubovik et al. (2011) developed a sta-tistically optimized algorithm for retrieving aerosol prop-erties and surface bidirectional reflectance parameters si-multaneously, and successfully applied the methodology to POLDER observations over Africa. While a full aerosol re-trieval is beyond the scope of this paper, a scene model was used to verify that the AirMSPI instrument is performing according to expectations, much as was done with the Pa-cific Ocean scene described above. AirMSPI flew over the Fresno, CA, AERONET site on 6 January 2012 (time of nadir view = 12:23 PST, 20:23 UTC), providing an opportunity for quantitative examination of the instrument’s data. The atmo-sphere was quite hazy on this date (AERONET reported a mid-visible AOD, interpolated to 558 nm and the time of overpass, of 0.44). Figure 13 shows nadir images acquired during that overpass. The location of the Fresno AERONET site is marked. The calibration adjustments derived from the 19 July 2012 vicarious calibration against MISR were applied to the data. Due to the high spatial resolution of AirMSPI, adjacency effects ensure that diffuse transmission of surface-leaving radiation effectively averages over an area many times larger than the pixel size. The model used here assumes that the diffusely transmitted field results from a sur-face with the same bidirectional reflectance distribution func-tion (BRDF) as that of the directly viewed surface, whereas a more rigorous retrieval algorithm would allow for spatial
inhomogeneity in the surface BRDF. Data were extracted for two 100 m ×100 m patches of ground: a pond located about 2.3 km to the southeast of the AERONET site, and a residen-tial area 1.3 km to the northeast. These sites are marked in Fig. 13.
To model the AirMSPI data, the spectral AOD and aerosol size distribution derived from AERONET direct Sun and sky radiance data were used. The AERONET-derived size distri-bution is bimodal, with the fine mode accounting for 96 % of the optical depth at 500 nm, according to the spectral decon-volution algorithm used in AERONET processing (O’Neill et al., 2003). The size distribution and wavelength depen-dent particle refractive indices were based on AERONET Level 1.5 almucantar results (Dubovik et al., 2000). The volumetric size distribution reported by AERONET peaks at 0.26 and 2.94 µm for the fine and coarse modes, respec-tively. The particle refractive index, interpolated to 558 nm, is 1.445–0.005i. Absorption by ozone was handled in the same manner as for the ocean scene, described above. The data in-version permitted a small adjustment in AOD, and returned a 558 nm value of 0.39, which is within the range of 0.37– 0.52 observed by AERONET within ±1 h of the AirMSPI overpass.
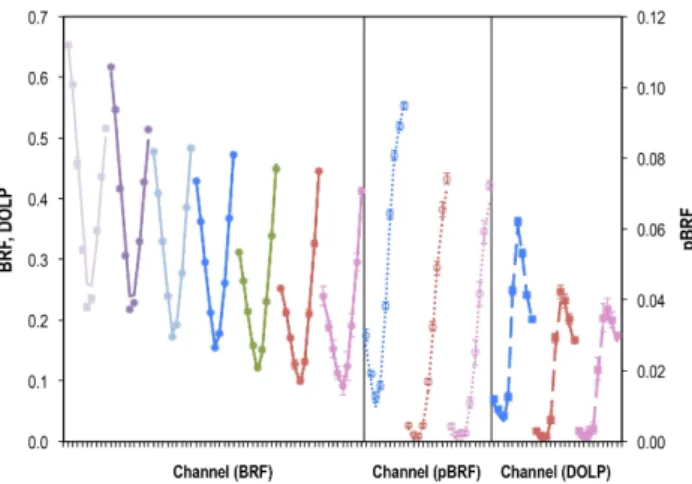
Fig. 14.Comparison of observed (circles) and modeled (lines) BRF in the 355, 380, 445, 470, 555, 660, and 865 nm bands (first seven curves from left to right), pBRF (obs as open circles, mdl as dotted lines) in the 470, 660, and 865 nm bands (next three curves), and DOLP at the same wavelengths (obs as squares, mdl as dashed lines) (last three curves) at the nine view angles acquired over the Fresno pond target. Within each of the spectral curves, view zenith angles from left to right are 67.7, 60.9, 50.2, 31.8, 3.1, 27.9, 46.8, 58.1, and 65.3◦. The left-handyaxis is associated BRF and DOLP and the right-handyaxis is associated with pBRF. Error bars correspond to standard deviations of the data within the 100 m×100 m target area.
polarizing term generated by an array of Fresnel-reflecting microfacets (Priest and Meier, 2002). The refractive index of the surface,nr,surf, is taken to be 1.5 (Waquet et al., 2009); however, in contrast to the ocean model, a wavelength-independent factor,ζ, multiplies the magnitude of the micro-facet contribution to the BRDF to compensate for a possibly incorrect choice ofnr,surf. An isotropic Gaussian distribution
for the facet orientations is assumed, with RMS slopeσ. The shadowing term of Tsang et al. (1985) was included. Keep-ing the parameters of the aerosol model fixed, the degrees of freedom of the scene model are the surface parametersζ,
σ, the wavelength-dependent coefficients of the mRPV func-tion,aλ, and the wavelength-independent angular shape
pa-rameters k (the exponent of a Minnaert-like function) and
b (which governs the dependence on scattering angle), for a total of 11 parameters. Values for these parameters were determined by fitting the model to the AirMSPI BRF and pBRF data simultaneously (90 measurements, corresponding to nine angles, seven bands for BRF and nine angles, three bands for polarized BRF).
Comparisons of modeled and measured BRF, pBRF, and DOLP are given in Figs. 14 (pond) and 15 (residential area) respectively. “Channel” refers to a particular combination of view zenith angle and spectral band. The fitted param-eters are shown in Table 2. The negligible values ofaλ at
355 nm indicate that the surface has negligible effect on the top-of-atmosphere measurements, likely owing to the intrin-sically low surface reflectance and high atmospheric turbidity
Fig. 15.Same as Fig. 14 except for the Fresno residential area tar-get. Due to the slightly different position of this target within the instrument field of view, view zenith angles from left to right are 67.9, 61.6, 51.1, 33.2, 5.3, 27.0, 45.8, 57.5, and 64.8◦within each of the spectral curves.
(Rayleigh+aerosol optical depth∼=1.1) at this wavelength. For the residential area,aλmore than doubles at 865 nm
com-pared with the mid-visible due to the presence of vegetation (trees and lawns). The higher negative value ofbfor the veg-etation is consistent with the expectation that areas with ver-tical structures (in this case, vegetation and buildings) cast shadows in the forward scattering direction and are brighter in backscatter. Although adjustments to the aerosol proper-ties could conceivably improve the fits, the model for the most part reproduces the overall spectral and angular vari-ations of BRF, pBRF, and DOLP observed by AirMSPI.
3.4 Cloud observations
Fig. 16.Stereo anaglyph of San Francisco and a high-altitude cloud field generated using AirMSPI imagery at two view angles (approx-imately 4◦forward and 28◦aftward of nadir), acquired on 6 Jan-uary 2012. 660 nm data from the near-nadir view are displayed in red; 445 and 555 nm data from the aftward view are displayed in blue and green. The image is best viewed using red/cyan glasses with the red filter over the left eye to obtain a 3-D effect. The cloud parallax is too large for good image fusion, but surface topographic relief is apparent when the image is viewed with stereo glasses. North is toward the upper left. The motion of a boat approaching the Golden Gate Bridge is apparent due to the time lapse between the two images used to construct this anaglyph.
of thin cirrus (Prasad and Davies, 2012), and AirMSPI can capitalize on this technique as well.
To demonstrate the stereo information content of AirMSPI imagery, Fig. 16 is a stereo anaglyph of San Francisco gen-erated using AirMSPI imagery acquired on 6 January 2012 between 01:08 and 01:09 PST (21:08 and 21:09 UTC) at two view angles (approximately 4◦forward and 28◦ aftward of nadir). The near-nadir 660 nm intensities are displayed in red and the 445 and 555 nm intensities from the aftward view are displayed in blue and green. The image has been rotated 38◦ counterclockwise to align the flight direction with the hori-zontal axis, and is best viewed using red/cyan glasses with the red filter over the left eye to get a 3-D effect. North is toward the upper left. The long, dark rectangular feature be-low center is Golden Gate Park, and the Golden Gate Bridge is visible to the left of center. Topographic relief is apparent within the city and in the terrain to the north of the Golden Gate Bridge. The largest stereo parallax (displacement) is ob-served over the clouds, which appear with a reddish tinge along the right-hand edge of the image, and in cyan in the aft-ward view. Estimates of the cloud parallax from this image pair and also between the 28 and 48◦aftward views places the cloud heights between 7 and 8 km. National Weather Service (NWS) radiosonde soundings from Oakland, CA, at 00:00 UTC on 7 January 2012, obtained from the University
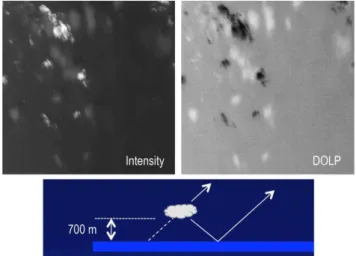
Fig. 17.Top left panel: 46◦forward view of 865 nm intensity show-ing clouds and cloud reflections in the ocean, acquired 7 Octo-ber 2010. Top right panel: same view in DOLP. The clouds appear dark in polarization at this illumination and view geometry, but the cloud reflections in the water are highly polarized. Bottom panel: cartoon of cloud reflection in water and geometrically derived base height of∼700 m.
of Wyoming Department of Atmospheric Science website (http://weather.uwyo.edu/upperair/sounding.html), show the air temperature to be−31.2◦C at an altitude of 7.6 km, con-sistent with these being primarily ice (cirrus) clouds, as evi-dent from their wispy structure and optically thin appearance through which the surface can be seen.
Over ocean, off-nadir polarimetric imaging enhances the appearance of cloud reflections in the water. Since the source of illumination is the underside of the clouds, and cumulus clouds typically have flat bottoms and rounded tops, the sepa-ration between the cloud image and its reflection, or between cloud reflection images at different angles of view, enables estimation of cloud base height. Figure 17 shows AirMSPI images of clouds over the Pacific Ocean acquired on 7 Oc-tober 2010 at∼12:25 PDT (19:25 UTC). The left image is 865 nm intensity at a forward-looking view angle of 46◦, showing cumulus clouds and the fainter reflections of the clouds in the water. At this view angle, clouds have low po-larization and appear dark (right image), with DOLP as low as 0.03. The cloud reflections in the water are the most po-larized features, with DOLP as high as 0.80. Polarization is likely enhanced due to the fact that the view direction is close to the Brewster angle for water (53◦). When attempting to
Fig. 18.AirMSPI stratocumulus cloud imagery at 470, 660, and 865 nm (left panel: intensity; right panel: DOLP) acquired in sweep mode on 31 August 2011 off the coast of California. In the DOLP image, the colored rings between the glory (near 180◦ scattering angle) and primary cloudbow (near 143◦scattering angle) are su-pernumerary arcs – interference fringes resulting from the narrow spherical droplet size distribution. Multiple scattering washes out these features in the intensity image, but the glory is faintly visible.
Fig. 17 shows how the displacement between an off-nadir image of a cloud and its reflection gives an estimate of base height, assuming that the cloud is widest at this altitude. Mea-surements of the AirMSPI imagery imply an altitude of about 700 m. NWS radiosonde soundings from the San Diego, CA, station at 00:00 UTC on 8 October 2010 show a steep in-crease in relative humidity centered at 610 m above sea level. The estimated height is also within the range of reported av-erage cloud base heights of 430 m in the summer and 950 m in the winter for clouds off the California coast (Lin et al., 2009).
Analyses of data from the POLDER satellite instruments have shown that polarimetry at scattering angles correspond-ing to supernumerary cloudbows is sensitive to the mean and dispersion of cloud droplet size (Br´eon and Goloub, 1998; Br´eon and Doutriaux-Boucher, 2005). The primary cloudbow, supernumerary bows, and glory have also been observed in high-resolution AirMSPI imagery mapped to a 25 m grid (by comparison, POLDER resolution is about
Fig. 19.Estimates of scattering phase matrix elementP12 derived from primary cloudbow and supernumerary bow data acquired by AirMSPI off the coast of Southern California on 31 August 2011 (open circles). Observations at the same scattering angle have been binned together in steps of 0.125◦. Corrections for view and il-lumination geometry, Rayleigh transmittance and scattering, and ozone absorption have been applied to the data. The model results (solid lines) are derived following the methodology of Br´eon and Goloub (1998). The results shown are for a droplet size distribution with an effective radius of 7.5 µm and effective variance of 0.01. The model takes into account the spectrally varying index of refrac-tion of water. To make the plots more visible, the data and model results at 660 nm have been offset upwards by 0.3, and the results at 865 nm have been offset upwards by 0.6.
6 km). Figure 18 shows AirMSPI intensity and DOLP im-agery of marine stratocumulus clouds off the coast of South-ern California, acquired on 31 August 2011 at 12:51 PDT (19:51 UTC). The data were obtained in the instrument’s sweep mode, and the bowtie shape results from the increase in swath width with increasing view angle, which ranges between±65.5◦from nadir. The images are 470, 660, and 865 nm composites. The glory appears near scattering an-gle, , of 180◦ (Sun directly behind the instrument), and
Qobs,λ =
µ0E0λ
4π (µ+µ0)
P12,λ() e
−τR,λ
1 µ+ 1 µ0
+P12,Ray()
1−e−τR,λ
1 µ+µ10
e−τozone,λ
0.2 µ+µ10
, (1)
where E0λ is the solar spectral irradiance; µ and µ0 are
cosines of the view and solar zenith angles, respectively;τR,λ
is the Rayleigh optical depth above the cloud top, assumed to be at 1 km altitude (a typical height for marine stratocumulus clouds); andτozone,λis a climatological estimate of the ozone
optical depth, with the factor of 0.2 in the exponent result-ing from the assumption that only 20% of the ozone column-integrated optical depth is situated below the aircraft altitude. As in Br´eon and Goloub (1998), the cloud is assumed to be sufficiently optically thick such that terms involving trans-mission through the cloud may be neglected.P12,Raydenotes
the first row, second column element of the Rayleigh scat-tering phase matrix, equal to−0.75 sin2, andP12,λ
signi-fies the corresponding element for the other scatterers in the scene. This term is established primarily by single scattering from the main cloud deck but implicitly includes factors such as multiple scattering, aerosol, and cirrus effects (Alexandrov et al., 2012). For each observation ofQincluded in the anal-ysis, Eq. (1) is inverted to obtainP12,λ, which is then binned
by scattering angle in steps of 0.125◦. Results derived from
the observations at 470, 660, and 865 nm for the scattering range 135 to 170◦are shown in Fig. 19 as the open circles. The primary cloudbow appears at∼143◦, and the supernu-merary arcs at each wavelength appear with progressively di-minishing amplitude as scattering angle increases. Note that the number of fringes increases as wavelength decreases, as expected for an interference phenomenon in which there are more blue wavelengths than red wavelengths per given drop diameter.
The solid lines in Fig. 19 are obtained by fitting the val-ues ofP12,λ derived from the observations to the following
model:
P12,λ=aλP12,cld,λ+bλ+cλ, (2)
whereP12,cld,λ is the first row, second column element of
the single-scattering phase matrix for the cloud deck, estab-lished using Mie theory for a narrow distribution of spheri-cal droplet sizes. The spectrally variablea,b,ccoefficients are determined empirically by least-squares fitting. The form of Eq. (2) was introduced by Br´eon and Goloub (1998) as a simple way of accounting for unmodeled scene effects. An alternative fitting approach, introduced by Alexandrov et al. (2012), eliminates the Rayleigh correction procedure and uses cos2instead ofin the second term on the right hand side of Eq. (2). Both methods yielded similar results. A size distribution in which the number of droplets between radiusr
andr+dr is proportional to(r/reff)v
−1
eff−3exp(−r/reffveff) was used (Hansen, 1971; Br´eon and Goloub, 1998; Br´eon
and Doutriaux-Boucher, 2005), wherereffis the effective
ra-dius andveffis the effective variance. A narrow cloud droplet
size distribution withreff= 7.5 µm andveff= 0.01 generated
the model results shown in Fig. 19. The spectral dependence of the refractive index of water needs to be taken into ac-count, as noted by Br´eon and Doutriaux-Boucher (2005). A sixth-degree polynomial fit to the data of Daimon and Ma-sumura (2007) for distilled water at a temperature of 19◦C was used to derive the real part of the index of refraction of 1.3385 (470 nm), 1.3315 (660 nm), and 1.3276 (865 nm). This temperature is consistent with the average value over the lowest 1 km of the atmosphere (∼21◦C) determined from San Diego radiosonde data at 12:00 UTC on 31 August 2011 and 00:00 UTC on 1 September 2011. Small changes on the order of 0.001 in the index of refraction cause noticeable shifts in the location of the primary cloudbow and super-numerary arcs with respect to scattering angle, resulting in poorer fits. Improved fits could likely be obtained using more rigorous analysis and including aerosols and multiple scatter-ing effects.
4 Conclusions
AirMSPI has been flying aboard NASA’s ER-2 high-altitude aircraft since October 2010. At the heart of the instrument is an eight-band spectropolarimetric camera that acquires multiangle imagery through a combination of aircraft mo-tion and actuamo-tion on a single-axis gimbal. AirMSPI em-ploys a dual PEM-based polarimetric imaging technique to determine degree and angle of linear polarization (DOLP and AOLP) on a pixel-by-pixel basis as relative measure-ments, independent of instrument absolute radiometric cali-bration. This methodology was first introduced through theo-retical formulation and bench testing (Diner et al., 2007), and has subsequently matured into progressively more sophis-ticated imaging instruments, beginning with the monochro-matic LabMSPI (Diner et al., 2010), the UV/VNIR ground-based camera GroundMSPI (Diner et al., 2012), and most re-cently, the UV/VNIR airborne sensor, AirMSPI. The MSPI team is currently developing a second-generation instrument, AirMSPI-2, which extends the spectral range into the SWIR. Since the AirMSPI optical coatings perform well over the en-tire UV-SWIR spectral range (see Sect. 2.1), AirMSPI-2 uses the same coating design for its mirrors.
cloud droplet size, morphological parameters such as cloud-top and cloud-base height, and ocean surface wind speed and direction have been demonstrated through visualizations and analyses. This type of data evaluation is an essential precur-sor to implementation of geophysical retrieval algorithms, which are currently undergoing development.
Recent efforts have focused on improvements and up-grades to the equipment and procedures used for radiometric, polarimetric, and spectral calibration of the AirMSPI cam-era. AirMSPI L1B2 data products will be publicly released through the NASA Langley Atmospheric Sciences Data Cen-ter, beginning in mid-2013. We look forward to productive utilization of this new remote sensing resource by the scien-tific community.
Acknowledgements. The authors thank the entire AirMSPI engi-neering team for their efforts. This research is being carried out at the Jet Propulsion Laboratory, California Institute of Technology under contract with NASA, and at the University of Arizona College of Optical Sciences, the University of Texas Center for Space Research, and the University of California Joint Institute for Regional Earth System Science and Engineering (JIFRESSE) under subcontract with JPL. Funding from the NASA Instrument Incubator Program, Airborne Instrument Technology Transition Program, and Earth Science Research Program is gratefully acknowledged. We thank Brent Holben and Carol Bruegge for their efforts in establishing and maintaining the UCSB and Fresno AERONET sites.
Edited by: O. Dubovik
References
ACE Science Working Group: Aerosol, Cloud and Ecosystems (ACE) Proposed Satellite Mission Study Report, available at: http://dsm.gsfc.nasa.gov/ace/library.html (last access: 11 Febru-ary 2013), 2010.
Alexandrov, M. D., Cairns, B., Emde, C., Ackerman, A. S., and van Diedenhoven, B.: Accuracy assessments of cloud droplet size retrievals from polarized reflectance measurements by the research scanning polarimeter, Remote Sens. Environ., 125, 92– 111, 2012.
Br´eon, F.-M. and Doutriaux-Boucher, M.: A comparison of cloud droplet radii measured from space, IEEE T. Geosci. Remote, 43, 1796–1805, 2005.
Br´eon, F.-M. and Goloub, P.: Cloud droplet effective radius from spaceborne polarization measurements, Geophys. Res. Lett., 25, 1879–1882, 1998.
Br´eon, F.-M. and Henriot, N.: Spaceborne observations of ocean glint reflectance and modeling of wave slope distributions, J. Geophys. Res., 111, C06005, doi:10.1029/2005JC003343, 2006. Bruegge, C. J., Chrien, N. L., Diner, D. J., Kahn, R. A., and Mar-tonchik, J. V.: MISR radiometric uncertainty analyses and their utilization within geophysical retrievals, Metrologia, 35, 571– 579, 1998.
Cairns, B., Russell, E. E., LaVeigne, J. D., and Tennant, P. M. W.: Research scanning polarimeter and airborne usage for remote sensing of aerosols, Proc. SPIE, 5158, 33–44, 2003.
CCSP – Climate Change Science Program: Atmospheric Aerosol Properties and Climate Impacts, A Report by the US CCSP and the Subcommittee on Global Change Research, edited by: Chin, M., Kahn, R. A., and Schwartz, S. E., National Aeronautics and Space Administration, Washington, D.C., USA, 128 pp., 2009. Chowdhary, J., Cairns, B., Mishchenko, M., and Travis, L.:
Re-trieval of aerosol properties over the ocean using multispectral and multiangle photopolarimetric measurements from the Re-search Scanning Polarimeter, Geophys. Res. Lett., 28, 243–246, 2001.
Chowdhary, J., Cairns, B., and Travis, L. D.: Case studies of aerosol retrievals over the ocean from multiangle, multispectral pho-topolarimetric remote sensing data, J. Atmos. Sci., 59, 383–397, 2002.
Chowdhary, J., Cairns, B., and Travis, L. D.: Contribution of water-leaving radiances to multiangle, multispectral polarimetric obser-vations over the open ocean: bio-optical model results for case 1 waters, Appl. Optics, 45, 5542–5567, 2006.
Chowdhary, J., Cairns, B., Waquet, F., Knobelspiesse, K., Ottaviani, M., Redemann, J., Travis, L., and Mishchenko, M.: Sensitivity of multiangle, multispectral polarimetric remote sensing over open oceans to water-leaving radiance: analyses of RSP data acquired during the MILAGRO campaign, Remote Sens. Environ., 118, 284–308, 2012.
Cox, C. and Munk, W.: Slopes of the sea surface deduced from pho-tographs of sun glitter, Bull. Scripps Inst. Oceanogr., 6, 401–488, 1956.
Daimon, M. and Masumura, A.: Measurement of the refractive in-dex of distilled water from the near-infrared region to the ultra-violet region, Appl. Optics, 46, 3811–3820, 2007.
Diner, D. J., Beckert, J. C., Reilly, T. H., Bruegge, C. J., Conel, J. E., Kahn, R. A., Martonchik, J. V., Ackerman, T. P., Davies, R., Gerstl, S. A. W., Gordon, H. R., Muller, J.-P., Myneni, R. B., Sellers, P. J., Pinty, B., and Verstraete, M.: Multi-angle Imaging SpectroRadiometer (MISR) instrument description and experi-ment overview, IEEE T. Geosci. Remote, 36, 1072–1087, 1998a. Diner, D. J., Barge, L. M., Bruegge, C. J., Chrien, T. G., Conel, J. E., Eastwood, M. L., Garcia, J. D., Hernandez, M. A., Kurzweil, C. G., Ledeboer, W. C., Pignatano, N. D., Sarture, C. M., and Smith, B. G.: The Airborne Multi-angle Imaging SpectroRa-diometer (AirMISR): Instrument description and first results, IEEE T. Geosci. Remote, 36, 1339–1349, 1998b.
Diner, D. J., Davis, A., Hancock, B., Gutt, G., Chipman, R. A., and Cairns, B.: Dual photoelastic modulator-based polarimetric imaging concept for aerosol remote sensing, Appl. Optics, 46, 8428–8445, 2007.
Diner, D. J., Davis, A., Hancock, B., Geier, S., Rheingans, B., Jo-vanovic, V., Bull, M., Rider, D. M., Chipman, R. A., Mahler, A., and McClain, S. C.: First results from a dual photoelastic modulator-based polarimetric camera, Appl. Optics, 49, 2929– 2946, 2010.
Diner, D. J., Xu, F., Martonchik, J. V., Rheingans, B. E., Geier, S., Jovanovic, V. M., Davis, A., Chipman, R. A., and McClain, S. C.: Exploration of a polarized surface bidirectional reflectance model using the Ground-based Multiangle SpectroPolarimetric Imager, Atmosphere, 3, 591–619, 2012.
Dubovik, O., Smirnov, A., Holben, B. N., King, M. D., Kaufman, Y. J., Eck, T. F., and Slutsker, I.: Accuracy assessment of aerosol optical properties retrieval from AERONET sun and sky radiance measurements, J. Geophys. Res., 105, 9791–9806, 2000. Dubovik, O., Herman, M., Holdak, A., Lapyonok, T., Tanr´e, D.,
Deuz´e, J. L., Ducos, F., Sinyuk, A., and Lopatin, A.: Statistically optimized inversion algorithm for enhanced retrieval of aerosol properties from spectral multi-angle polarimetric satellite obser-vations, Atmos. Meas. Tech., 4, 975–1018, doi:10.5194/amt-4-975-2011, 2011.
Garay, M. J., de Szoeke, S. P., and Moroney, C. M.: Com-parison of marine stratocumulus cloud top heights in the Southeastern Pacific retrieved from satellites with coinci-dent ship-based observations, J. Geophys. Res., 113, D18204, doi:10.1029/2008JD009975, 2008.
Goloub, P., Deuz´e, J. L., Herman, M., and Fouquart, Y.: Analysis of the POLDER polarization measurements performed over cloud covers, IEEE T. Geosci. Remote, 32, 78–88, 1994.
Hansen, J. E.: Multiple scattering of polarized light in planetary at-mospheres, Part II. Sunlight reflected by terrestrial water clouds, J. Atmos. Sci., 28, 1400–1426, 1971.
Harshvardhan, Zhao, G., Di Girolamo, L., and Green, R. N.: Satellite-observed location of stratocumulus cloud-top heights in the presence of strong inversions, IEEE T. Geosci. Remote, 47, 1421–1428, 2009.
Hasekamp, O. P. and Landgraf, J.: Retrieval of aerosol properties over land surfaces: capabilities of multiple-viewing-angle inten-sity and polarization measurements, Appl. Optics, 46, 3332– 3344, 2007.
Hasekamp, O. P., Litvinov, P., and Butz, A.: Aerosol prop-erties over the ocean from PARASOL multiangle photopo-larimetric measurements, J. Geophys. Res., 116, D14204, doi:10.1029/2010JD015469, 2011.
Holben, B. N., Eck, T. F., Slutsker, I., Tanr´e, D., Buis, J. P., Set-zer, A., Vermote, E., Reagan, J. A., Kaufman, Y. J., Nakajima, T., Lavenu, F., Jankowiak, I., and Smirnov, A.: AERONET – a federated instrument network and data archive for aerosol char-acterization, Remote Sens. Environ., 66, 1–16, 1998.
Jovanovic, V., Ledeboer, B., Smyth, M., and Zong, J.: Georecti-fication of the Airborne Multiangle Imaging SpectroRadiome-ter, available at: http://trs-new.jpl.nasa.gov/dspace/handle/2014/ 13195, last access: 11 February 2013, ISPRS Workshop on High Resolution Mapping from Space, Hannover, Germany, 2001. Jovanovic, V. M., Bull, M. A., Smyth, M. M., and Zong, J.: MISR
in-flight camera geometric model calibration and georectification performance, IEEE T. Geosci. Remote, 40, 1512–1519, 2002. Jovanovic, V. M., Bull, M., Diner, D. J., Geier, S., and
Rhein-gans, B.: Automated data production for a novel Airborne Mul-tiangle SpectroPolarimetric Imager (AirMSPI), Int. Arch. Pho-togramm. Remote Sens. Spatial Inf. Sci., XXXIX-B1, 33–38, doi:10.5194/isprsarchives-XXXIX-B1-33-2012, 2012.
Kahn, R. A., Gaitley, B. J., Garay, M. J., Diner, D. J., Eck, T. F., Smirnov, A., and Holben, B. N.: Multiangle Imaging SpectroRa-diometer global aerosol product assessment by comparison with the Aerosol Robotic Network, J. Geophys. Res., 115, D23209, doi:10.1029/2010JD014601, 2010.
Karlsson, J., Svensson, G., Cardoso, S., Teixeira, J., and Paradise, S.: Subtropical cloud-regime transitions: boundary layer depth and cloud-top height evolution in models and observations, J. Appl. Meteorol. Clim., 49, 1845–1858, 2010.
Kawata, Y.: Circular polarization of sunlight reflected by planetary atmospheres, Icarus, 33, 217–232, 1978.
Koelemeijer, R. B. A., de Haan, J. F., and Stammes, P.: A database of spectral surface reflectivity in the range 335–772 nm derived from 5.5 years of GOME observations, J. Geophys. Res., 108, 4070, doi:10.1029/2002JD002429, 2003.
Kokhanovsky, A. A., Deuz´e, J. L., Diner, D. J., Dubovik, O., Ducos, F., Emde, C., Garay, M. J., Grainger, R. G., Heckel, A., Herman, M., Katsev, I. L., Keller, J., Levy, R., North, P. R. J., Prikhach, A. S., Rozanov, V. V., Sayer, A. M., Ota, Y., Tanr´e, D., Thomas, G. E., and Zege, E. P.: The inter-comparison of major satellite aerosol retrieval algorithms using simulated intensity and polar-ization characteristics of reflected light, Atmos. Meas. Tech., 3, 909–932, doi:10.5194/amt-3-909-2010, 2010.
Lebsock, M. D., L’Ecuyer, T., and Stephens, G. L.: Information con-tent of near-infrared spaceborne multiangular polarization mea-surements for aerosol retrievals, J. Geophys. Res., 112, D14206, doi:10.1029/2007JD008535, 2007.
Lin, W., Zhang, M., and Loeb, N. G.: Seasonal variation of the phys-ical properties of marine boundary layer clouds off the California coast, J. Climate, 22, 2624–2638, 2009.
Lohmann, U. and Feichter, J.: Global indirect aerosol effects: a re-view, Atmos. Chem. Phys., 5, 715–737, doi:10.5194/acp-5-715-2005, 2005.
Mahler, A., Raouf, N. A., Smith, P. K., McClain, S. C., and Chip-man, R. A.: Minimizing instrumental polarization in the Mul-tiangle SpectroPolarimetric Imager (MSPI) using diattenuation balancing between the three mirror coatings, Proc. SPIE, 7013, 701355, doi:10.1117/12.791941, 2008.
Mahler, A., Diner, D. J., and Chipman, R. A.: Analysis of static and time-varying polarization errors in the multiangle spectropolari-metric imager, Appl. Optics, 50, 2080–2087, 2011a.
Mahler, A., McClain, S., and Chipman, R.: Achromatic athermal-ized retarder fabrication, Appl. Optics, 50, 755–765, 2011b. Martonchik, J. V., Diner, D. J., Pinty, B., Verstraete, M. M., Myneni,
R. B., Knyazikhin, Y., and Gordon, H. R.: Determination of land and ocean reflective, radiative, and biophysical properties using multiangle imaging, IEEE T. Geosci. Remote, 36, 1266–1281, 1998.
Mishchenko, M. I. and Travis, L. D.: Satellite retrieval of aerosol properties over the ocean using polarization as well as intensity of reflected sunlight, J. Geophys. Res., 102, 16989–17014, 1997. Moroney, C., Davies, R., and Muller, J.-P.: Operational retrieval of cloud-top heights using MISR data, IEEE T. Geosci. Remote, 40, 1532–1540, 2002.
O’Neill, N. T., Eck, T. F., Smirnov, A., Holben, B. N., and Thulasir-aman, S.: Spectral discrimination of coarse and fine mode optical depth, J. Geophys. Res., 108, 4559–4573, 2003.
Plass, G. N., Kattawar, G. W., and Hitzfelder, S. J.: Multiple scat-tered radiation emerging from Rayleigh and continental haze lay-ers – 2. Ellipticity and direction of polarization, Appl. Optics, 15, 1003–1011, 1976.
Prasad, A. A. and Davies, R.: Detecting tropical thin cirrus using Multiangle Imaging SpectroRadiometer’s oblique cameras and modeled outgoing longwave radiation, J. Geophys. Res., 117, D06208, doi:10.1029/2011JD016798, 2012.
Priest, R. G. and Meier, S. R.: Polarimetric microfacet scattering theory with applications to absorptive and reflective surfaces, Opt. Eng., 41, 988–993, 2002.
Randall, D. A., Wood, R. A., Bony, S., Colman, R., Fichefet, T., Fyfe, J., Kattsov, V., Pitman, A., Shukla, J., Noda, A., Srinivasan, J., Stouffer, R. J., Sumi, A., and Taylor, K. E.: Climate mod-els and their evaluation, In Climate change 2007: The Physical Science Basis, Contribution of Working Group I to the Fourth Assessment Report of the Intergovernmental Panel on Climate Change, edited by: Solomon, S., Qin, D., Manning, M., Chen, Z., Marquis, M., Averyt, K. B., Tignor, M., and Miller, H. L., Cambridge University Press, Cambridge, UK and New York, NY, USA, 2007.
Tanr´e, D., Br´eon, F. M., Deuz´e, J. L., Dubovik, O., Ducos, F., Franc¸ois, P., Goloub, P., Herman, M., Lifermann, A., and Waquet, F.: Remote sensing of aerosols by using polarized, directional and spectral measurements within the A-Train: the PARASOL mission, Atmos. Meas. Tech., 4, 1383–1395, doi:10.5194/amt-4-1383-2011, 2011.
Torres, O., Herman, J. R., Bhartia, P. K., and Sinyuk, A.: Aerosol properties from EP-TOMS near UV observations, Adv. Space Res., 29, 1771–1780, 2002.
Tsang, L., Kong, J. A., and Shin, R.: Theory of Microwave Remote Sensing, Chapter 2, Wiley-Interscience, New York, 93–96, 1985. Waquet, F., Cairns, B., Knobelspiesse, K., Chowdhary, J., Travis, L. D., Schmid, B., and Mishchenko, M. I.: Polarimetric remote sensing of aerosols over land, J. Geophys. Res., 114, D01206, doi:10.1029/2008JD010619, 2009.
Wood, R.: Cancellation of aerosol indirect effects in marine stra-tocumulus through cloud thinning, J. Atmos. Sci., 64, 2657– 2669, 2007.
Wu, D. L., Ackerman, S. A., Davies, R., Diner, D. J., Garay, M. J., Kahn, B. H., Maddux, B. C., Moroney, C. M., Stephens, G. L., Veefkind, J. P., and Vaughan, D. M.: Vertical distributions and relationships of cloud occurrence frequency as observed by MISR, AIRS, MODIS, OMI, CALIOP, and CloudSat, Geophys. Res. Lett., 36, L09821, doi:10.1029/2009GL037464, 2009. Xu, F., Davis, A. B., West, R. A., Martonchik, J. V., and Diner, D. J.:
Markov chain formalism for vector radiative transfer in a plane-parallel atmosphere overlying a polarizing surface, Opt. Lett., 36, 2083, doi:10.1364/OL.36.002083, 2011.