AMTD
6, 1717–1769, 2013The Airborne Multiangle SpectroPolarimetric
Imager (AirMSPI)
D. J. Diner et al.
Title Page
Abstract Introduction
Conclusions References
Tables Figures
◭ ◮
◭ ◮
Back Close
Full Screen / Esc
Printer-friendly Version Interactive Discussion
Discussion
P
a
per
|
Dis
cussion
P
a
per
|
Discussion
P
a
per
|
Discussio
n
P
a
per
|
Atmos. Meas. Tech. Discuss., 6, 1717–1769, 2013 www.atmos-meas-tech-discuss.net/6/1717/2013/ doi:10.5194/amtd-6-1717-2013
© Author(s) 2013. CC Attribution 3.0 License.
Atmospheric Measurement
Techniques
Open Access
Discussions
Geoscientiic Geoscientiic
Geoscientiic Geoscientiic
This discussion paper is/has been under review for the journal Atmospheric Measurement Techniques (AMT). Please refer to the corresponding final paper in AMT if available.
The Airborne Multiangle
SpectroPolarimetric Imager (AirMSPI):
a new tool for aerosol and cloud remote
sensing
D. J. Diner1, F. Xu1,2, M. J. Garay1, J. V. Martonchik1, B. E. Rheingans1, S. Geier1, A. Davis3, B. R. Hancock1, V. M. Jovanovic1, M. A. Bull1, K. Capraro1,
R. A. Chipman4, and S. C. McClain4
1
Jet Propulsion Laboratory, California Institute of Technology, Pasadena, CA 91109, USA
2
University of California, Los Angeles, CA 90095, USA
3
University of Texas, Center for Space Research, Austin, TX 78759, USA
4
University of Arizona, College of Optical Sciences, Tucson, AZ 85721, USA
Received: 9 January 2013 – Accepted: 4 February 2013 – Published: 14 February 2013 Correspondence to: D. J. Diner (david.j.diner@jpl.nasa.gov)
AMTD
6, 1717–1769, 2013The Airborne Multiangle SpectroPolarimetric
Imager (AirMSPI)
D. J. Diner et al.
Title Page
Abstract Introduction
Conclusions References
Tables Figures
◭ ◮
◭ ◮
Back Close
Full Screen / Esc
Printer-friendly Version Interactive Discussion
Discussion
P
a
per
|
Dis
cussion
P
a
per
|
Discussion
P
a
per
|
Discussio
n
P
a
per
Abstract
The Airborne Multiangle SpectroPolarimetric Imager (AirMSPI) is an eight-band (355, 380, 445, 470, 555, 660, 865, 935 nm) pushbroom camera, measuring polarization in the 470, 660, and 865 nm bands, mounted on a gimbal to acquire multiangular ob-servations over a±67◦ along-track range. The instrument has been flying aboard the
5
NASA ER-2 high altitude aircraft since October 2010. AirMSPI employs a photoelastic modulator-based polarimetric imaging technique to enable accurate measurements of the degree and angle of linear polarization in addition to spectral intensity. A description of the AirMSPI instrument and ground data processing approach is presented. Exam-ple images of clear, hazy, and cloudy scenes over the Pacific Ocean and California 10
land targets obtained during flights between 2010 and 2012 are shown, and quantita-tive interpretations of the data using vector radiaquantita-tive transfer theory and scene models are provided to highlight the instrument’s capabilities for determining aerosol and cloud microphysical properties and cloud 3-D spatial distributions. Sensitivity to parameters such as aerosol particle size distribution, ocean surface wind speed and direction, 15
cloud-top and cloud-base height, and cloud droplet size is discussed. AirMSPI repre-sents a major step toward realization of the type of imaging polarimeter envisioned to fly on NASA’s Aerosol-Cloud-Ecosystem (ACE) mission in the next decade.
1 Introduction
Sunlight, the fundamental source of energy that drives our climate system, is mod-20
ulated by spatially and temporally heterogeneous airborne particulate distributions. Aerosols affect Earth’s energy and water cycles through direct radiative forcing, the magnitude and sign of which depends on a complex interplay of aerosol optical prop-erties (optical depth, single scattering albedo, refractive index), shape and size dis-tribution, and the albedo of the underlying surface (Climate Change Science Pro-25
AMTD
6, 1717–1769, 2013The Airborne Multiangle SpectroPolarimetric
Imager (AirMSPI)
D. J. Diner et al.
Title Page
Abstract Introduction
Conclusions References
Tables Figures
◭ ◮
◭ ◮
Back Close
Full Screen / Esc
Printer-friendly Version Interactive Discussion
Discussion
P
a
per
|
Dis
cussion
P
a
per
|
Discussion
P
a
per
|
Discussio
n
P
a
per
|
Feichter, 2005). Due to the high albedo and prevalence of clouds, small changes in cloud cover can have major climate impacts. The physical complexity of the processes associated with cloud formation, growth, and dissipation make cloud feedbacks the largest source of uncertainty in our ability to accurately predict climate sensitivity to increased greenhouse gas concentrations (Randall et al., 2007).
5
To advance our understanding of the climate and environmental impacts of different types of aerosols and the interactions between aerosols and clouds, the US National Research Council (NRC) recommends a future Aerosol-Cloud-Ecosystem (ACE) mis-sion (NRC, 2007) with a high-accuracy, wide-swath, multiangle polarimetric imaging instrument as part of the core payload. We are developing the Multiangle SpectroPo-10
larimetric Imager (MSPI) as a candidate for ACE (Diner et al., 2007, 2010; Mahler et al., 2011a). Like its predecessor, the Multi-angle Imaging SpectroRadiometer (MISR) cur-rently flying on NASA’s Terra spacecraft (Diner et al., 1998a), MSPI is envisioned to observe the Earth at multiple view angles using a set of multispectral pushbroom cam-eras. Relative to MISR, new capabilities in MSPI will include ultraviolet and shortwave 15
infrared bands in addition to those in the visible and near-infrared, a wider field of view (hence more frequent global coverage), and polarimetric imaging in selected spectral bands (MISR, by design, is polarization insensitive).
Development of the MSPI instrument has proceeded via construction of a series of prototype cameras with progressively increasing spectral capability. The initial pro-20
totype, designated LabMSPI, was a single wavelength (660 nm) camera designed to demonstrate our dual photoelastic modulator (PEM)-based polarimetric imaging ap-proach. Example images and calibration results are presented in Diner et al. (2010). LabMSPI has since been upgraded to ultraviolet (UV)/visible/near-infrared (VNIR) op-eration and renamed GroundMSPI to distinguish it from its predecessor (Diner et al., 25
AMTD
6, 1717–1769, 2013The Airborne Multiangle SpectroPolarimetric
Imager (AirMSPI)
D. J. Diner et al.
Title Page
Abstract Introduction
Conclusions References
Tables Figures
◭ ◮
◭ ◮
Back Close
Full Screen / Esc
Printer-friendly Version Interactive Discussion
Discussion
P
a
per
|
Dis
cussion
P
a
per
|
Discussion
P
a
per
|
Discussio
n
P
a
per
intensity and polarization images, along with model results aimed at interpreting the observations. Concluding remarks are provided in Sect. 4.
2 AirMSPI instrument description
2.1 Optics
AirMSPI is an eight-band pushbroom camera, mounted on a gimbal to acquire multi-5
angular observations over a±67◦ along-track range. As in GroundMSPI, the AirMSPI
spectral bands are centered at 355, 380, 445, 470P, 555, 660P, 865P, and 935 nm. Those bands marked with the letter “P” provide polarimetric information. The 935-nm channel is an experimental band included to explore the possibility of retrieving col-umn water vapor abundance using multiangle observations. AirMSPI’s telescope has 10
an effective focal length of 29 mm and cross-track field of view of±15◦. Incoming light
is brought to a focus using a three-mirror f/5.6 anastigmatic, telecentric system of the same design as used in LabMSPI/GroundMSPI (Diner et al., 2010). To increase opti-cal throughput, particularly in the UV, AirMSPI employs redesigned mirror coatings. In addition to high reflectance, design goals for the coatings included low diattenuation 15
and low retardance (relative difference in reflectance and phase, respectively, for light polarized in perpendicular planes). Precision Asphere, Inc. fabricated the mirrors and Surface Optics Corporation applied the optical coatings. Over the entire UV-shortwave infrared (SWIR) spectral range, the measured diattenuation is<0.5 %, reflectance is >85 %, and retardance is<10◦. Because diattenuation is intrinsically low for the new 20
coating design, the diattenuation balancing approach used in GroundMSPI (Mahler et al., 2008) was not required and each mirror was identically coated.
2.2 Retardance modulator
AMTD
6, 1717–1769, 2013The Airborne Multiangle SpectroPolarimetric
Imager (AirMSPI)
D. J. Diner et al.
Title Page
Abstract Introduction
Conclusions References
Tables Figures
◭ ◮
◭ ◮
Back Close
Full Screen / Esc
Printer-friendly Version Interactive Discussion
Discussion
P
a
per
|
Dis
cussion
P
a
per
|
Discussion
P
a
per
|
Discussio
n
P
a
per
|
componentsQ(excess of horizontally over vertically polarized light) and U (excess of 45◦over 135◦polarized light) (Diner et al., 2007, 2010; Mahler et al., 2011a). This
os-cillating retardance is achieved by placing a pair of Hinds Instruments Series II/FS42 PEMs in the optical train. PEMs are fused silica plates coupled to quartz piezoelectric transducers that induce a rapidly oscillating retardance via the photoelastic effect. The 5
fast axes of the two PEMs are aligned and nominally parallel to the long dimension of the focal plane line arrays. The AirMSPI PEMs have resonant frequencies off1=42 060 andf2=42 037 Hz at 18◦C. These frequencies shift by about 2.6 Hz per 1◦C change in temperature, but the difference frequency∆f =f1−f2(23 Hz) is much less tempera-ture sensitive, changing by only 15 mHz◦C−1. The difference in resonant frequency of 10
the two PEMs generates a beat signal whose period defines the duration of an image frame (tframe=1/∆f =43.5 ms). This beat modulation is typically sampled 23 times per frame, and the time-varying signal is processed using the algorithm described in Diner et al. (2010) to retrieve Iand Q simultaneously from those pixels overlain by an ana-lyzer that transmits light polarized in an orientation parallel to the line arrays, andIand 15
U from those pixels overlain by a polarization analyzer oriented at 45◦ to this direc-tion.I is the first Stokes component (intensity). By virtue of this approach, the ratios q=Q/I andu=U/I are, to first order, insensitive to the absolute radiometric calibra-tion of a given pixel because both the numerator and denominator are determined from signals acquired by the same detector element. The degree of linear polariza-20
tion (DOLP) and angle of linear polarization (AOLP) derived from these ratios, equal to
p
q2+u2and 0.5 tan−1(u/q), respectively, are similarly insensitive to absolute
calibra-tion. To compensate for instrumental polarization aberrations (e.g. mirror diattenuation, imperfect retardance), a set of 10 polarimetric calibration coefficients is established for every pixel (Diner et al., 2010). These features enable the MSPI class of instruments to 25
meet the ACE DOLP uncertainty requirement of±0.005 (ACE Science Working Group,
AMTD
6, 1717–1769, 2013The Airborne Multiangle SpectroPolarimetric
Imager (AirMSPI)
D. J. Diner et al.
Title Page
Abstract Introduction
Conclusions References
Tables Figures
◭ ◮
◭ ◮
Back Close
Full Screen / Esc
Printer-friendly Version Interactive Discussion
Discussion
P
a
per
|
Dis
cussion
P
a
per
|
Discussion
P
a
per
|
Discussio
n
P
a
per
a polarizer is rotated in front of the camera, of±0.003 or better. Preliminary results for
AirMSPI show similar residuals.
Quarter-wave plates (QWPs) located in the optical path before and after the PEMs result in modulation of the two desired linear Stokes vector components,QandU. With-out the QWPs, the camera would be sensitive toU andV, the latter being the excess of 5
right-handed over left-handed circular polarization. SinceV is typically small for natural scenes (Plass et al., 1976; Kawata, 1978), measurement of this Stokes component is sacrificed in order to obtain sensitivity to bothQ and U. In the single-band LabMSPI camera, zero-order quartz QWPs were used. For GroundMSPI, these were replaced with commercial QWPs constructed from quartz and magnesium fluoride (MgF2). Cus-10
tom QWPs were designed and fabricated to meet the more stringent AirMSPI perfor-mance requirements (Mahler et al., 2011b). The design goal was to achieve retardance within±10◦ of 90◦ (one quarter wave) in the polarimetric bands and<0.1◦ retardance
change with 1◦C change in temperature. The use of a composite, three-element
re-tarder provides three degrees of freedom, two of which were designated for the shape 15
of the retardance curve and the third for athermalization. The three materials employed are quartz, MgF2, and sapphire. Karl Lambrecht Corporation assembled the AirMSPI compound retarders. Nominal retardance is 90◦, 92◦, and 86◦, respectively, at 470, 660, and 865 nm. Deviations of QWP performance from exact quarter-wave and the effect of finite spectral bandwidth are accounted for in the coefficients derived as part of the 20
polarimetric calibration process (Diner et al., 2010).
2.3 Focal plane spectropolarimetric filters
Nominal full width at half maximum (FWHM) bandpasses of AirMSPI’s eight spectral bands in order from UV to NIR are 29, 33, 38, 39, 29, 39, 38, and 50 nm, respectively. Intensity measurements in the near-UV are beneficial because most surfaces are dark 25
AMTD
6, 1717–1769, 2013The Airborne Multiangle SpectroPolarimetric
Imager (AirMSPI)
D. J. Diner et al.
Title Page
Abstract Introduction
Conclusions References
Tables Figures
◭ ◮
◭ ◮
Back Close
Full Screen / Esc
Printer-friendly Version Interactive Discussion
Discussion
P
a
per
|
Dis
cussion
P
a
per
|
Discussion
P
a
per
|
Discussio
n
P
a
per
|
for aerosol retrievals due to the dominance of polarization by the molecular atmosphere (Kalashnikova et al., 2011), so only intensity data are acquired in this spectral region. Visible and near-infrared intensity and polarization measurements provide sensitivity to particle size and complex refractive index. The longest-wavelength channel of AirMSPI is located in a water vapor absorption band.
5
To provide spectral and polarimetric selection for different rows of the photodetec-tor line arrays, the AirMSPI spectral filters were sliced into thin strips (80 µm wide by 17 mm long), bonded together, and polished. Materion Barr Precision Optics designed and fabricated this “butcher block” filter. High optical density black epoxy is used be-tween the spectral filters for stray light reduction. The assembly was bonded to a fused 10
silica substrate containing patterned wire-grid polarizers (WGPs) in the polarization channels. Moxtek, Inc. supplied the WGPs. Application of a cement bond to the WGPs results in reduced transmittance and polarization extinction ratio (ratio of transmittance of the polarization state aligned with polarizer to the transmittance for the orthogonal state) relative to their pre-bond values. The use of high-contrast WGP stock results 15
in post-bond transmittance exceeding 75 % and extinction ratios between 40 and 100, depending on wavelength. The extinction ratio determines the magnitude of the mod-ulation pattern from the PEMs, and is readily accounted for in instrument calibration. A Mueller Matrix Imaging Polarimeter (MMIP) at the University of Arizona was used for inspection and characterization of the spectropolarimetric filter components. Align-20
ment and bonding of the filter to the silicon complementary metal oxide semiconductor (Si-CMOS) imager was done at the Jet Propulsion Laboratory (JPL). The composite filter assembly is situated above the detector array in the camera focal plane. The pre-cision positioning equipment used to accomplish this step is able to ensure alignment to within±2 µm over the 17-mm length of the filter.
25
2.4 Focal plane detectors
AMTD
6, 1717–1769, 2013The Airborne Multiangle SpectroPolarimetric
Imager (AirMSPI)
D. J. Diner et al.
Title Page
Abstract Introduction
Conclusions References
Tables Figures
◭ ◮
◭ ◮
Back Close
Full Screen / Esc
Printer-friendly Version Interactive Discussion
Discussion
P
a
per
|
Dis
cussion
P
a
per
|
Discussion
P
a
per
|
Discussio
n
P
a
per
are sensitive to light in the UV/VNIR spectral range. Sixty-four lines on 16 µm spacing contain 1536 pixels with 9.5 µm (cross-track)×10 µm (along-track) apertures. Tower
Semiconductor, Ltd. fabricated the detector array. Top-level characteristics are shown in Table 1. Reset noise is minimized through the use of correlated double sampling (CDS), in which the values on all capacitors are digitized and read out at the start of 5
each integration interval and temporarily stored off-chip and then subtracted from the integrated values as they are read out. All 1536 pixels in a given row are integrated in parallel.
2.5 Electronics
AirMSPI electronic circuits were designed and built to meet the dual-PEM polarime-10
ter signal timing and phasing requirements outlined in Diner et al. (2007). Polarimetric accuracy is maximized by properly sampling the video signal and by synchronizing the sampling with the retardance modulation of the dual PEM. Each of the two AirM-SPI PEM controllers drives an all-digital phase locked loop (PLL). This enables the phase of each PEM to be available at all times. Synchronization to the high frequency 15
modulation and low beat frequency is accomplished by computing the sum and dif-ference of the two PEM phases. In GroundMSPI, the support electronics are divided between a Focal Plane Array (FPA) board and a Data Recovery Board (DRB) (Diner et al., 2012). For AirMSPI, these circuits were combined into a single focal plane con-trol and processing (FPCP) board that makes use of a Xilinx military-grade Virtex-5FXT 20
AMTD
6, 1717–1769, 2013The Airborne Multiangle SpectroPolarimetric
Imager (AirMSPI)
D. J. Diner et al.
Title Page
Abstract Introduction
Conclusions References
Tables Figures
◭ ◮
◭ ◮
Back Close
Full Screen / Esc
Printer-friendly Version Interactive Discussion
Discussion
P
a
per
|
Dis
cussion
P
a
per
|
Discussion
P
a
per
|
Discussio
n
P
a
per
|
2.6 Instrument housing
The AirMSPI housing reuses much of the hardware developed for its non-polarimetric precursor, AirMISR (Diner et al., 1998b). The camera is mounted on a gimbal to permit multi-angle imaging. Like AirMISR, the housing containing the AirMSPI gimbal assem-bly is mounted in the nose of the NASA high-altitude ER-2 aircraft. As shown in Fig. 1, 5
the aluminum cylinder assembly protrudes below the aircraft fuselage. A pressure box around the gimbal assembly maintains 276 hPa (4 psi) pressure inside the nose com-partment, and the sensor head experiences outside ambient pressure (∼48 hPa or
0.7 psi at 20 km altitude). The camera and rotary stage cabling is led out through a set of pressure bulkhead connectors to the instrument electronics rack. The ER-2 supplies 10
28 VDC power to the instrument. The instrument draws∼181 W of power during data
acquisition, with an additional 70 W worth of independent heaters distributed through the camera volume to ensure that the instrument temperature does not drop below the dew point during aircraft descent. Re-engineering of the electronics and data system layout reduced instrument mass from∼170 kg for AirMISR to 86 kg for AirMSPI.
15
2.7 Gimbal Drive
In transitioning from AirMISR to AirMSPI, the gimbal and motor drive were upgraded to a system (Aerotech WaferMax T-RE2048AS) having much higher torque and a pre-cision angle encoder, enabling more flexible operating and camera pointing modes (AirMISR acquired imagery at only a predefined set of nine view angles). The gimbal 20
enables image acquisition at a programmable set of along-track angles between±67◦.
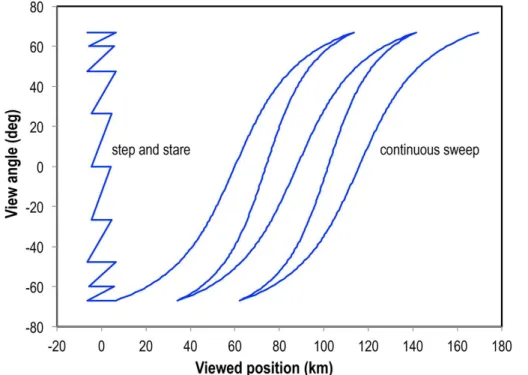
While it is possible to acquire observations at larger view angles, aircraft attitude fluc-tuations significantly degrade the quality of the imagery. Sequences to be used during a given flight are pre-programmed on the ground, and are constructed from two basic operating modes, illustrated in Fig. 2. In “step and stare” mode, the camera is pointed 25
AMTD
6, 1717–1769, 2013The Airborne Multiangle SpectroPolarimetric
Imager (AirMSPI)
D. J. Diner et al.
Title Page
Abstract Introduction
Conclusions References
Tables Figures
◭ ◮
◭ ◮
Back Close
Full Screen / Esc
Printer-friendly Version Interactive Discussion
Discussion
P
a
per
|
Dis
cussion
P
a
per
|
Discussion
P
a
per
|
Discussio
n
P
a
per
view and then stepping aftward as the aircraft flies downtrack. The camera then slews forward and the sequence repeats for the next target, about 100 km downtrack. This mode is most useful where the highest possible spatial resolution (∼10 m) is desired.
Target area is∼10.6 km cross-track (at nadir) ×9.5 km along-track for a nominal
se-quence containing nine view angles. An odd number of “stares” is typically selected so 5
that the images are acquired for a set of symmetric view angles forward and aftward of the nadir (0◦) view angle. The along-track sample spacing (8 m at any angle) is set by the frame time and aircraft speed. In “continuous sweep” mode, the gimbal slews back and forth. Because the gimbal moves continuously, spatial resolution is reduced to∼55 m due to smear. However, this mode enables better spatial coverage of
multi-10
layered cloud fields. AirMSPI’s actuator permits the slew rate to vary as a continuous function of angle in order to keep the amount of image smear constant at all angles.
A variant of the first operating mode, dubbed “step and pseudostare,” is made pos-sible by the programmable nature of the AirMSPI actuator. During each of the “stare” portions of the sequence, the gimbal drifts forward at a slow rate (between a few hun-15
dredths and a few tenths of a degree per second, depending on view angle), enabling extension of the along-track length of the observed target areas. For example, without the drift, overlap imagery of nine multi-angle views can be obtained with a 9.5 km target length, as noted above. Allowing a small amount of forward drift in the view angle dur-ing image acquisition introduces only 2 m of along-track smear and extends the target 20
length to 11.5 km. This mode has been successfully tested in flight. Acquisition of step and pseudostare imagery at up to 31 view angles has been demonstrated.
2.8 On-board polarization monitoring and control systems
Two specialized pieces of equipment for verifying and controlling the performance of the polarimetric measurement approach during in-flight operations of AirMSPI were 25
AMTD
6, 1717–1769, 2013The Airborne Multiangle SpectroPolarimetric
Imager (AirMSPI)
D. J. Diner et al.
Title Page
Abstract Introduction
Conclusions References
Tables Figures
◭ ◮
◭ ◮
Back Close
Full Screen / Esc
Printer-friendly Version Interactive Discussion
Discussion
P
a
per
|
Dis
cussion
P
a
per
|
Discussion
P
a
per
|
Discussio
n
P
a
per
|
though it is still possible that the retardance may shift somewhat due to temperature changes during flight. Illumination of the camera with light polarized at 0◦, 15◦, 60◦,
and 75◦provides a useful means for determining the deviations of the polarization cal-ibration coefficients from their nominal values as a result of QWP retardance shifts. A source of light linearly polarized in these different orientations was designed and 5
constructed for the AirMSPI camera to view in flight. This source consists of nine light-emitting diodes (LEDs), three each at the AirMSPI polarimetric wavelengths. These illuminate a plastic diffuser. In front of this source, sheet polarizers at the required orientations were installed, and this assembly was integrated into the AirMSPI instru-ment. The validator is viewed by rotating the gimbal forward to an angle of 87◦. The 10
LEDs flash for 1 s every 10 s so that dark data can be collected between the illumina-tion flashes. Validator data have been used to evaluate the in-flight PEM retardance and phase control system, known as the “optical probe.”
The optical probe sends a beam of light through the PEMs to monitor their retar-dances and phases. The beam traverses the PEMs in an area not used for acquisition 15
of Earth imagery. The light source in the optical probe is a 760 nm LED, and a combi-nation of two linear polarizers and a QWP generates the required optical signals. The digitized output is synchronously demodulated and the system generates error signals showing how far the PEM retardances and phases are from their desired values. Four quantities are determined: the mean retardance of the two PEMs, the difference in re-20
tardance between the two PEMs, the phase of the low-frequency beat pattern, and the phase of the high-frequency oscillation. The feedback control system then adjusts the PEM parameters to drive the error signals to zero. The same Virtex-5FXT FPGA that operates the rest of the AirMSPI camera performs probe data acquisition and process-ing. During an AirMSPI flight on 31 August 2011, the probe was operated open loop 25
AMTD
6, 1717–1769, 2013The Airborne Multiangle SpectroPolarimetric
Imager (AirMSPI)
D. J. Diner et al.
Title Page
Abstract Introduction
Conclusions References
Tables Figures
◭ ◮
◭ ◮
Back Close
Full Screen / Esc
Printer-friendly Version Interactive Discussion
Discussion
P
a
per
|
Dis
cussion
P
a
per
|
Discussion
P
a
per
|
Discussio
n
P
a
per
demonstrated the ability to control the PEM retardance and phase parameters to within a fraction of 1 mrad, keeping contributions to the overall DOLP uncertainty budget at <0.001.
2.9 Data acquisition and ground processing
Flight control software consists of data acquisition routines, gimbal operation instruc-5
tions, and a main program. A Condor CEI-200 two-channel ARINC-429 board in the AirMSPI on-board computer receives ER-2 attitude and position data. The original Air-MISR on-board data system was upgraded by replacing the hard disks with solid state memory and adding a CameraLink data collection system. An IO Industries frame grab-ber and disk shuttle packs are used. The current 4x256GB Serial Advanced Technol-10
ogy Attachment (SATA) solid-state drives (SSDs) provide∼1 TB of memory, enabling
storage of ∼10 h of data. The SSDs are exchangeable after a flight within minutes,
allowing the instrument to be immediately flight-ready for a follow-up mission.
Accurate position and attitude data are required for georectification and co-registration of the different channels of AirMSPI data. The camera acquires image data 15
in pushbroom fashion (one image line at a time for each channel). Image lines (frames) are acquired at a rate of 23 Hz. To georectify and co-register the acquired imagery with subpixel accuracy, aircraft position and attitude data are used to define the viewing ge-ometry of each image line. AirMSPI’s ARINC-429 board receives attitude and position data at 64 Hz from the ER-2’s inertial navigation/global positioning system (INS/GPS) 20
to meet ground data processing requirements for image navigation (Jovanovic et al., 2001, 2012).
Data product generation makes use of the AirMSPI Data Processing System (AMDPS), which employs software developed for AirMISR (Jovanovic et al., 2001) and MISR (Jovanovic et al., 2002). Level 1A1 processing reformats the raw AirMSPI output 25
AMTD
6, 1717–1769, 2013The Airborne Multiangle SpectroPolarimetric
Imager (AirMSPI)
D. J. Diner et al.
Title Page
Abstract Introduction
Conclusions References
Tables Figures
◭ ◮
◭ ◮
Back Close
Full Screen / Esc
Printer-friendly Version Interactive Discussion
Discussion
P
a
per
|
Dis
cussion
P
a
per
|
Discussion
P
a
per
|
Discussio
n
P
a
per
|
and applies pixel-by-pixel radiometric gain coefficients. Level 1B2 spatially co-registers the channels, maps the observations to the surface terrain, corrects for residual in-strument polarization, and derives DOLP and AOLP relative to both the view meridian plane (the plane containing the view vector and the surface normal) and the scattering plane (the plane containing the view vector and the solar illumination vector).
5
3 AirMSPI flight imagery
3.1 Data product examples
The maiden flight of AirMSPI took place on 7 October 2010 and demonstrated suc-cessful operation of the dual-PEM polarimetric imaging technology in the high-altitude airborne flight environment (Diner et al., 2011). Figure 3 shows examples of georecti-10
fied nadir imagery of the area near Palmdale, CA, acquired during this flight. Compared with the natural color image (upper left), the lower surface contrast and bluish hue in the image generated from the shortest wavelength bands (upper right) result from the increase in atmospheric path radiance in the blue and UV. In the latter image, the dis-colored, darker stripes are parallel to the flight direction and are due to imperfections in 15
the spectral filters, leading to inaccurate radiometric calibration. A correction algorithm is currently under development. The lower left image shows intensity at 470, 660, and 865 nm. Vegetated areas appear red due to the high reflectance of leaves in the NIR. The lower right image is DOLP at 470, 660, and 865 nm. The highly polarized square features in the lower left portion of the image are wastewater treatment ponds at the 20
Palmdale Water Reclamation Plant.
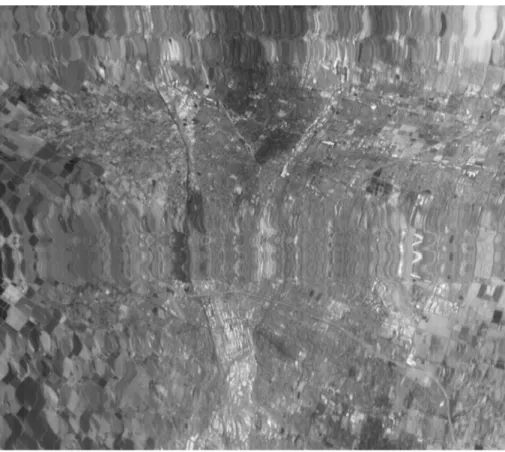
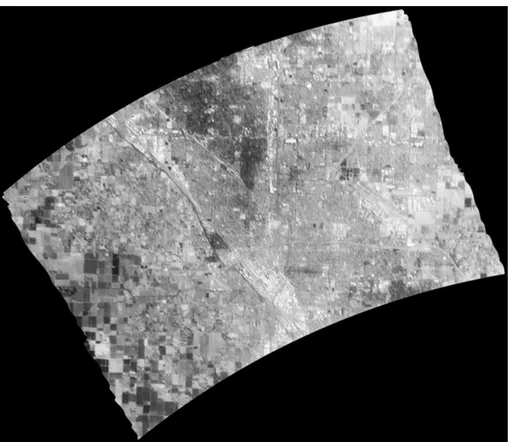
Figures 4 and 5 demonstrate the effectiveness of the AirMSPI georectification pro-cess. Figure 4 is a Level 1B1 660-nm intensity image acquired on 6 January 2012 over Fresno, CA at a view angle of 67◦. Distortions due to aircraft attitude fluctuations are apparent in the image. Imagery at this oblique angle is most sensitive to variations in 25
AMTD
6, 1717–1769, 2013The Airborne Multiangle SpectroPolarimetric
Imager (AirMSPI)
D. J. Diner et al.
Title Page
Abstract Introduction
Conclusions References
Tables Figures
◭ ◮
◭ ◮
Back Close
Full Screen / Esc
Printer-friendly Version Interactive Discussion
Discussion
P
a
per
|
Dis
cussion
P
a
per
|
Discussion
P
a
per
|
Discussio
n
P
a
per
Automated data processing makes use of aircraft navigation information to correct for image distortions. In general, the navigation information is used in conjunction with any available ground control and multi-image tie points to establish and account for ab-solute orientation of the camera to the platform frame of reference and potential time dependent drift (Jovanovic et al., 2001, 2012).
5
Figure 6 shows examples of the AirMSPI image products generated by the AMDPS. The data shown are from a flight over the Ports of Los Angeles and Long Beach on 26 October 2010. The wavelength is 865 nm and the view angle is 24.6◦ aftward of
nadir as the ER-2 was flying on a heading of ∼11◦ east of north. Solar zenith and
azimuth angles were 46.8◦and 350.3◦, respectively (azimuth angles are defined as the 10
direction of photon travel relative to local north). The data have been map-projected to a 10 m grid, and the area shown measures 8.7 km×5.7 km. Each of the images was
individually contrast enhanced to highlight detail, except thatQandU had an identical stretch applied to preserve their relative magnitudes. In the intensity image, the water is somewhat darker than the land and exhibits a gradient toward the lower right portion 15
of the image where specular reflection offthe water (sunglint) becomes brighter. Boat wakes and surface waves are apparent in the water. Sunglint off the ocean surface results in high values of DOLP (up to ∼0.70). AOLP with respect to the scattering
plane takes on values close to 90◦, as expected for a scene dominated by Fresnel surface reflection and single scattering. The “Q,U” images are false color composites 20
in whichQ andU are displayed in shades of red and cyan, respectively. Two versions are shown, one in whichQandU are defined with respect to the view meridian plane, the other in which they are defined with respect to the scattering plane. In addition to I, Q, U and the derived products DOLP and AOLP, the subframe sampling also enables determination of the linear gradient in intensity during the course of an image 25
AMTD
6, 1717–1769, 2013The Airborne Multiangle SpectroPolarimetric
Imager (AirMSPI)
D. J. Diner et al.
Title Page
Abstract Introduction
Conclusions References
Tables Figures
◭ ◮
◭ ◮
Back Close
Full Screen / Esc
Printer-friendly Version Interactive Discussion
Discussion
P
a
per
|
Dis
cussion
P
a
per
|
Discussion
P
a
per
|
Discussio
n
P
a
per
|
3.2 Clear sky observations over ocean
Theoretical sensitivity studies (e.g. Hasekamp and Landgraf, 2007; Lebsock et al., 2007) show that polarization and intensity data provide complementary constraints on particle properties. The Decadal Survey (NRC, 2007) notes that: “A combination of multiangle, multispectral, and polarization capabilities ... provides the greatest poten-5
tial to monitor aerosols from space.” Airborne Research Scanning Polarimeter (RSP) data (Cairns et al., 2003) show that multiangle (non-imaging) polarimetry distinguishes aerosols that otherwise appear similar in intensity, through improved sensitivity to ef-fective particle radius, size variance, and refractive index (Chowdhary et al., 2001, 2002; Mishchenko and Travis, 1997) as well as water-leaving radiance (Chowdhary 10
et al., 2012). Hasekamp et al. (2011) applied a coupled ocean-atmosphere algorithm to Polarization and Directionality of Earth’s Reflectances (POLDER) satellite data to retrieve chlorophylla concentration, surface wind velocity, and fractional foam cover-age, along with optical and microphysical parameters describing a bimodal aerosol model. The inclusion of polarization reduced both the bias and spread of aerosol op-15
tical depth (AOD) and Angstrom exponent (AE) retrievals relative to Aerosol Robotic Network (AERONET) data (Holben et al., 1998), with the most significant improvement occurring in AE, most likely due to increased sensitivity to particle size. An intercom-parison of satellite aerosol retrieval algorithms suggests that supplementing multiangle intensity observations with polarimetric measurements increases sensitivity to complex 20
refractive index (Kokhanovsky et al., 2010).
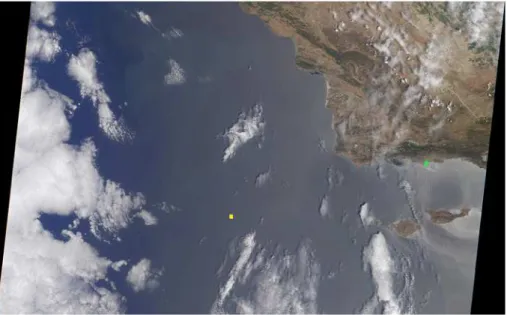
A near-simultaneous overpass of a patch of clear sky over ocean by both MISR on the Terra satellite and AirMSPI on the ER-2 on 19 July 2012 supports many of these arguments. Figure 7 shows a MISR natural color, nadir image acquired at 11:58 a.m. PDT (1858 UTC), within which is the area observed by AirMSPI (denoted by the yellow 25
AMTD
6, 1717–1769, 2013The Airborne Multiangle SpectroPolarimetric
Imager (AirMSPI)
D. J. Diner et al.
Title Page
Abstract Introduction
Conclusions References
Tables Figures
◭ ◮
◭ ◮
Back Close
Full Screen / Esc
Printer-friendly Version Interactive Discussion
Discussion
P
a
per
|
Dis
cussion
P
a
per
|
Discussion
P
a
per
|
Discussio
n
P
a
per
standard V22 aerosol product (Kahn et al., 2010) reported low AOD; two of the 74 aerosol models in the MISR database that passed the goodness-of-fit metrics were Mixture 11, consisting of a single lognormal size distribution having median radius of 0.06 µm and standard deviation of lognormal radius distribution=0.53, and Mixture 8, consisting of 40 % (fractional AOD at 558 nm) of a fine mode (median radius=0.03 µm, 5
standard deviation of lognormal radius distribution=0.50) and 60 % of a coarse mode (median radius=1.00 µm, standard deviation of lognormal radius distribution=0.64). All particles are nonabsorbing and have a spectrally invariant refractive index of 1.45. The retrieved AODs at 558 nm for Mixtures 11 and 8 were 0.077 and 0.078, respec-tively. The nearest AERONET site (green marker, ∼170 km away) is on the coast at
10
the University of California, Santa Barbara (UCSB). At 12:06 p.m. PDT (19:06 UTC) the Level 1.5 AERONET AOD, interpolated to 558 nm, is 0.083. Note that Level 2.0 AERONET data are currently not available for this site on this date.
AirMSPI data near the center of each multiangle image were averaged over a patch size of∼100 m×100 m. Standard deviations of the observations were also computed.
15
The absolute radiometric calibration of the AirMSPI imagery was based on prelimi-nary gain coefficients derived from laboratory observations of the MISR 1.65 m inte-grating sphere (Bruegge et al., 1998) in 2011, using an Analytical Spectral Devices spectrometer as the reference standard. Significant time has passed since that cal-ibration was performed. In addition, the radiant output of the sphere in the UV and 20
short wavelength blue channels did not cover enough of the AirMSPI dynamic range to ensure accurate gain coefficient determination in these bands. Consequently, the MISR integrating sphere was recently sent to the manufacturer (Labsphere, Inc.), re-coated, and outfitted with Luxim light emitting plasma (LEP) lamps to improve light levels, particularly at the short wavelengths. In addition, measurements of the per-pixel 25
AMTD
6, 1717–1769, 2013The Airborne Multiangle SpectroPolarimetric
Imager (AirMSPI)
D. J. Diner et al.
Title Page
Abstract Introduction
Conclusions References
Tables Figures
◭ ◮
◭ ◮
Back Close
Full Screen / Esc
Printer-friendly Version Interactive Discussion
Discussion
P
a
per
|
Dis
cussion
P
a
per
|
Discussion
P
a
per
|
Discussio
n
P
a
per
|
yet complete, the near-simultaneous, well-calibrated MISR observations were used to achieve a vicarious calibration of the AirMSPI flight data.
Under the assumption that ambient conditions varied little between the MISR and AirMSPI overpasses, the MISR Mixture 11 aerosol model was used to predict up-welling radiances in the AirMSPI spectral bands, taking into account the differences 5
in view and illumination geometry between the two instruments and the 20 km flight altitude of the ER-2. A vector Markov chain radiative transfer code (Xu et al., 2011) was used to perform the radiative transfer computations. Because this model does not currently account for absorption by water vapor, the 935 nm channel was not included in the analysis. Rayleigh scattering optical depth was based on the US standard at-10
mosphere. Keeping the aerosol parameters supplied by MISR fixed, adjustments to the laboratory-derived radiometric gain corrections were determined along with wind speed and direction parameters of the anisotropic Cox–Munk model (Cox and Munk, 1956) to fit the multiangle, multispectral AirMSPI intensity and polarization data simul-taneously. This ocean reflectance model assumes the surface to be comprised of an 15
array of tilted microfacets reflecting according to Fresnel’s equations and uses a gen-eralized Gaussian slope distribution parameterized by the wind direction relative to the solar azimuthal plane and the root-mean-square slope components in the upwind and crosswind directions,σuandσc, respectively, which depend on wind speed. To account for shadowing, the shadow function derived for the isotropic Gaussian facet distribu-20
tion (Tsang et al., 1985 and references therein) is adopted here, withσ2 replaced by σuσc. The spectral variation in water refractive index is included in the model. As the AirMSPI flight line was close to the principal plane, the anisotropic Cox–Munk model and variation in the sunglint magnitude with view angle enabled retrieval of the sur-face wind vector. Water-leaving radiance was taken to be zero at 660 and 865 nm, 25
AMTD
6, 1717–1769, 2013The Airborne Multiangle SpectroPolarimetric
Imager (AirMSPI)
D. J. Diner et al.
Title Page
Abstract Introduction
Conclusions References
Tables Figures
◭ ◮
◭ ◮
Back Close
Full Screen / Esc
Printer-friendly Version Interactive Discussion
Discussion
P
a
per
|
Dis
cussion
P
a
per
|
Discussion
P
a
per
|
Discussio
n
P
a
per
of 314 Dobson units, the same value used in the MISR aerosol retrievals, with the as-sumption that only 20 % of the ozone column-integrated optical depth is situated below 20 km. Because AirMSPI determines DOLP as a relative measurement independent of instrument radiometric gain, polarized intensities in the 470, 660, and 865 nm bands were calculated by taking the calibration-adjusted total intensities and multiplying by 5
DOLP.
Comparisons between bidirectional reflectance factors (BRF) determined from the AirMSPI observations and the atmosphere-ocean model are shown in Fig. 9, compar-isons between observed and modeled polarized BRF (pBRF) are shown in Fig. 10, and comparisons between observed and modeled DOLP are shown in Fig. 11. Agreement 10
is very good. Further improvements to the fit are likely possible by refining the aerosol model. For example, in Fig. 12 the MISR monomodal aerosol Mixture 11 is replaced with the bimodal Mixture 8, with all other scene parameters held constant. This figure shows that the bimodal model improves the agreement with observed DOLP at the oblique view zenith angles, and this mixture also provides a better agreement with the 15
MISR observations based on the V22 goodness-of-fit metrics. However, the appear-ance of a bow resulting from the large particle component of Mixture 8 is inconsistent with the AirMSPI DOLP measurements, indicating that the assumed particle size of the coarse mode in the MISR lookup table is too large. Although aerosol type distin-guishability in the current globally operational retrieval algorithm for MISR is reduced 20
at low (<0.15) AOD (Kahn et al., 2010), the AirMSPI data show that the addition of polarimetric observations aids in constraining particle microphysical properties, even when aerosol loading is small.
The surface wind speed derived from modeling of the AirMSPI data is 6.7 m s−1. This is a reasonable value, as the monthly mean wind speed for this location and time of 25
year used to guide MISR aerosol retrievals is 8.3 m s−1, derived from Special Sensor
AMTD
6, 1717–1769, 2013The Airborne Multiangle SpectroPolarimetric
Imager (AirMSPI)
D. J. Diner et al.
Title Page
Abstract Introduction
Conclusions References
Tables Figures
◭ ◮
◭ ◮
Back Close
Full Screen / Esc
Printer-friendly Version Interactive Discussion
Discussion
P
a
per
|
Dis
cussion
P
a
per
|
Discussion
P
a
per
|
Discussio
n
P
a
per
|
imagery (see Fig. 8). The visually estimated normal to the oceanic wave fronts makes a clockwise angle of about 24◦ to the flight heading, which is 325◦ from north. The
average solar azimuth of 320◦ during the AirMSPI image sequence therefore yields a wind direction of 29◦ from solar meridian plane. The value derived using the Cox– Munk model to fit the angular sunglint pattern is in very good agreement with this 5
result.
3.3 Hazy sky observations over land
Several observational studies have demonstrated the benefits of combining multiangle intensity observations with polarimetry for constraining surface reflectance properties and aerosol characteristics over land (e.g. Waquet et al., 2009; Tanr ´e et al., 2011). 10
Dubovik et al. (2011) developed a statistically optimized algorithm for retrieving aerosol properties and surface bidirectional reflectance parameters simultaneously, and suc-cessfully applied the methodology to POLDER observations over Africa. While a full aerosol retrieval is beyond the scope of this paper, a scene model was used to ver-ify that the AirMSPI instrument is performing quantitatively according to expectations, 15
much as was done with the Pacific Ocean scene described above. AirMSPI flew over the Fresno, CA AERONET site on 6 January 2012 (time of nadir view= 12:23 p.m. PST, 20:23 UTC), providing an opportunity for quantitative examination of the instru-ment’s data. The atmosphere was quite hazy on this date (AERONET reported a mid-visible AOD of 0.49). Figure 13 shows nadir images acquired during that overpass. The 20
location of the Fresno AERONET site is marked. The calibration adjustments derived from the 19 July 2012 vicarious calibration against MISR were applied to the data. Due to the high spatial resolution of AirMSPI, adjacency effects ensure that diffuse transmission of surface-leaving radiation effectively averages over an area many times larger than the pixel size. The model used here assumes that the diffusely transmitted 25
AMTD
6, 1717–1769, 2013The Airborne Multiangle SpectroPolarimetric
Imager (AirMSPI)
D. J. Diner et al.
Title Page
Abstract Introduction
Conclusions References
Tables Figures
◭ ◮
◭ ◮
Back Close
Full Screen / Esc
Printer-friendly Version Interactive Discussion
Discussion
P
a
per
|
Dis
cussion
P
a
per
|
Discussion
P
a
per
|
Discussio
n
P
a
per
for two 100 m×100 m patches of ground: a pond located about 2.3 km to the southeast
of the AERONET site, and a residential area 1.3 km to the northeast. These sites are marked in Fig. 13.
To model the AirMSPI data, the spectral AOD and aerosol size distribution derived from AERONET direct Sun and sky radiance data were used. The AERONET-derived 5
size distribution is bimodal, with the fine mode accounting for 96 % of the optical depth at 500 nm, according to the spectral deconvolution algorithm used in AERONET pro-cessing (O’Neill et al., 2003). Fitted lognormal size distribution parameters for the fine mode are median radius=0.14 µm, standard deviation of lognormal radius distribution
=0.51, and for the coarse mode are median radius=1.16 µm, standard deviation of 10
lognormal radius distribution=0.59. However, the actual size distribution (not the fit-ted curve) was used in our model. Based on AERONET results, the particle refractive index was taken to be 1.415 – 0.004i, independent of wavelength. This corresponds to a mid-visible single-scattering albedo of about 0.97. Absorption by ozone was handled in the same manner as for the ocean scene, described above.
15
The surface model is similar to that used by Diner et al. (2012) to model GroundM-SPI data. The BRDF is taken to be the sum of a depolarizing modified Rahman-Pinty-Verstraete (mRPV) model (Martonchik et al., 1998) and a polarizing term generated by an array of Fresnel-reflecting microfacets. The refractive index of the surface,nr,surf, is taken to be 1.5; however, in contrast to the ocean model, a wavelength-independent 20
factor,ζ, multiplies the magnitude of the microfacet contribution to the BRDF to com-pensate for a possibly incorrect choice ofnr,surf. An isotropic Gaussian distribution for the facet orientations is assumed, with root-mean-square slopeσ. The shadowing term of Tsang et al. (1985) was included. Keeping the parameters of the aerosol model fixed, the degrees of freedom of the scene model are the surface parameters ζ, σ, 25
the wavelength-dependent coefficients of the mRPV function,aλ, and the
AMTD
6, 1717–1769, 2013The Airborne Multiangle SpectroPolarimetric
Imager (AirMSPI)
D. J. Diner et al.
Title Page
Abstract Introduction
Conclusions References
Tables Figures
◭ ◮
◭ ◮
Back Close
Full Screen / Esc
Printer-friendly Version Interactive Discussion
Discussion
P
a
per
|
Dis
cussion
P
a
per
|
Discussion
P
a
per
|
Discussio
n
P
a
per
|
BRF and pBRF data simultaneously (90 measurements, corresponding to nine angles, seven bands for BRF and nine angles, three bands for polarized BRF).
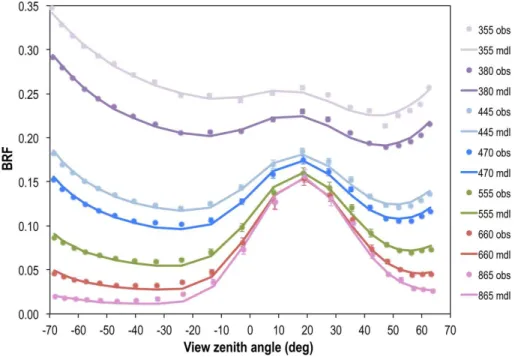
Comparisons of modeled and measured BRF and pBRF are given in Figs. 14 (pond) and 15 (residential area), respectively. “Channel” refers to a particular combination of view zenith angle and spectral band. The fitted parameters are shown in Table 2. 5
The negligible values of aλ at 355 nm indicate that the surface has negligible effect on the top-of-atmosphere measurements, either because the surface is intrinsically very dark or because the atmosphere is so hazy (Rayleigh + aerosol optical depth
∼
=1.1) at this wavelength. For the residential area, aλ more than doubles at 865 nm compared with the mid-visible due to the presence of vegetation (trees and lawns). 10
The negative value ofbfor the vegetation is consistent with the expectation that areas with vertical structures (in this case, vegetation and buildings) cast shadows in the forward scattering direction and are brighter in backscatter. With a few exceptions, the model reproduces the data very well. While adjustments to the aerosol properties could conceivably improve the fits, this analysis again shows that the AirMSPI instrument is 15
providing sensible data.
3.4 Cloud observations
The spatial context and coverage afforded by AirMSPI makes it possible to disentangle cloud effects from scattering by aerosols, account for variations in cloud polarization with scattering angle (e.g. Goloub et al., 1994; Alexandrov et al., 2012), and deal with 20
both geometric parallax (apparent along-track shift in cloud position due to altitude above the surface) and true cloud motion. Techniques developed for MISR make au-tomated retrieval of cloud-top heights (CTH) and cloud motion vector (CMV) winds from multiangle stereo a mature technology (Moroney et al., 2002). Unlike infrared methods, stereo is insensitive to the atmospheric temperature profile and radiomet-25
AMTD
6, 1717–1769, 2013The Airborne Multiangle SpectroPolarimetric
Imager (AirMSPI)
D. J. Diner et al.
Title Page
Abstract Introduction
Conclusions References
Tables Figures
◭ ◮
◭ ◮
Back Close
Full Screen / Esc
Printer-friendly Version Interactive Discussion
Discussion
P
a
per
|
Dis
cussion
P
a
per
|
Discussion
P
a
per
|
Discussio
n
P
a
per
for boundary layer height (Karlsson et al., 2010). Adaptation of MISR stereo retrieval software for use with AirMSPI is planned. The use of oblique view angle stereo has been shown to improve the detectability and height determination of thin cirrus (Prasad and Davies, 2012), and AirMSPI can capitalize on this technique as well.
To demonstrate the stereo information content of AirMSPI imagery, Fig. 16 is a stereo 5
anaglyph of San Francisco generated using AirMSPI imagery acquired on 6 January 2012 between 01:08 and 01:09 p.m. PST (21:08 and 21:09 UTC) at two view angles (approximately 4◦ forward and 28◦ aftward of nadir). The near-nadir 660 nm intensi-ties are displayed in red and the 445 and 555 nm intensiintensi-ties from the aftward view are displayed in blue and green. The image has been rotated 38◦ counterclockwise 10
to align the flight direction with the horizontal axis, and is best viewed using red/cyan glasses with the red filter over the left eye to get a 3-D effect. North is toward the upper left. The long, dark rectangular feature below center is Golden Gate Park, and the Golden Gate Bridge is visible to the left of center. Topographic relief is apparent within the city and in the terrain to the north of the Golden Gate Bridge. The largest 15
stereo parallax (displacement) is observed over the clouds, which appear with a red-dish tinge along the right-hand edge of the image, and in cyan in the aftward view. Estimates of the cloud parallax from this image pair and also between the 28◦ and 48◦ aftward views places the cloud heights between 7 and 8 km. National Weather Service (NWS) radiosonde soundings from Oakland, CA at 00:00 UTC on 7 January 20
2012, obtained from the University of Wyoming Department of Atmospheric Science website (http://weather.uwyo.edu/upperair/sounding.html), shows the air temperature to be−31.2◦C at an altitude of 7.6 km, consistent with these being primarily ice
(cir-rus) clouds, as evident from their wispy structure and optically thin appearance through which the surface can be seen.
25
AMTD
6, 1717–1769, 2013The Airborne Multiangle SpectroPolarimetric
Imager (AirMSPI)
D. J. Diner et al.
Title Page
Abstract Introduction
Conclusions References
Tables Figures
◭ ◮
◭ ◮
Back Close
Full Screen / Esc
Printer-friendly Version Interactive Discussion
Discussion
P
a
per
|
Dis
cussion
P
a
per
|
Discussion
P
a
per
|
Discussio
n
P
a
per
|
shows AirMSPI images of clouds over the Pacific Ocean acquired on 7 October 2010 at ∼12:25 p.m. PDT (19:25 UTC). The left image is 865 nm intensity at a
forward-looking view angle of 46◦, showing cumulus clouds and the fainter reflections of the cloud bases in the water. At this view angle, clouds have low polarization and appear dark (right image), with DOLP as low as 0.03. The cloud reflections in the water are 5
the most polarized features, with DOLP as high as 0.80. When attempting to retrieve aerosol information from remotely sensed data over water, resolving such features may be necessary to ensure that the observations are uncontaminated either by clouds or their reflections. For studies of the clouds themselves, retrieval of base height is valu-able because it is a function of the thermodynamic structure and moisture content of 10
the boundary layer (Wood, 2007), and determines the rate at which the cloud emits longwave radiation toward the surface. The cartoon in Fig. 17 shows how the displace-ment between an off-nadir image of a cloud and its reflection gives an estimate of base height. Measurements of the AirMSPI imagery imply a cloud base altitude of about 700 m. NWS radiosonde soundings from the San Diego, CA station at 00:00 UTC on 15
8 October 2010 show a steep increase in relative humidity centered at 610 m above sea level. The retrieved height is also generally consistent with the results of Lin et al. (2009), who report average cloud base heights of 430 m in the summer and 950 m in the winter for clouds offthe California coast.
Analyses of data from the POLDER satellite instruments have shown that polarime-20
try at scattering angles corresponding to supernumerary cloudbows is sensitive to the mean and dispersion of cloud droplet size (Br ´eon and Goloub, 1998; Br ´eon and Doutriaux-Boucher, 2005). The primary cloudbow, supernumerary bows, and glory have also been observed in high-resolution AirMSPI imagery mapped to a 25 m grid (by comparison, POLDER resolution is about 6 km). Figure 18 shows AirMSPI intensity 25
AMTD
6, 1717–1769, 2013The Airborne Multiangle SpectroPolarimetric
Imager (AirMSPI)
D. J. Diner et al.
Title Page
Abstract Introduction
Conclusions References
Tables Figures
◭ ◮
◭ ◮
Back Close
Full Screen / Esc
Printer-friendly Version Interactive Discussion
Discussion
P
a
per
|
Dis
cussion
P
a
per
|
Discussion
P
a
per
|
Discussio
n
P
a
per
are 470, 660, and 865 nm composites. The glory appears near scattering angle,Ω, of 180◦ (Sun directly behind the instrument), andΩdecreases systematically away from this point. In polarized light, the clouds appear dark (low DOLP) atΩ<140◦, and DOLP increases significantly within the spectrally neutral cloudbow nearΩ∼143◦. The DOLP
image shows supernumerary arcs at larger scattering angles. These colorful features 5
are due to spectrally distinct fringes resulting from interference of light waves within the spherical cloud droplets. Quantitative analysis of the supernumerary bow data is shown in Fig. 19, following the single-scattering analysis method of Br ´eon and Goloub (1998). To facilitate the application of single-scattering theory, only measurements near the principal plane were used, in which caseU is close to zero, even in the presence 10
of multiple scattering. TheQobservations at wavelengthλwere analyzed according to the following equation:
Qobs,λ=
µ0E0λ
4π(µ+µ0)
P12,λ(Ω)e −τR,λ
1
µ+µ10
+P12,Ray(Ω)
1−e−τR,λ
1
µ+µ10
·e−τozone,λ
0.2
µ+µ10
(1) 15
whereE0λ is the solar spectral irradiance; µ and µ0 are cosines of the view and so-lar zenith angles, respectively;τR,λ is the Rayleigh optical depth above the cloud top,
assumed to be at 1 km altitude; andτozone,λ is a climatological estimate of the ozone
optical depth, with the factor of 0.2 in the exponent resulting from the assumption that only 20 % of the ozone column-integrated optical depth is situated below the aircraft 20
altitude. The cloud is assumed to be optically thick.P12,Raydenotes the first row, sec-ond column element of the Rayleigh scattering phase matrix, equal to −0.75 sin2Ω,
andP12,λsignifies the corresponding element for the other scatterers in the scene. This
term is established primarily by single scattering from the main cloud deck but implic-itly includes factors such as multiple scattering, aerosol, and cirrus effects (Alexandrov 25
AMTD
6, 1717–1769, 2013The Airborne Multiangle SpectroPolarimetric
Imager (AirMSPI)
D. J. Diner et al.
Title Page
Abstract Introduction
Conclusions References
Tables Figures
◭ ◮
◭ ◮
Back Close
Full Screen / Esc
Printer-friendly Version Interactive Discussion
Discussion
P
a
per
|
Dis
cussion
P
a
per
|
Discussion
P
a
per
|
Discussio
n
P
a
per
|
from the observations at 470, 660, and 865 nm for the scattering range 135◦ to 170◦
are shown in Fig. 19 as the open circles. The primary cloudbow appears atΩ∼143◦,
and the supernumerary arcs at each wavelength appear with progressively diminishing amplitude as scattering angle increases. Note that the number of fringes increases as wavelength decreases, as expected for an interference phenomenon in which there are 5
more blue wavelengths than red wavelengths per given drop diameter.
The solid lines in Fig. 19 are obtained by fitting the values ofP12,λ derived from the
observations to the following model:
P12,λ=aλP12,cld,λ+bλΩ +cλ (2)
whereP12,cld,λ is the first row, second column element of the single-scattering phase
10
matrix for the cloud deck, established using Mie theory for a narrow distribution of spherical droplet sizes. The spectrally variablea,b,ccoefficients are determined em-pirically by least-squares fitting. The form of Eq. (2) was introduced by Br ´eon and Goloub (1998) as a simple way of accounting for unmodeled scene effects. A size dis-tribution in which the number of droplets between radiusr andr+dr is proportional to 15
(r/reff)
v−1
eff−3exp(−r/re
ffveff) was used (Hansen, 1971; Br ´eon and Goloub, 1998; Br ´eon and Doutriaux-Boucher, 2005), where reff is the effective radius and veff is the eff ec-tive variance. A narrow cloud droplet size distribution withreff=7.5 µm andveff=0.01 generated the model results shown in Fig. 19. The spectral dependence of the refrac-tive index of water needs to be taken into account, as noted by Br ´eon and Doutriaux-20
Boucher (2005). A sixth-degree polynomial fit to the data of Daimon and Masumura (2007) for distilled water at a temperature of 19◦C was used to derive the real part of the index of refraction of 1.3385 (470 nm), 1.3315 (660 nm), and 1.3276 (865 nm). This temperature is consistent with the average value over the lowest 1 km of the at-mosphere (∼21◦C) determined from San Diego radiosonde data at 12:00 UTC on 31 25
AMTD
6, 1717–1769, 2013The Airborne Multiangle SpectroPolarimetric
Imager (AirMSPI)
D. J. Diner et al.
Title Page
Abstract Introduction
Conclusions References
Tables Figures
◭ ◮
◭ ◮
Back Close
Full Screen / Esc
Printer-friendly Version Interactive Discussion
Discussion
P
a
per
|
Dis
cussion
P
a
per
|
Discussion
P
a
per
|
Discussio
n
P
a
per
fits. Although improved fits could likely be obtained using more rigorous analysis and including aerosols and multiple scattering effects, the main point of this discussion – as with the scenes presented in earlier sections – is to demonstrate that reliable and physically sensible measurements are generated by the polarimetric imaging technol-ogy used in the AirMSPI instrument.
5
4 Conclusions
AirMSPI has been flying aboard NASA’s ER-2 high-altitude aircraft since October 2010. At the heart of the instrument is an eight-band spectropolarimetric camera that acquires multiangle imagery through a combination of aircraft motion and actuation on a single-axis gimbal. AirMSPI employs a dual PEM-based polarimetric imaging technique to 10
determine degree and angle of linear polarization (DOLP and AOLP) on a pixel-by-pixel basis as relative measurements, independent of instrument absolute radiometric calibration. This methodology was first introduced through theoretical formulation and bench testing (Diner et al., 2007), and has subsequently matured into progressively more sophisticated imaging instruments, beginning with the monochromatic LabMSPI 15
(Diner et al., 2010), the UV/VNIR ground-based camera GroundMSPI (Diner et al., 2012), and most recently, the UV/VNIR airborne sensor, AirMSPI. The MSPI team is currently developing a second-generation instrument, AirMSPI-2, which extends the spectral range into the SWIR. Since the AirMSPI optical coatings perform well over the entire UV-SWIR spectral range (see Sect. 2.1), AirMSPI-2 uses the same coating 20
design for its mirrors.
Development and demonstration of the technology to acquire accurate polarimetric imagery represent major steps toward realization of the type of instrument envisioned to be part of the core payload of NASA’s Aerosol-Cloud-Ecosystem (ACE) mission, currently in the formulation stages. Using example data acquisitions of clear, hazy, 25
AMTD
6, 1717–1769, 2013The Airborne Multiangle SpectroPolarimetric
Imager (AirMSPI)
D. J. Diner et al.
Title Page
Abstract Introduction
Conclusions References
Tables Figures
◭ ◮
◭ ◮
Back Close
Full Screen / Esc
Printer-friendly Version Interactive Discussion
Discussion
P
a
per
|
Dis
cussion
P
a
per
|
Discussion
P
a
per
|
Discussio
n
P
a
per
|
and radiative transfer theory. Sensitivities to particle microphysical parameters such as aerosol and cloud droplet size, morphological parameters such as cloud-top and cloud-base height, and ocean surface wind speed and direction have been demon-strated through visualizations and analyses. This type of data evaluation is an essen-tial precursor to implementation of geophysical retrieval algorithms, which are currently 5
undergoing development.
Recent efforts have focused on improvements and upgrades to the equipment and procedures used for radiometric, polarimetric, and spectral calibration of the AirMSPI camera. Public release of AirMSPI L1B2 data products through the NASA Langley Atmospheric Sciences Data Center is planned for early 2013. We look forward to pro-10
ductive utilization of this new remote sensing resource by the scientific community.
Acknowledgement. The authors thank the entire AirMSPI engineering team for their efforts. This research is being carried out at the Jet Propulsion Laboratory, California Institute of Tech-nology under contract with NASA, and at the University of Arizona College of Optical Sciences, the University of Texas Center for Space Research, and the University of California Joint
In-15
stitute for Regional Earth System Science and Engineering (JIFRESSE) under subcontract with JPL. Funding from the NASA Instrument Incubator Program, Airborne Instrument Tech-nology Transition Program, and Earth Science Research Program is gratefully acknowledged. We thank Brent Holben and Carol Bruegge for their efforts in establishing and maintaining the UCSB and Fresno AERONET sites.
20
References
ACE Science Working Group: Aerosol, Cloud and Ecosystems (ACE) Proposed Satellite Mission Study Report, available at: http://dsm.gsfc.nasa.gov/ace/library.html (last access: 11 February 2013), 2010.
Alexandrov, M. D., Cairns, B., Emde, C., Ackerman, A. S., and van Diedenhoven, B.: Accuracy
25