Voltammetric characterization of an iridium oxide-based system: the
pseudocapaciti
v
e nature of the Ir
0.3
Mn
0.7
O
2
electrode
A.A.F. Grupioni, E. Arashiro, T.A.F. Lassali
Departamento de Fı´sica e Matema´tica, FFCLRP, Universidade de Sa˜o Paulo, Av. Bandeirantes 3900, 14040-901 Ribeira˜o Preto, SP, Brazil
Received 16 September 2002
Abstract
Mixtures of IrO2/MnO2(30:70 mol%) have been electrochemically studied by cyclicvoltammetry (CV) in acid solution. The
crystalline structure, morphology and the electrochemical properties of the electrodes have been studied as a function of the annealing temperature. X-ray diffraction analysis (XRD), show absence of Mn2O3phase formation and suggest the possible of
formation of a solid solution of IrO2 and MnO2 mainly between 400 and 4508C. The voltammetric behavior depends on the
potential cycle number and annealing temperature employed in the preparation of the oxide layer. A good potential window in aqueous H2SO4and high electroactive area are obtained due to the contribution of Ir redox transitions. Energy-dispersive X-ray
(EDX) and scanning electron microscopy (SEM) analysis suggest an enrichment of the Ir content on the surface at the cost of the dissolution of the manganese present in the film when the electrode is submitted to the continuous potential scan. The electrodes have been found to perform well in electrochemical capacitor applications with a specific capacitance close to 550 F g1. The large capacitance exhibited by this system arises from a combination of the double-layer capacitance and pseudocapacitance associated with surface redox-type reactions.
# 2002 Elsevier Science Ltd. All rights reserved.
Keywords: Supercapacitors; Iridium oxide; Manganese dioxide; Voltammetric behavior; Electrochemical properties
1. Introduction
Hydrous metal oxides have been found to possess significant energy storage capabilities, and represent the best materials for application in electrochemical capaci-tors [1,2]. The amorphous RuO2×/xH2O achieved the
greatest importance among the oxide materials [3,4]. RuO2 systems prepared by the sol/gel process deliver
the most capacitance andvalues up to 720 F g-1 have been reported [5]. Metal oxide capacitors provide the highest specific peak power (/5 kW kg
1
), but the high cost of the active material (RuO2) prevents some
applications. One possible way to reduce the cost is to dilute the conductive oxide in a wider type of oxide
structure. Recent research efforts have attempted to minimize the noble oxide content by carrying out dispersion over high surface area substrates [6/10].
Among the various materials investigated for this purpose, attention has been recently paid to the manganese compounds [11]. MnO2 is an important
material in electrochemical technology and has been widely used as an electrode in batteries. This oxide has good electronic conductivity and is capable of providing several redox reactions involving different oxidation states of Mn metal centers.
In this context, the (Ti)IrO2/MnO2mixed electrode
was prepared as a candidate for the supercapacitor device. A mixed oxide composition containing 30 mol% IrO2 was chosen among the ones investigated to keep
the high electronic conductivity of the film with a minimum amount of the expensive metal. IrO2exhibits
metallic conductivities at room temperatures and is the best conductor in the transition metal group. In the case of RuO2/TiO2 mixed oxides, the conductivity is
Corresponding author. Tel.:/55-16-602-3822; fax:/ 55-16-633-9949
E-mail addresses:[email protected](A.A.F. Grupioni), [email protected](E. Arashiro), [email protected] (T.A.F. Lassali).
www.elsevier.com/locate/electacta
dominated by RuO2 when it is present in amounts as
low as 25/30 mol%[12]. Similar behavior is expected for
the IrO2-based systems. For the IrO2/TiO2system, Da
Silva et al. [13] observed that mixtures containing less than 20 mol% IrO2 showed electrical properties
domi-nated by TiO2.
The effect of the addition of MnO2 on the
electro-chemical performance of the IrO2-based electrode in 0.5
mol dm3 H2SO4 was analyzed as a function of
calcination temperature (Tc) of the electrode. The
potential range of the redox processes, the degree of their reversibility and the specific capacitance values were established by cyclic voltammetry (CV). In addi-tion, the structure, morphology and real composition of the (Ti)IrO2/MnO2 (30:70 mol%) electrode were also
systematically examined.
2. Experimental
2.1. Electrode preparation
Electrodes of (Ti)IrO2/MnO2(30:70 mol%) nominal
composition were prepared by thermal decomposition of a mixture of precursor /0.2 mol dm
3
solutions of IrCl3×/xHCl×/yH2O (Aldrich) and MnCl2×/2H2O (Merck)
dissolved in HCl 1:1 (v/v). Both solutions had been lead to the same concentration (0.18 mol dm3). A mixture of appropriatevolumes (0.3 ml Ir and 0.7 ml Mn for 1 ml of total mixture) of the precursor solutions were spread by brushing both sides of the 10/10/0.15 mm3
Ti support, which had been pre-treated through sand-blasting and etched in boiling 10% oxalic acid. After each application, the solvent was evaporated at about 908C and the dried layer was fired for 5 min, under a 5 l min1 O2 stream, in a preheated oven. The deposited
mass on the Ti support has been calculated based on the sum of the specific gravity of the IrO2(11.665 g cm
3
) and MnO2 (5.026 g cm
3
) [14] considering the (30:70 mol%) ratio of and a nominal coating thickness value constant (2mm). The procedure was repeated until the desired catalyst loading was achieved (1.41 mg cm2).
The oxide layer was prepared at different thermal decomposition temperatures (400, 450, 500 and 5508C). (Ti)IrO2 and Ti/MnO2 electrodes were prepared at
4508C employing the same procedure described above, which was adopted as a standard for the comparison of the electrochemical behavior of the binary system. The electrodes were then annealed for 1 h at the correspond-ing temperature. The mountcorrespond-ing of the electrodes on a Teflon holder has been described elsewhere[15].
2.2. Electrochemical measurement
The surface features of the mixed oxides were characterized in situ by CV at 20 mV s1
in the
potential range of 0.4 to 1.4 V per RHE in 0.5 mol dm3H2SO4solutions. The electrodes were submitted
to continuous cyclization of the potential for 100 cycles to evaluate their chemical stability and to reach a stationary surface condition. The double layer region was determined by progressive shifts of the positive and negative potential limit. The differential capacity (Cd) of the oxide/solution interface and the electrode
roughness were obtained from CV measurements ran-ging from 5 to 150 mV s1. The Cd-values were
obtained from the slope of the j (mA cm2) versus n
(mV s1) graphics (were j is the current density at the potentialE/1.38 V per RHE andnis thevoltage sweep
rate, dV/dt).
2.3. Solution and equipment
Electrochemical measurements were performed using a four-compartment cell with two counter electrodes (platinized platinum wires) facing the working electrode from opposite sides, and a Luggin capillary approaching the electrode from below in order to minimize uncom-pensated ohmic drop. Electrode potentials were mea-sured and are reported against a hydrogen electrode in the same supporting electrolyte (RHE). The electroche-mical experiments were carried out with an ECO
CHEMIE Autolab Potentiostat/galvanostat
(PGSTAT30) interfaced with a computer. All experi-ments were carried out in 0.5 mol dm3H2SO4(Merck)
solutionsvolumetrically prepared using Milli-Q quality distilled water. Solutions were dearated and stirred by bubbling nitrogen. All of the experiments were carried out at room temperature, approximately 258C.
The coating morphology and sample compositions were analyzed by scanning electron microscopy (SEM) and energy-dispersive X-ray (EDX) measurements using an electron microscope Zeiss Model DSM 960 coupled to a microanalyzer Link Analytical Model QX 2000. Quantitative analysis of the coating was performed by EDX. The atomic percentages of the elements were obtained through corrections of matrix interference, atomic number, absorbance and fluorescence (ZAF correction). Metallic cobalt (99.998% pure) was used for equipment calibration. Iridium and cobalt reference standards (Micro-Analysis Consultants, Cambridge-shire) were used for internal calibration. The experi-mental errors, based on the ZAF correction algorithm, were always below 1% (wt.%).
The microstructural investigation was carried out by X-ray diffraction analysis (XRD) of the powdered samples. These analyses were performed on a SIEMENS D5005 diffractometer using CuKaradiation (30 kV, 30 mA).
A.A.F. Grupioni et al. / Electrochimica Acta 48 (2002) 407/418
3. Results and discussion
3.1. Morphology and composition characterization
The real composition of the oxide layer of the (Ti) IrO2/MnO2 electrodes was determined by EDX
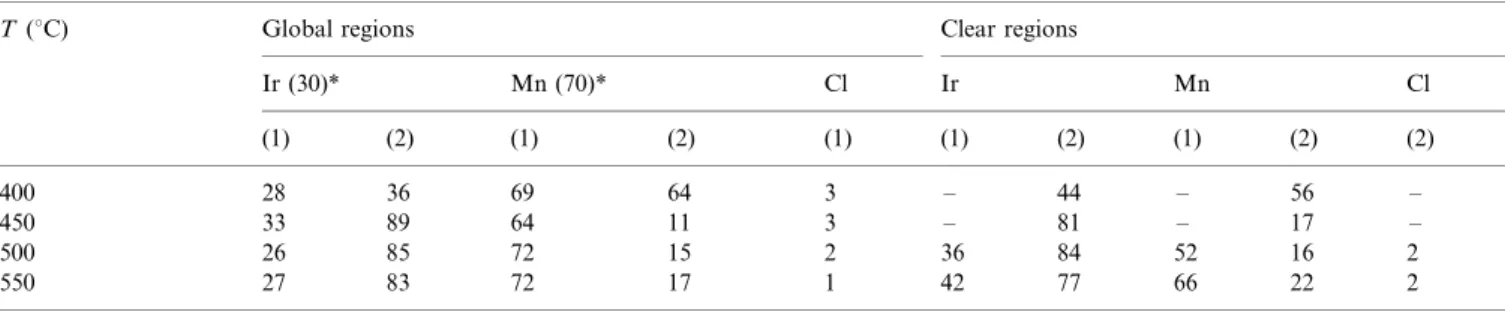
ana-lyses. The atomic percentages of Ir, Mn and Cl present in different regions of the film were analyzed and listed in Table 1 as a function of the annealing temperatures for fresh sample prepared and after electrochemical experiments. For fresh samples, the EDX analyses showed that the real composition of the oxide layer is quite close to the nominalvalue. A small amount of Cl (/2/3% in atom) was also detected in the oxide layer
by EDX analysis, which is probably associated to incomplete decomposition of the precursors. Increase in the annealing temperature reduced the Cl content due to an increase in the efficiency of the decomposition of the precursors.
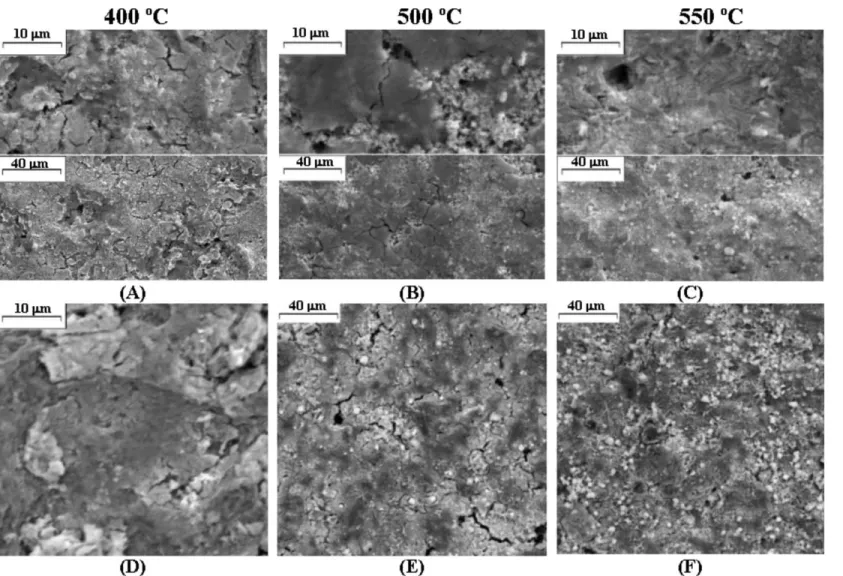
Typical SEM micrographs of the (Ti) IrO2/MnO2
electrodes are shown in Fig. 1 as a function of the annealing temperature,Tc. The preparation of the mixed
layer between 400 and 5508C did not produce appreci-able morphological differences in fresh samples pre-pared (Fig. 1A/C). All coatings were heterogeneous,
containing randomly distributed agglomerates, cracks and pits. At low temperatures (400/4508C) the layers
were rough with a non-crystalline appearance, indicat-ing that thermal decomposition was incomplete. At higher temperatures, on the other hand, the layers appeared to be more compact. This result suggests a higher surface area for electrodes prepared at the lower temperature range (400/4508C).
It was also possible to observe the presence of countless bright particles randomly distributed on the surface in the case of the electrodes prepared at 500 and 5508C. This behavior is characteristic of a non-homo-geneous surface composition and suggests segregation of different components. The punctual EDX analyses of brighter parts showed higher Ir content while the compact regions were highly enriched in manganese
(Table 1). The higher the Tc value, the higher the
amount of bright particles and the greater the Ir content observed in the EDX analyses (Table 1). The non-uniform distribution of Ir is in agreement with previous findings[10], as was also observed by other authors for the (Ti)IrO2/SnO2, (Ti)RuO2/IrO2/SnO2 and
(Ti)IrO2/SnO2/TiO2 systems [16/18]. SEM and
EDX analyses suggest that an increase in Tc favors
phase splitting between the different components, thus promoting IrO2 segregation on the surface of the
electrode.
3.2. Microstructural analysis
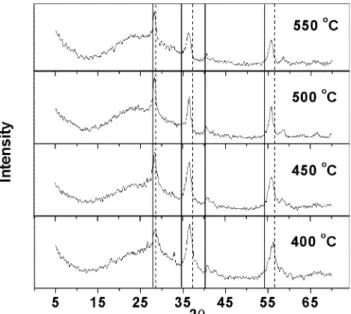
Fig. 2 shows the X-ray diffraction patterns of Ir0.3Mn0.7O2 powder as a function of thermal
decom-position. Three main broad peaks of low intensity are observed for all the samples, independent of Tc. These
X-ray diffraction patterns are characteristic of a highly disordered material, suggesting that the thermal treat-ment produced a mixed oxide of low crystalline degree. This result is in line with the possible incomplete decomposition of the precursors in the annealing temperature range used. This behavior is probably related to the fact that the annealing temperature necessary to transform all chloride into dioxide is higher than 5508C in the experimental conditions employed. It is well known that the thermal decomposition tempera-ture of a precursor is very dependent on its nature, concentration and the solvent employed because the kinetics and the decomposition mechanism are depen-dent on preparation parameters. Values of 390/6008C
have been reported in the literature for the preparation of IrO2, depending on the experimental conditions
employed[19,20]. For oxide mixtures, the film composi-tion also influences the thermal decomposicomposi-tionvalue of the precursors. Kristo´f et al. [20] observed that the conversion temperature of iridium chloride into iridium oxide decreases from 600 to 4008C when the Ir content changes from 100 to 10 mol% in the IrO2/TiO2mixed
oxide.
Table 1
Atomic percentages obtained from EDX analyze for (Ti) IrO2MnO2(30:70 mol%) mol electrodes as a function of annealing temperature
T(8C) Global regions Clear regions
Ir (30) Mn (70) Cl Ir Mn Cl
(1) (2) (1) (2) (1) (1) (2) (1) (2) (2)
400 28 36 69 64 3 / 44 / 56 /
450 33 89 64 11 3 / 81 / 17 /
500 26 85 72 15 2 36 84 52 16 2
550 27 83 72 17 1 42 77 66 22 2
(1) Fresh sample prepared.
Fig. 1. SEM micrographs of (Ti) Ir0.3Mn0.7O2electrodes as a function of annealing temperature. (A), (B) and (C): Freshly prepared electrodes. (D), (E) and (F): After electrochemical experiments.
A.A.F.
Grupioni
et
al.
/
Electrochi
mica
Acta
48
(2002)
407
/
418
X-ray diffractograms of the mixed oxides showed regular shifts in the position of the peaks expected for the IrO2 and MnO2 tetragonal structure, indicating a
reciprocal solubility of the two components. This result is in line with the Hume/Rothery conditions because
both oxides have a tetragonal structure, and similar ionic radius and valence. Therefore, XRD analyses suggest that the mixed oxide system formed a solid solution of IrO2 and MnO2 with the rutile-type
struc-ture, for the studied composition.
For comparison, the XRD spectrum of the pure component powders prepared at 400 and 5508C are shown in Fig. 3. For the iridium oxide prepared at
4008C, the XRD spectrum shows broad and low intense peaks that can be related to the most intense diffraction peaks of the rutile phase (Fig. 3). The X-ray pattern of the sample prepared at 5508C shows peaks with a better definition, indicating that thermal treatment leads to an increase in the crystallization degree of the material due to a more complete decomposition of the precursor.
An increase in the crystallization degree with thevalue ofTcwas not observed for the (Ti) IrO2/MnO2system,
suggesting that the mixed oxide makes the thermal decomposition of the components difficult (Fig. 2). Increase in the Tc promoted an improvement in the
definition of the peak observed at 2u/288 and a
displacement in the position of the other peaks tovalues closer to those expected for the IrO2/rutile structure.
This behavior is in agreement with the SEM and EDX analyses, suggesting a reduction in the solubility of the two components and an increase in the importance of IrO2for the physical/chemical properties of the system.
The representative XRD pattern (Fig. 3), of the manganese oxide deposited at 4008C showed reflections related to different types of oxides (Mn2O3and MnO2
polymorphs). For higher temperatures, only the Mn2O3
phase was observed (Fig. 3). This result is in line with the decomposition temperaturevalue of 4208C reported for MnO2/Mn2O3conversion[21]. For comparison, the
absence of the Mn2O3phase in the X-ray diffractogram
of the binary oxide system reinforces the possible formation of a solid solution of IrO2and MnO2in the
temperature range of the preparation studied. This behavior suggests promising properties for the techno-logical application of the IrO2/MnO2mixture, sincea
-Mn2O3 has a higher electric resistance than b-MnO2
[21].
3.3. Voltammetric behavior
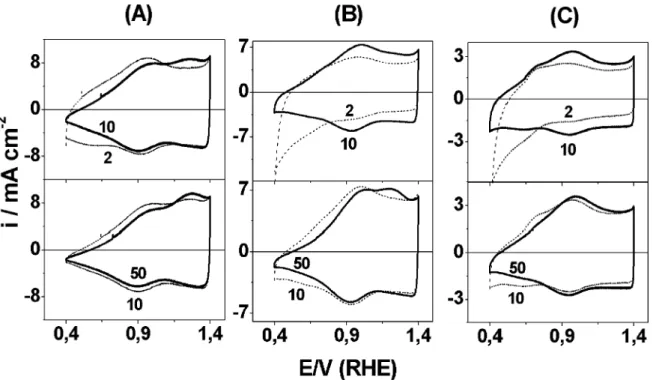
Fig. 4 shows typical cyclic voltammograms for (Ti) IrO2/MnO2electrodes recorded between 0.4 and 1.4 V
per RHE as a function of the potential cycle number (n) and annealing temperature, Tc. All the electrodes
exhibited a voltammogram typical of the DSA-type oxide electrodes with a pseudocapacitive behavior. The electrochemical response was typical of a capacitor exhibiting roughly rectangular mirror images and rapid reversals of directions of response currents for n/2.
Thevoltammetric behavior depends on the potential cycle number (n) andTcemployed in the preparation of
the oxide layer. For the electrode prepared at 4008C andn/2, two broad bands are present between 0.5/0.6
and 0.9/1.0 V per RHE during the positive and negative
going scans. Similar voltammetric behavior was ob-served for an IrO2film prepared by reactive sputtering
[22] and for a (Ti)IrO2/SnO2 system [23] suggesting
that both redox transitions are related with the surface electrochemistry of iridium in acid solution.
Fig. 2. X-ray diffraction patterns of (Ti)Ir0.3Mn0.7O2electrodes as a
function of annealing temperature. Position of the peaks expected for the IrO2(---) and MnO2(*/) tetragonal structure.
Fig. 3. X-ray diffraction patterns of MnO2and IrO2powder samples
The pair of bands between 0.9 and 1.0 V per RHE is attributed to the Ir(III)/Ir(IV) solid state redox transi-tions. The mechanism of this reaction is based on the double ion-electronic injection (or ejection) of electron and counter ion (H or OH), compensating for the change of the charge on the oxide film. This model requires that a hydrated oxide be formed on the surface. Consequently, the ionic transport is influenced by hydration degree and the porous structure of the oxide layer.
The hint of a pair of peak located at /0.55 V per
RHE can be related to a prepeak preceding the Ir(III)/ Ir(IV) redox transition frequently observed in electro-litically grown hydrated oxide films on iridium[24/29].
This prepeak is absent in the Ti/IrO2electrodes prepared
at 4508C employing the same procedure described to mixed oxide (see Fig. 5a). This behavior suggests that the chemical state of the surface is different in oxide layer obtained from IrO2/MnO2mixed that observed
to Ti/IrO2 electrode. In agreement with the SEM and
EDX analyses for fresh samples, this may indicate that thermal treatment in the Ti/IrO2/MnO2 electrodes
leads to a more incomplete decomposition of the precursors thus acquiring a partly hydrous nature which makes theirvoltammogram similar to that one observed in electrolitically grown hydrated oxide films on iridium. The increase inTcpromoted some significant changes
in thevoltammetric feature of theI/E profiles. Smaller voltammetric currents are obtained by increasing the preparation temperature; this behavior can be ex-plained as a consequence of a decrease in the effective
surface area due to the phenomena of crystallization and sintering at higher temperatures [30]. Besides the two redox bands described for Tc/4008C, it is possible to
observe a current tail as the negative-going potential increases at initial cycles (n/2) in the case of the higher
temperature. The presence of this cathodic current suggests the occurrence of an irreversible reduction process involving active sites of the oxide layer. After some few cycles it is possible to observe that a region of capacitive nature substitutes the cathodic current tail (seeFig. 4ton/10).
Similar behavior is observed in thevoltammogram of the Ti/MnO2 electrode, prepared in the same
experi-mental condition, indicating that cathodic current is probably related to the partial reduction of the Mn surface sites (Fig. 5B) when the fresh electrode is submitted to cathodic scan. It is possible to observe a continuous decrease in the voltammetric charge with n to the (Ti)MnO2electrodes probably related to gradual
dissolution of the oxide layer. According to Pang et al.
[11], this reduction process involves the incorporation of protons in the crystalline structure of MnO2dehydrated
sites with dilatation of the crystalline net and the eventual formation of a MnOOH amorphous phase. The reduction mechanism has been suggested to be a combination of electrochemical and chemical dissolu-tion steps when acid soludissolu-tions are used as electrolyte support[31,32].
The effect of potential scan on the voltammetric behavior also shows dependence on the thermal treat-ment of the oxide layer. For the electrode prepared at Fig. 4. Cyclicvoltammograms of (Ti)Ir0.3Mn0.7O2electrodes between 0.4 and 1.4 V per RHE as a function of annealing temperature in 0.5 mol
dm3H
2SO4at 20 mV s
1. (A) 400; (B) 450 and (C) 550
8C. Cycle number of potential is shown inset in the figure.
A.A.F. Grupioni et al. / Electrochimica Acta 48 (2002) 407/418
4008C, the potential scan up to ten cycles promotes disappearance of a pair of humps localized at/0.55 V
per RHE. After ten cycles, it is possible to observe the presence of a peak at 1.2 V per RHE. The change in the
voltammetric behavior with the number of cycles suggests that potential scan promoted some alterations in the surface composition of the electrode. The higher the cycles number, the more intense the band related to the new process is and more similar the voltammetric profile to that one observed for electrolitically grown films on iridium Probably the oxide layer acquire a partly hydrous nature due to an increase in the number of the hydrophilic sites responsible for proton and electron transfer in the redox process in the film.
These changes in the voltammmetric behavior are
very similar to that one observed by M. Vukovic[33]to hydrous oxide films grown on iridium followed by heat treatment and submitted to square-wave pulses from/
0.25 to/1.25 V (SCE) at 2 Hz for 5 min. The
voltammetric profile of hydrous oxide film is restored after square-wave activation of the anhydrous film and the new anodic peak close to 1.1 V (RHE) is also observed. This similarity of behavior suggests that the process observed in 1.2 V per RHE to Ti/IrO2/MnO2
electrodes is related to iridium active sites.
For electrodes prepared atTc/4008C andn/2, it is
possible to observe a continuous increase in thev oltam-metric charge due to gradual wetting of the internal porosity. This allows a progressive bulk hydroxylation of the oxides. The disappearance of the pair of humps localized at /0.55 V per RHE is only observed after 20
cycles. The solid-state redox transition observed in /
1.2 V per RHE is onlyvisible after continuous potential scan. The higher theTc-value, the more potential cycles
are necessary to observe this surface redox process and the more dislocated to cathodic direction is the peak
potential value (Ep) related to this process. For the
electrode prepared at 5508C, it is only possible to observe one solid-state redox transition, independent of thevalue ofn.
The different behavior observed for the (Ti) IrO2/
MnO2 system as a function of n and Tc can be better
understood by analyzing of the oxide layer composition and the morphology of the (Ti)IrO2/MnO2 electrode
after repetitive potential cycling. Typical SEM micro-graph of the electrodes after intensive use is shown in
Fig. 1D/F as a function ofTc. Significant changes were
not observed in the morphology of the electrode prepared at 4008C after the intensive use. However, SEM micrographs reveal a substantial change in the oxide layer morphology for electrodes prepared between 450 and 5508C (Fig. 1E and F). Besides the increase in the number cracks and the porosity of the oxide layer, it is also possible to observe the presence of countless agglomerates (light areas) on the surface of the samples. This result suggests that after repetitive potential scan the oxide layer becomes much more heterogeneous in composition, probably due to preferential Mn dissolu-tion. The number of agglomerates increases with increasing calcination temperature of the oxide layer, confirming a reduction in the solubility of the two components.
While the EDX analysis of the electrode prepared at 4008C and submitted to electrochemical study shows similar values for Ir and Mn content (Table 1) to those in the fresh sample, electrodes annealed at Tc/400
show higher Ir content and an appreciable reduction in the amount of manganese. This result confirms that the cathodic tail observed in the voltammetric behavior is related to Mn preferential dissolution when the oxide layer is prepared at higher annealing temperatures. The Fig. 5. Cyclicvoltammograms of (Ti)IrO2(A) and (Ti)MnO2(B) electrodes between 0.4 and 1.4 V per RHE in 0.5 mol dm
3
H2SO4at 20 mV s
1
higher the temperature of sample preparation, the lower is amount of manganese remaining in the oxide layer.
The punctual analysis of specific regions of the coating confirms that light areas detected in the SEM micrographs (Fig. 1D/F) are rich in IrO2. This result
suggests an enrichment of the Ir content on the surface at the cost of the dissolution of the manganese present in the film when the electrode is submitted to the contin-uous potential scan.
3.4. Effects of the positive and negative potential limit
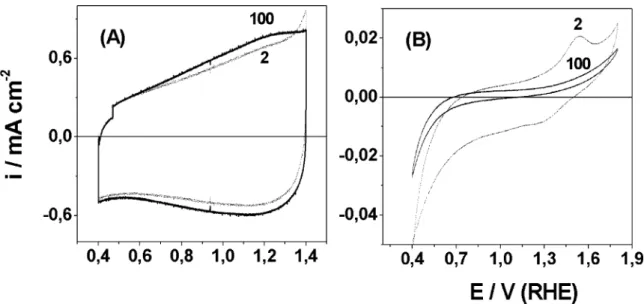
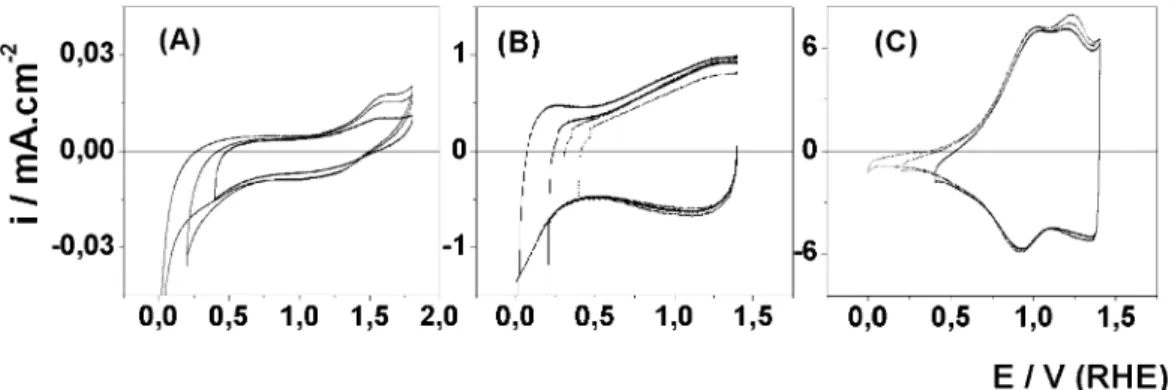
Voltammetric curves were recorded by progressively shifting the positive and negative potentials with the purpose of investigating the maximum potential range available in 0.5 mol dm3 H2SO4. Fig. 6 shows the
voltammetric curves obtained at different potential limits to (Ti) IrO2/MnO2, (Ti) IrO2 and (Ti) MnO2
electrodes prepared at 4508C. A potential range of 1.45 V was obtained without any apparent decomposition of water for Ir-based electrodes. Electrocatalytic activity for the O2evolution reaction (OER) was observed for all
the Ir-based electrodes above 1.45 V per RHE and after 1.8 V (RHE) to the Ti/MnO2. This result suggests that Ir
active sites domains the electrocatalytic activity of the system.
Two different patterns are observed to (Ti) IrO2/
MnO2 and Ti/IrO2 electrodes with negative potential
limit. For (Ti) IrO2/MnO2 electrodes, the cathodic
potential limit does not change the shape of the
voltammetric curve independent of Tc value. This
behavior is similar to that one observed to IrO2
electrodes prepared at T5/3608C in 1 M NaOH [34].
For Chen and Trasatti[34], this behavior indicates that the current flowing belowE/0.4 V per RHE does not
involve proton injection into the active layer. The
voltammetric profile isvery similar to that observed in anodic iridium oxide films grown on iridium surface
[33,34]. The Ti/IrO2voltammetric behavior is the same
observed to electrode prepared in ref. [34] for T/
3608C suggesting that electrode show anhydrous oxide film characteristics.
The progressive shift of the cathodic potential limit for (Ti) MnO2electrode promoted an intensification of
the anodic band observed close to 1.6 V per RHE. It is possible to notice the same effect with solid-state redox transition observed at /1.2 V per RHE to (Ti) IrO2/
MnO2electrode independently ofTc.
The (Ti) IrO2/MnO2 electrodes were submitted to
continuous cyclization of the potential between 0.0 and 1.4 V per ERH to 20 mV s1. The purpose was to investigate the stability of the oxide layers in this new condition. While the voltammetric current for the electrode prepared at 4008C decreases continually with n-values, the other electrodes do not show any change in the voltammetric behavior. This result sug-gests that while the process of the Mn dissolution occurs in a continuous and slow way for the electrode prepared at 4008C, for the other samples this process isvery fast and occurs soon after the first cycles.
3.5. Effect of the scan rate between 0.4 and 1.4 V/ERH
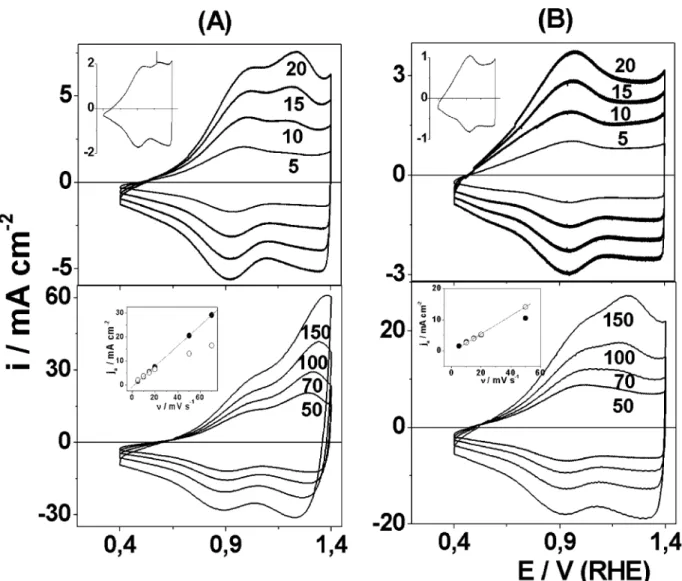
The influence of the scan rate on the performance of the electrodes annealed at differentTcvalues is shown in
Fig. 7. The anodic/cathodic charge ratio,qa/qc, remains
close to one, independent of the scan ratevalue (n). This
indicates that the oxidation and reduction processes at the electrode interface are highly reversible. All samples show a cyclic voltammogram with a linear relationship between the peaks current (jp) and the scan rate (n) for
the redox processes observed at 0.9 and 1.2 V. This clearly indicates that the reactants must be confined at the interface. Deviation from linearity was observed for the Ir(III)/Ir(IV) redox process only at scan rates faster than 50 mV s1. This behavior is generally found in porous structures where the faster scan promotes exclusion of the surface regions that are difficult to access and is due to ohmic-drop effects.
However, there are some differences in the v oltam-metric behavior of these curves when the n-value is increased. While the value of the anodic peak current (iap) related to the Ir redox process is more intense at
lower potential scan rates, theiap-value of the band close
Fig. 6. Voltammetric curves obtained at different potential limits to the (Ti)MnO2(A), (Ti)IrO2(B) and Ti/Ir0.3Mn0.7O2(C) electrodes in 0.5 mol
dm3H2SO4at 20 mV s
1
.
A.A.F. Grupioni et al. / Electrochimica Acta 48 (2002) 407/418
to 1.2 V per RHE increases more significantly with n values and becomes more intense than that observed for the Ir(III)/(IV) redox transition at a faster scan rate. In other words, the charge associated with the first anodic peak decreases while that associated with the second anodic peak increases with increasing scan rate.
On the other hand, while both band are observed in the cyclicvoltammogram of the electrodes prepared at 400/4508C independent of n-values, for the sample
annealed above 4508C it is only possible to detect the presence of a wave close to 1.2 V per RHE above 5 mV s1(see inset ofFig. 6). These data suggest that the two anodic processes (close to 0.98 and 1.2 V per RHE) are sensitive to a different degree to the kinetics (potential scan rate) and the oxide microstructure (annealing temperature), respectively.
Similar behavior was observed in Ir oxide films grown in 0.5 mol dm3
H2SO4 as a function of n [25,26].
Pickup and Birss [25] related to this behavior with the occurrence of a Ir(III/IV) and Ir(IV/V/VI) waves overlap in the 0.9/1.3 V potential range. For Burke and Whelan
[25]the Ir redox process observed close to 0.9 V occurs through a hopping mechanism involving electron ex-change between Ir(III) and Ir(IV) adjacent sites and that generation of Ir(VI) sites at positive potentials enhances the electron hopping rate significantly. In base in this mechanism, Pickup and Birss[26]argued that as thenis
increased, the rate of electron hopping between the Ir(III) and Ir(IV) sites becomes insufficient to maintain equilibrium within the oxide. However, when the potential is high enough to generate Ir(V) and/or Ir(VI) sites, the charge transport rate increases and the film reaches equilibrium. When then value is increased,
more Ir(V) and/or Ir (VI) sites are necessaries to promote a new equilibrium situation shifting the Ep to
highervalues. This mechanism is in agreements with the behavior described to (Ti) IrO2/MnO2 system and
confirmed the similarity observed in the anodically grown Ir oxide electrodes. However, a systematic study involving changes in the composition of the oxide layer and XPS analyses are being carried out in our labora-tory to check this proposal.
Fig. 7. Voltammetric behavior as a function of the scan rate,n, between 0.4 and 1.4 V per ERH in 0.5 mol dm3H2SO4at 20 mV s
1
Independently of Tc-value employed in the film
preparation, the oxide layer is constitued of a mixture of crystalline and hydrated amorphous oxides, the latter due to incomplete precursor composition. The presence of a hydrated amorphous oxide phase in the oxide layer can explain the participation of Ir-sites located in the most difficult-to-access region to the solid-state redox transition.
We believe that two types of interfaces can be involved in the charging process of the oxide layer prepared by thermal decomposition: (a) the oxide/ solution interface of the freely accessible external sur-face; (b) the oxide/solution interface of the adjacent, the most difficult-to-access surface (e.g. inside pores). The double layer charging process involves the occurrence of Ir(III)/Ir(IV) solid state transitions in the a and b type interface. This solid state transition occurs with the participation of proton exchange between the oxide/
OH surface groups and the solution, according to the
equation (1):
M(OH)xOydH
delM(OH)xdOyd (1)
Spectroscopy studies confirmed the presence of /OH
groups at the surface and at more intern oxide surface
[35]without evidencing, however, the presence of water molecules in the most intern areas of the oxide layer. The mechanism by which internal regions can be active in reactions involving water molecules is that the /OH
surface groups behave as acids or weak bases, thus acting as a proton source.
The more amorphous the oxide formed by the thermal decomposition method is, higher is the impor-tance of b type interface in the charging process of the film. In fact, the incomplete precursor decomposition results in an oxide phase having oxy-hydroxide species with ability to act as active sites. XRD analyses suggest that the presence of a hydrated amorphous oxide phase is favored by MnO2 introduction in the oxide layer.
After Mn dissolution a higher among of Ir hydrated oxide is exposed to solution. Only after this dissolution process, the cyclic voltammogram assumes a similar behavior observed to hydrous oxide films grown on iridium and the process close to 1.2 V is detected. The presence of this band seems to be related to the hydration degree of the oxide layer. This relation explains the change in the voltammetric behavior of the system with the n when the film preparation
temperature is increased.
3.6. Charge capacitance between 0.4 and 1.4 V/ERH
Values for the differential capacitance (Cd) were
estimated from CV experiments by measuring the slope of thevoltammetric current densityversus scan rate plot at E/1.38 V per RHE. The current values were
measured after 100 cycles of potential scan between
0.4 and 1.4 V per REH to guarantee that the surface reached a stationary-state situation after the dissolution process observed in the first cycles. The advantage of measuring the voltammetric current at this potential
value is the fact that it includes the contribution of both redox transitions (observed at 0.9 and 1.2 V per RHE) for the specific capacitance of the system. The roughness factor,RF, was calculated assuming a C of 80mF cm
2
for a smooth oxide surface [36]. The specific capaci-tance, Cs, was obtained by dividing theCdvalue by the
Ir mass content (mIr) of the oxide layer (g cm
2
). Although the specific capacitance of mixed oxides should be reported on the basis of the total weight of the oxide, in this paper the Cs-value is measured as a
function of the content of the noble oxide (IrO2). This is
done with the objective of evaluating the effect of the reduction of the amount of the precious component to 30 mol% on the total charge capacity.
qa,Cd,CsandRFvalues are summarized inTable 2as
a function of the annealing temperature. For compar-ison, qa,Cd,Csand RF values obtained for the Ti/IrO2
electrode annealed at 4508C are also shown inTable 2. The anodic surface charge,qa, represents the number
of protons exchanged between the oxide surface and the solution according to the equation (1). This can be considered a measure of the surface area[37], which is in turn related to the morphology of the oxide layer [38]. All the electrodes exhibit higher qa values than that
observed for Ti/IrO2prepared at 4508C. This suggests
an increase in the electroactive surface area promoted by the mixture of different oxides. This increase can be understood if one considers that the introduction of the second component promoted dispersion of the Ir active surface sites, increased the content of oxy-hydroxide species with ability to act as active sites and that other oxidation states had started to contribute with the charging process of the electrode.
The high RF-values observed in the case of all the
analyzed electrodes are intimately related to the large double-layer capacitance (Cdl) due to high surface area
of the samples (which is made up of microcrystallites separated by highly defective regions due to rugosity, microporosity, cracks, etc.). However, the RF-values
showed in theTable 2are enormous, truly nanoporous films of comparable thickness do not show so high
values[39]. These high values also arise of the pseudo-capacitive behavior of the material, which originates from the faradaic reactions at the interface between the electroactive materials and electrolytes.
The electrodes prepared at 400/4508C show RF -values three times as high as those at observed forTc/
4508C. It has been demonstrated that parameters such as the degree of hydration of the oxide and its crystal-linity play essential roles in the amount of charge exchanged between the electrode and the electrolytic solution [5]. Experiments on hydrous Ru oxides [5,40] A.A.F. Grupioni et al. / Electrochimica Acta 48 (2002) 407/418
have shown that it has a substantially larger charge storage capacity that anhydrous RuO2. According to
Zheng et al.[5], amorphous Ru oxides allow the whole bulk of RuO2to be used for charging storage due to the
fast proton transport rates. Removal of structural water from the oxide with the Tc increases the results in
lowering the proton transport through the oxide. This result suggests that if one wants to obtain electrodes of high surface area and high charge capacitance, the precursors should be annealed at 400/4508C
tempera-ture ranges.
qa,Cd,CsandRFvalues decrease with the annealing
temperature, suggesting a decrease in the real surface area. This result is in agreement with SEM analyses that show a more compact oxide layer at higher tempera-tures. This decrease also suggests a decrease in the number of active sites available to participate inreaction (1).
The anodic charge, (qa) of the CV between 0.4 and 1.4
V per RHE at n/2 and 20 mV s
1
, before the Mn dissolution process, is also included inTable 2. This was done with the aim of evaluating the effect of dissolution process on the electroactive area of the electrodes by comparison of this parameter with the value obtained before the potential scan. This parameter gives an idea of the morphological conditions of the electrode surface soon after preparation, excluding the effects of Mn dissolution. The qa value decreases with the annealing
temperature in a way similar to that for qa. A
comparison between the qa and qa values show that
the Mn dissolution process did not promote significant reduction in the value of the voltammetric charge. On the other hand, after potential scan for 100 cycles between 0.4 and 1.4 V per REH, an increase in theqa
value was obtained for the electrodes prepared at higher annealing temperature. Theqadecrease observed for the
electrode prepared at 4008C should be related to loss through erosion of the most external part of the oxide layer.
Maximum Cs values were obtained for electrodes
prepared at lower temperatures. However, the instability of the oxide layer with the potential cyclization shows that temperatures lower than 4508C are not adequate for the preparation of the electrodes in acid solution.
Thevalue obtained for the electrode prepared at 4508C is at least 19 times higher than that observed for the Ti/ IrO2 system in similar experimental conditions (21 F
g1). Only a minimum amount of noble oxide (B/1 mg)
was required to produce a significant increase in the charge capacity, maintaining the high conductivity of the oxide layer.
TheCs-values observed for the electrode prepared at
4508C is not as high as that obtained for hydrated RuO2(720 F g
1
was measured for the powder formed at 1508C)[5]. The difference in charge capacity among these systems is mainly related to the fact that in the Ru-based system, where the composite is completely amor-phous, the entire bulk of RuOx takes part in the faradaic reaction. However, the Cs value obtained for
IrO2/MnO2 prepared at 4508C is higher than those
obtained for anhydrous RuO2-based electrodes
pre-pared at 4008C (380 F g1at a scan rate of 100 mV s1 [41]and 19.2 F g1for RuO2×/xH2O prepared by
Zheng et al. [5]). In similar preparation conditions, where due to a highTcvalue most of the external part of
the oxide layer just participates in reaction (1), the Ir-based system shows a higher charge capacity than the one observed for RuO2.
The large capacitance exhibited by this system arises from a combination of the double-layer capacitance (due to high surface area) and pseudocapacitance associated with surface redox-type reactions. MnO2
addition to the oxide layer promoted a considerable increase in the specific capacitance of the electrode due to an increase in the surface area promoted by a higher microporosity degree and also promoted an enrichment of the Ir content on the surface of the electrode at cost of the dissolution of the manganese present in the film.
4. Conclusion
(Ti) IrO2/MnO2 electrodes prepared by thermal
decomposition (400/5508C) show high electroactive
area, independent of the annealing temperature. All the electrodes exhibit a pseudocapacitive behavior and surface properties controlled by the Ir active sites. DRX analysis shows absence of the formation of a Mn2O3
Table 2
Values of anodic charge,qa(ton2)qa(ton100), differential capacitance,Cd, specific capacitance,Csand roughness factor,RF, estimated from CV, 20 mV s1
T(8C) qa(mC cm2)
qa(mC cm2)
Cd(F cm2)
Cs(F g1)
RF(Cd/C)
400 299 234 0.449 557 5613
450 182 207 0.342 410 4275
500 160 178 0.221 251 2763
550 86 108 0.139 213 1788
Ti/IrO2(4508C) / 36 0.0529 21 661
phase. This suggests the possible formation of a solid solution of IrO2and MnO2with a rutile-type structure,
mainly at 400/4508C. The chemical state of the surface
is different in the oxide layer obtained from IrO2/
MnO2 mixed from that observed to Ti/IrO2 electrode
indicating that thermal treatment in the Ti/IrO2/MnO2
electrodes leads to a more incomplete decomposition of the precursors thus acquiring a partly hydrous nature. A partial dissolution of the Mn surface sites is observed when the fresh electrode is submitted to cathodic scan, independent of theTcvalue. This behavior is related to
the thermodynamic instability of Mn species in the acid solution. An enrichment of the Ir content on the surface of the electrode at cost of the dissolution of the manganese present in the film was observed when the electrode was submitted to continuous potential scan. After Mn dissolution, it was possible to observe the presence of a peak at 1.2 V per RHE, attributed to higher Ir solid-state redox transitions.
A good potential window (1.4 V) and high electro-active area are obtained in aqueous H2SO4due to the
contribution of Ir redox transitions. MnO2addition to
the oxide layer promotes considerable increase in the specific capacitance of the electrode. This is due to an increase in the surface area promoted by high micro-porosity degree, as well as due to changes in the nature of the oxide film. After Mn dissolution process, Ir actives sites domain the surface properties and the
voltammetric behavior assumes similar aspect of elec-trolitically grown hydrated oxide films on iridium. The system shows large capacitance due to a combination of the double-layer capacitance and pseudocapacitance associated with surface redox-type reactions. Increase in theTc-values promotes little decrease in thevalues of
Cs.
Acknowledgements
T.A.F.L. acknowledges financial support received from FAPESP (Brazil). A.A.F.G. also acknowledges FAPESP for a fellowship. The authors are grateful to Professor O. Savadogo for hisvaluable contribution to the finalversion of this paper.
References
[1] J.S. Sarangapani, B.V. Tilak, C.-P. Chen, J. Electrochem. Soc. 143 (1996) 3791.
[2] B.E. Conway, J. Electrochem. Soc. 138 (1995) 1539. [3] C.-C. Hu, Y.-H. Huang, Electrochim. Acta 46 (2001) 3431. [4] J.H. Lim, D.J. Choi, H.-K. Kim, W.I. Cho, Y. Soo, J.
Electro-chem. Soc. 148 (2001) A275.
[5] J.P. Zheng, P.J. Cygan, T.R. Jow, J. Electrochem. Soc. 142 (1995) 2699.
[6] P. Soudan, J. Gaudet, D. Guay, D. Be´langer, R. Schulz, Chem. Mater. 14 (2002) 1210.
[7] M. Ramani, B.S. Haran, R.E. White, B.N. Popov, J. Electro-chem. Soc. 148 (2001) A374.
[8] Y.U. Jeong, A. Manthiram, J. Electrochem. Soc. 148 (2001) A189. [9] F. Cao, J. Prakash, J. Power Sources 92 (2001) 40.
[10] A. Grupioni, T.A.F. Lassali, J. Electrochem. Soc. 148 (2001) A1015.
[11] S.-C. Pang, M.A. Anderson, T.W. Chapman, J. Electrochem. Soc. 148 (2001) A189.
[12] P.H. Duvigneaud, A. Coussment, J. Solid State Chem. 52 (1984) 22.
[13] L.A. Da Silva, V.A. Alves, M.A.P. da Silva, S. Trasatti, J.F.C. Boodts, Can. J. Chem. 75 (1997) 1483.
[14] R.C. Weast (Ed.), Handbook of Chemistry and Physics, 55th ed, CRC Press, Baton Roca, FL, 1974, p. 1975.
[15] R. Garavaglia, C.M. Mari, S. Trasatti, Surf. Technol. 23 (1984) 41.
[16] C.P. De Pauli, S. Trasatti, J. Electroanal. Chem. 396 (1995) 161. [17] R. Hutchings, K. Mu¨ller, R. Ko¨tz, S. Stucki, J. Mater. Sci. 19
(1984) 3987.
[18] T.A.F. Lassali, L.O.S. Bulho˜es, L.M.C. Abeid, J.F.C. Boodts, J. Electrochem. Soc. 144 (1997) 3349.
[19] G.-W. Yang, K. Rajeshwar, J. Electrochem. Soc. 134 (1830) 1987. [20] J. Kristo´f, J. Liszi, P. Szabo´, A. Barbieri, A. De Battisti, J. Appl.
Electrochem. 23 (1993) 615.
[21] A. Kozawa, Proceedings of Symposium on MnO2Electrode,vol.
85-4, The Electrochemical Society Proceedings Series, Penning-ton, NJ, 1985, pp. 384.
[22] T. Pauporte´, D. Aberdam, J.-L. Hazemann, R. Faure, R. Durant, J. Electroanal. Chem. 465 (1999) 88.
[23] T.A.F. Lassali, J.F.C. Boodts, L.O.S. Bulho˜es, J. Non Cryst. Sol. 273 (2000) 129.
[24] B.E. Conway, J. Mozota, Electrochim. Acta 28 (1983) 9. [25] L.D. Burke, D.P. Whelan, J. Electroanal. Chem. 162 (1984) 121. [26] P.G. Pickup, V.I. Birss, J. Electroanal. Chem. 240 (1988) 185. [27] S. Gottesfeld, A. Redondo, I. Rubenstein, S.W. Feldberg, J.
Electroanal. Chem. 265 (1989) 15.
[28] H. Elzanowska, V.I. Birss, J. Appl. Electrochem. 23 (1993) 646. [29] H. Elzanowska, J. Segal, V.I. Birss, Electrochim. Acta 44 (1999)
4515.
[30] S. Trasatti, G. Lodi, in: S. Trasatti (Ed.), Electrodes of Conductive Metallic Oxides, Part B, Elsevier, Amsterdam, 1981. [31] S. Nijjer, J. Thonstad, G.M. Haarberg, Electrochim. Acta 46
(2001) 3503.
[32] M. Pourbaix, Atlas of Electrochemical Equilibria in Aqueous Solutions, Pergamon Press, Oxford, 1966.
[33] M. Vukovic, J. Appl. Electrochem. 20 (1990) 969. [34] H. Chen, S. Trasatti, J. Appl. Electrochem. 23 (1993) 559. [35] R. Ko¨tz, H. Neff, S. Stucki, J. Electrochem. Soc. 131 (1984) 72. [36] S. Levine, A.L. Smith, Discuss. Faraday Soc. 52 (1971) 290. [37] S. Trasatti, Electrochim. Acta 36 (1991) 225.
[38] S. Ardizzone, A. Carugati, S. Trasatti, J. Electrochem. Soc. 129 (1982) 1689.
[39] P. Soudan, J. Gaudet, D. Guay, D. Be´langer, R. Schulz, Chem. Mater. 14 (2002) 1210.
[40] T.R. Jow, J.P. Zheng, J. Electrochem. Soc. 145 (1998) 49. [41] I.D. Raistrick, in: J. McHardy, F. Luduig (Eds.), The
Electro-chemistry of Semiconductors and Electronics-Processes and Devices, Noyes, Park Ridge, NJ, 1992, p. 297.
A.A.F. Grupioni et al. / Electrochimica Acta 48 (2002) 407/418