Sushi commercialized in Brazil: Organic Hg levels and exposure intake
evaluation
Esther Lima de Paiva
a, Jeanne Cl
ecia Alves
b, Raquel Fernanda Milani
a, B
arbara Sia Boer
a,
K
esia Diego Quintaes
b, Marcelo Antonio Morgano
a,*aInstitute of Food Technology (ITAL), PO Box 139, 13070-178, Campinas, SP, Brazil
bNutrition School, Federal University of Ouro Preto (UFOP), 35400-000, Ouro Preto, MG, Brazil
a r t i c l e
i n f o
Article history:
Received 26 January 2016 Received in revised form 18 April 2016
Accepted 19 April 2016 Available online 21 April 2016
Keywords: Sushi Tuna TDA AAS Exposure intake Methylmercury
a b s t r a c t
The presence of organic mercury (methylmercury) in tuna, salmon and kani sushis marketed in res-taurants specialising in Japanese foods (Campinas, S~ao Paulo, Brazil), was investigated by atomic ab-sorption spectrometer with thermal decomposition and amalgamation. Total mercury was analyzed directly, whilst organic mercury was quantified after a previous extraction with toluene in an acid so-lution, assisted by microwaves. Under these analytical conditions there was no interconversion between the inorganic and organic mercury. High sensitivity was observed for organic mercury, with limits of detection and quantification of 2.0 and 6.6mg kg 1. The organic mercury contents ranged from 12 to
583mg kg 1, 6.6 to 8.2mg kg 1and no detected values, for the tuna, kani and salmon sushi, respectively.
The mean proportion of organic Hg/total Hg for tuna sushi was 88%, indicating that the most toxic form of mercury, organic Hg, predominate in this food. The estimated exposure to methylmercury was made by taking into account the Provisional Tolerable Weekly Intake (PTWI 1.6mg/kg) considering the daily
consumption of 150 g and 20 g per adults (60 kg) and children (15 kg), respectively. Our results demonstrated that the consumption of tuna sushi may exceed 100% of PTWI.
©2016 Elsevier Ltd. All rights reserved.
1. Introduction
Fish is recognized as an important source of many essential nutrients and its consumption is widely encouraged to prevent hypertension, cancer and coronary heart disease (Sioen, Henauw, Verdonck, Thuyne, & Camp, 2007). However, fish can contain toxic elements in their tissues, such as Hg, and consequently may represent a source of human exposure to such components (Burger, Stern, & Gochfeld, 2005; Dorea & Barbosa, 2005; Morgano, Rabonato, Milani, Miyagusku,&Quintaes, 2014).
The effects of high exposure to Hg in humans include neuro-developmental deficits (JECFA, 2004; Steuerwald et al., 2000), poor cognitive performance (Freire et al., 2010; Oken et al., 2008), increased rates of cardiovascular disease (Choi et al., 2009), and neurological and locomotion deficits (Hightower&Moore, 2003; Hites, Carpenter, Hamilton, Knuth, & Schwager, 2004). The Na-tional Health and Nutrition Examination Survey estimates that
8e15% of fetuses in the USA have excessive exposure to Hg
(Trasande, Landrigan,&Schechter, 2005). Recently, the FDA (US
Food and Drug Administration) and EPA (US Environmental Pro-tection Agency) have advised pregnant women, those who may become pregnant, breastfeeding mothers, and young children to broaden the variety offish they eat and choose those lower in Hg, restrictingfish consumption to 2 or 3 servings/week (Burger, Stern, &Gochfeld, 2005).
Mercury can be found in the environment in various chemical species. All Hg species are considered toxic, but organic species such as methylmercury (MeHgþ) and ethylmercury are considered
more toxic than elemental Hg and its inorganic species. It is well recognized that the main pathway of human exposure to Hg is through eatingfish containing MeHgþ, which is the most common
Hg species found infish. Due to biomagnification along the food chain, MeHgþreaches maximum levels in
fish at the top of the food chain, and as a result, about 90% of the total Hg present infish can be found as MeHgþ(Horvat&Gibicar, 2005_ ).
An accurate analytical method for the determination of organic Hg species is required to assess the real toxicity of the samples (Harrington, 2000). The analysis of organic Hg is generally carried
*Corresponding author.
E-mail address:[email protected](M.A. Morgano).
Contents lists available atScienceDirect
Food Control
j o u r n a l h o m e p a g e :w w w . e l s e v i e r . c o m / l o c a t e / f o o d c o n t
out using chromatographic separation techniques coupled with different detectors (Zhang, Yang, Dong,& Xue, 2012). The
chro-matographic separation techniques include: gas chromatography (GC) (Barst et al., 2013; Kensova, Kruzíkova,&Svobodova, 2012; Nevado, Martín-Doimeadios, Bernardo, Moreno, Ropero, & de Marcos Serrano, 2011), liquid chromatography (HPLC) (Batista, Rodrigues, De Souza, Oliveira Souza,&Barbosa, 2011; Chen et al., 2013) and ionic chromatography (IC) (Shade &Hudson, 2005).
The most commonly used techniques are: inductively coupled plasma mass spectrometry (ICP-MS) (Batista et al., 2011; Clemens, Monperrus, Donard, Amouroux, &Guerin, 2011), atomic absorp-tion spectroscopy (AAS) (Naozuka&Nomura, 2011; Sarıca&Türker, 2012), atomicfluorescence spectrometry (AFS) (Nevado et al., 2011; Zhang et al., 2012), electron capture detection (ECD) (Kehrig et al., 2009; Kensova et al., 2012), microwave induced plasma-atomic emission spectrometry (MIP-AES) (Sanz, De Diego, Raposo, & Madariaga, 2003), atomic emission detection (Kuballa, Leonhardt, Schoeberl,&Lachenmeier, 2011) and isotope dilution mass
spec-trometry (IDMS) (Demuth&Heumann, 2001), and for the
deter-mination of total mercury, thermal decomposition amalgamation atomic absorption spectrometry (TDA AAS) (Morgano, Milani,& Perrone, 2015).
Japanese dishes usually include tuna of various species, salmon, eel, and many otherfish, as well as shrimp and crab, which may be consumed in sushi dishes as well as vegetarian varieties (Burger, Gochfeld, Jeitner, Donio,&Pittfield, 2013).
Sushi, technically referring tofish and other items served with vinegar and sticky rice (Nibble, 2012), has become a generic term often encompassing sashimi (rawfish) and several varieties offish surrounded by rice (maki rolls), and fish over rice (nigiri). The consumption of sushi and related dishes has recently increased greatly in Brazil and other countries, with these foods being available over lunch counters, grocery stores, especially restaurants and sushi bars (Martins, 2006). Although there is a growing trend for the consumption of sushi (Issenberg, 2007), there is very little quantitative data on either the consumption patterns of sushi or the contaminants in sushi (Lowenstein, Burger, Jeitner, Amato, Kolokotronis,&Gochfeld, 2010).
Regarding to the presence of methylmercury in sushi samples commercialized in Brazil Southwest, this work aims: i) to develop and validate a quick, simple, low cost method with minimal reagent consumption; ii) to quantify organic mercury (methylmercury) in sushi samples using the technique of thermal decomposition amalgamation atomic absorption spectrometry (TDA AAS); iii) to estimate the organic mercury intake from sushi consumption and iv) to delineate an organic extract stability study.
2. Materials and methods
2.1. Instrumentation
The technique of TDA AAS using a direct mercury analyzer (DMA-80, Dual Cell, Milestone, Sorisole, Italy) was used to quantify both the total and organic mercury content of sushi samples. The organic mercury extracts were obtained via microwave extraction (Start E, Milestone, Sorisole, Italy). The samples were heated in a nickel or quartz container, making use of compressed air as the oxidant gas. A catalyst removed the combustion products and the Hg vapors were trapped in a gold amalgamator. Temperatures around 850C were applied for desorption, and the Hg content was
quantified by determining the absorption at 253.7 nm.
2.2. Reagents and standards
Only analytical grade reagents were used in this study. The
water (18.2 M
U
cm) was purified using a reverse osmosis system (Gehaka, S~ao Paulo, Brazil) and the nitric acid using a sub-boiling distiller (Distillacid, Berghof, Eningen, Germany). Toluene (Synth, Diadema, Brazil) and a 30% HCl solution (Merck, Darmstadt, Ger-many) were used for the microwave extractions. A 2.5%L-cysteinesolution (Sigma, Steinheim, Germany) was prepared to stabilize the organic mercury species. Certified standard solutions of mercury at 1000 mg l 1(Fluka, Sigma Aldrich, Steinheim, Germany) were used to construct the analytical curves, together with a 0.5% (v/v) solu-tion of HNO3.
2.3. Samples
A total of 60 sushi samples were acquired from different Japa-nese restaurants and supermarkets located in Brazil Southwest (city of Campinas, S~ao Paulo state), with 20 samples each of the most consumed types of sushi: 20 samples of Yellowfin tuna (Thunnus albacares), 20 of salmon (Salmo salar) and 20 of kani (a mix offish speciesflavoring with crab meat). Yellowfin tuna came from the South and Southwest area of the coast of Brazil, which is included in FAOfishing area (Atlantic, Southwest). Salmon samples came from Chile coast, whilst kani were acquired from distribution centers located in the Southeast of Brazil.
The samples were separately triturated according to their spe-cie, taking a complete dish with all ingredients, using a domestic processor to obtain a homogenized mass. The homogeneous mass samples were kept under freezing until analyses. Sample portions weight was determined experimentally as, approximately, 150 g (6 pieces of sushi).
The contribution of each sushi component (seaweed, rice, kani, and/orfish) was determined in a previous work of our group. The obtained values were, in average: 65% of rice, 30% offish and/or kani and 5% of seaweed (Morgano et al., 2015).
2.4. Determination of total and organic mercury in the sushi samples
2.4.1. Determination of total mercury
For the determination of total mercury, the homogenized sam-ples were weighed directly into nickel containers and the value determined using TDA AAS. According toMorgano et al. (2015)the optimal conditions for the total mercury analysis were: drying process (200C for 60 s) and decomposition process (600C for
180 s), using a 60 mg sample.
2.4.2. Determination of organic mercury
The extraction method for the organic species present in sushi samples was developed using a certified reference material (CRM) with a certified MeHgþ value. The following parameters were
optimized: the extraction temperature employed in the system assisted by microwaves; the extraction time; the concentrations of theL-cysteine solution and the volume of organic solvent (toluene)
(Carbonell, Bravo, Fernandez,&Tarazona, 2009; Huang, Pan, Han, Wu, Tang, & Tan, 2012; Maggi, Berducci, Bianchi, Giani, & Campanella, 2009andRuiz-de-Cenzano, Rochina-Marco, Cervera, &de laGuardia, 2014).
The samples were subjected to closed extraction assisted by microwaves using an organic solvent (toluene) in an acid solution. A PFA teflon extraction vessel was weighed on an analytical balance and a 1 g aliquot of sample introduced, to which was added: 8 mL of toluene pa, 1 mL of demineralized water and 0.75 mL of a 30% (v/v) HCl solution. The vessels were sealed and transferred to a 1000 W microwave extractor which was programmed as follows: (a) room temperature to 110C in 10 min; (b) maintain a constant
a 4 mL aliquot of the organic phase withdrawn and transferred to a centrifuge tube containing 2 mL of a 2.5%L-cysteine solution (w/v).
After manual agitation, the solution was centrifuged for 6 min at 3500 rpm and the aqueous phase used for the analysis.
A DMA analyzer was used to determine the organic mercury fraction by measuring 100 mg of the aqueous phase containingL
-cysteine organic mercury into a quartz vial. The optimal reading conditions in the mercury analyzer were: sample drying temperature ¼ 120 C for 60 s; decomposition
temperature¼300C for 180 s; desorption temperature¼850C
for 12 s; absorbance determined at 253.7 nm. The ranges for the two detection cells of the equipment were: 0.5e20
m
g kg 1and20e1000
m
g kg 1.2.5. Stability of the organic mercury extracts
The stability of the organic extract was tested under two con-ditions: storage in polypropylene tubes under ambient (22C) and
refrigerated (4 C) conditions; and also in glass tubes under
ambient and refrigerated conditions. The determination continued for 22 days according to the amount of extract available.
2.6. Exposure risk assessment of methylmercury from the consumption of sushi
To estimate the exposure to organic mercury, the occasional consumption (1 portion/week) to the moderate consumption (7 portions/week) of sushi was considered:
Estimated exposure to methylmercury
¼ ½MeHgþi ðportion=body weightÞ;
where: [MeHgþ] (average and range concentration,
m
g kg 1);portion of 150 g and 20 g of sushi were considered for a 60 kg adult and a 15 kg child body weight (bw), respectively; the estimated exposure to methylmercury (
m
g kg 1bw 1).The maximum number of tolerated weekly portions for adults and for children was indicated by values above 100% of PTWI:
%PTWI¼100 ðEstimated exposure
to methylmercuryÞ=MeHgþPTWI
;
where MeHgþPTWI¼1.6
m
g kg 1bw (WHO, 2015).3. Results and discussion
3.1. Validation of the method for the determination of total and organic mercury
The method was validated based on theINMETRO (2011) rec-ommendations and consisted of evaluating the following: linearity of the analytical curves, accuracy (using certified reference mate-rials and recovery tests), sensitivity (detection and quantification limits) and the precision.
The evaluation of linearity was assessed by the regression co-efficients of the analytical curves obtained for the two mercury analyzer cells. For both concentration ranges (low: 0.5e20
m
g kg 1,and high: 20e1000
m
g kg 1), satisfactory values were observed,with r2>0.999.
The sensitivity of the method was evaluated by analyzing a sushi sample with low mercury content, carrying out seven analytical repetitions. The values obtained for organic and total mercury were: LOD (3 s) of 2.0
m
g kg 1 and 0.4m
g kg 1; LOQ(10 s)¼6.6
m
g kg 1 and 1.4m
g kg 1, respectively;“s”being thestandard deviation value for the concentrations of seven replicates. These values were lower than those reported byKuballa, Moellers, Schoeberl, and Lachenmeier (2011)who used the GC-MS method to study MeHgþlevels infish samples, obtaining values of 6.0
m
g kg 1and 20
m
g kg 1 for LOD and LOQ, respectively.Cheng and Hight (2008) analyzed MeHgþ using the HPLC-ICP-MS, and alsoobserved higher values than those obtained in this study (3.8
m
g kg 1and 28m
g kg 1for LOD and LOQ, respectively).Wang et al. (2013) comparing two methods (HPLC-ICP-MS and GC-MS using isotope dilution, ID-GC-MS) to study MeHgþ, obtained thefollowing LOD and LOQ values: 5 ng g 1 and 15 ng g 1; and 3.4 ng g 1and 10.2 ng g 1, respectively.
Regarding the determination of MeHgþin biological samples,
Maggi et al. (2009)used an extraction solution containing a HBr/ toluene andL-cysteine mixture, with detection by TDA AAS. Despite
obtaining lower values for LOD and LOQ (1.5 ng g 1and 2.5 ng g 1, respectively), the sample preparation method was applied using two extraction stages and a large amount of chemical reagents: about 35 mL of toluene and 10 mL of concentrated HBr. In the method proposed here, smaller solvent volumes were used and only one extraction step.
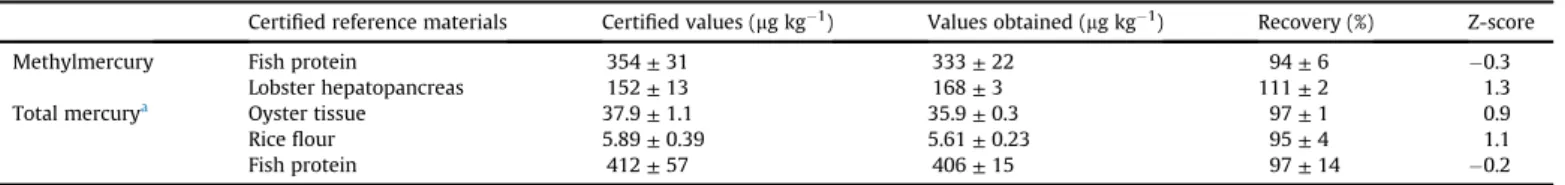
The accuracy of the MeHgþmethod was assessed using certi fied reference materials (NRC TORT-2 lobster hepatopancreas and NCR DORM-4 fish protein) and recovery trials at three levels. In our previous study (Morgano et al., 2015), accuracy for total mercury method was evaluated using three certified reference materials with similar compositions to the sushi samples: NIST SRM 1568b rice flour, NIST SRM 1566b oyster tissue and NCR DORM-4fish protein.Table 1summarizes the obtained results.
As shown inTable 1, the recovery ranged between 94 and 111% for methylmercury, consistent with the recommendations of the
AOAC (2013), where the values are between 75 and 120% for this level of concentration. In addition, the values for the z-scores were calculated from the experimental data, and both CRMs demon-strated satisfactory values (less than 2.0) according to those rec-ommended byINMETRO (2011).
Recovery trials for organic Hg were also carried out. For this evaluation, a sushi sample with low organic mercury content was fortified at three different levels: 10, 100 and 1000
m
g kg 1 ofmethylmercury, using solutions prepared from the salt of this specie (Sigma Aldrich, Steinheim, Germany). The values obtained in (
m
g kg 1) were: 11.1±0.2; 94±4 and 964±67 respectively; which correspond to recoveries of 111%, 94% and 96%. Thus the values observed ranged between 94 and 111%, consistent with theAOAC (2013).In order to verify the absence of interconversion between inorganic and organic mercury, the sushi sample was fortified with 100
m
g kg 1of a standard solution containing only inorganicmer-cury (i-Hg). The result obtained was below the limit of quantifi ca-tion of the method and therefore it could be concluded that interconversion between the Hg species did not occur.
The precision of the method for MeHgþwas evaluated using 16
analytical repetitions (8 repetitions/day) from a sample of tuna sushi (organic Hg¼192±17
m
g kg 1). The value obtained for thecoefficient of variation was 9.0%, which satisfies the condition recommended by theAOAC (2013), which is 16% in the concen-tration range studied. The total Hg coefficient of variation was 5.5% (Morgano et al., 2015).
3.2. Assessing the stability of the organic extract
organic extract was performed considering both glass and poly-propylene tubes. InFig. 1the observed results are presented.
Fig. 1demonstrates that when the organic extract was stored in a glass tube and kept at ambient conditions, its stability is signifi -cant for up to 21 days. In the present study a gradual reduction of methylmercury was observed after 22 days of refrigerated storage in a brown glass bottle.
The extraction method used byHouserova et al. (2006)was also based on a high-pressure microwave system, making use of 6 mol/l HCl þ 0.1 mol/l NaCl as the extraction agent. The researchers verified that the organic extracts remained stable for 3 days under
ambient conditions, using 20 mL of solvent, repeating the extrac-tion procedure twice, and storing in new polypropylene tubes with caps (Ruiz-de-Cenzano et al., 2014). The present results also showed that the extract kept in glass and stored under refrigeration showed similar stability to that at room temperature up to the 11th day, after which a drop of approximately 10% of the organic Hg concentration was observed. Therefore it was concluded that the longer the storage time of the organic extract, the greater the propensity of the mercury content to decrease in solution. In addition, wide variations between replicates were observed with increase in the storage time of the extract.
Similar assays were carried out with the storage of the organic extracts in polypropylene tubes (Corning, New York, USA - PP) under ambient and refrigerated conditions. The graph presented in
Fig. 1shows that refrigerated storage resulted in a higher relative stability profile, where the extract was stable for 22 days (the entire analytical period), whereas the extract maintained at room tem-perature proved to be as stable as the one submitted to refrigera-tion for 14 days, after which it showed a decline of approximately 7% in the organic Hg content, corroborating with studies on the possibility of the adsorption of Hg on plastic containers used for storage purposes (Houserova et al., 2006).
3.3. Results obtained for the samples
The JointFAO/WHO (2011)Expert Consultation on the Risks and Benefits of Fish Consumption concluded that amongst women of childbearing age, pregnant women and nursing mothers, when considering the benefits of docosahexaenoic acid (DHA) versus the risks of methylmercury, fish consumption lowered the risk of suboptimal neurodevelopment in their offspring compared to not eatingfish under most of the circumstances evaluated. More spe-cifically it was concluded that even considering the highest esti-mate for the methylmercury risk, the neurodevelopmental risks of not eatingfish exceeded the risks of eatingfish for up to at least seven 100 g servings per week for allfish containing less than 0.5
m
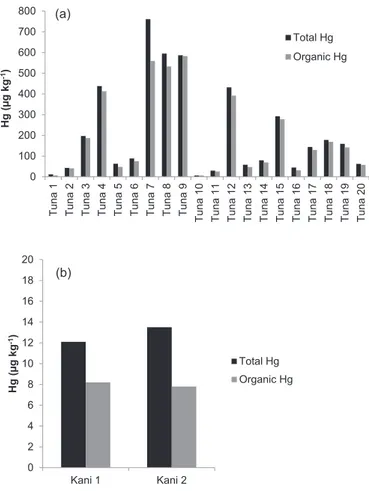
g/g (mg/kg) methylmercury (WHO, 2015).Table 2shows the results obtained for total (tHg), inorganic (iHg) and organic (oHg) mercury present on the samples and the ratios of oHg/tHg and iHg/tHg. For organic mercury, the assessment was carried out for those samples with values greater than 6.6
m
g kg 1of total mercury, which corresponds to the LOQ of theoHg method. Levels below the limit of quantification of the methods were not considered to the average calculation.
Of the 20 tuna sushi samples analyzed, a broad concentration range was observed for organic mercury: >6.6e583
m
g kg 1(Table 2). This result was possibly due to the origin and age of the
fish. In the study ofBurger et al. (2013), sushi samples containing eel, salmon, crab and tuna were analyzed and significant differ-ences in mercury levels amongst the types and components of the sushi were found, with tuna sushi having the highest levels and eel, crab, and salmon having lower levels. In this study, the levels in the tuna rolls averaged 470
m
g kg 1.For what concerns tuna fish, literature reported similar
Table 1
Accuracy evaluation of the analytical methods using certified reference materials for MeHgþand total mercury (n¼3).
Certified reference materials Certified values (mg kg 1) Values obtained (mg kg 1) Recovery (%) Z-score
Methylmercury Fish protein 354±31 333±22 94±6 0.3
Lobster hepatopancreas 152±13 168±3 111±2 1.3
Total mercurya Oyster tissue 37.9±1.1 35.9±0.3 97±1 0.9
Riceflour 5.89±0.39 5.61±0.23 95±4 1.1
Fish protein 412±57 406±15 97±14 0.2
aMorgano et al. (2015).
concentrations for total Hg: a mean of 390
m
g kg 1was found in astudy of three important commercially marinefishes in Sri Lanka. Thefish species analyzed were yellowfin tuna (Thunnus albacores), swordfish (Xiphias gladius) and red snapper (Lutjanussp) (Jinadasa, Rameesha, Edirisinghe,&Rathnayake, 2010).
The groups of Ordiano-Flores, Galvan-Maga~na, and Rosiles-Martínez (2011) and Olmedo, Pla, Hernandez, Barbier, Ayouni,
and Gil (2013)performed an Hg evaluation in yellowfin tuna (T. albacares) muscle in different sites of Pacific Ocean and Spain coasts. They obtained mean Hg values of 210
m
g kg 1 and470
m
g kg 1, respectively. Martorell, Perello, Martì-Cid, Llobet, Castell, and Domingo (2011)studying the diet intake of Catalonia population (Spain) found Hg levels in tunafish of 554 mg kg 1.A mean concentration of 350
m
g kg 1for Hg in tunafish was alsoTable 2
Total (tHg), organic (oHg) and inorganic (iHg) mercury levels observed in the sushi samples analyzed.
Sample tHg (mg kg 1) oHga(mg kg 1) oHg/tHg (%) iHg (mg kg 1) iHg/tHg (%)
Tuna 1 11.8±0.1 <6.6 e e e
Tuna 2 43±1 41±1 95 2 5
Tuna 3 197±7 187±14 95 10 5
Tuna 4 438±10 413±18 94 25 6
Tuna 5 63±3 48±2 76 15 24
Tuna 6 88±6 75±2 85 14 16
Tuna 7 761±67 559±2 73 202 27
Tuna 8 595±51 533±14 90 62 10
Tuna 9 587±13 583±6 99 4 1
Tuna 10 6.2±0.4 <6.6 e e e
Tuna 11 30±3 26±1 87 4 13
Tuna 12 432±33 392±7 91 40 9
Tuna 13 58±2 47±3 81 11 19
Tuna 14 80.3±0.2 69±5 86 11 14
Tuna 15 292±17 278±15 95 14 5
Tuna 16 45±3 31±4 69 14 31
Tuna 17 144±14 130±8 90 14 10
Tuna 18 178±1 169±3 95 9 5
Tuna 19 159±8 142±3 89 17 11
Tuna 20 62±2 57±2 92 5 8
Kani1 12±1 8±1 67 4 33
Kani2 13.5±0.8 7.8±0.4 58 5.7 42
Kani 3 <1.4 e e e e
Kani 4 <1.4 e e e e
Kani 5 2.8±0.8 e e e e
Kani 6 2.3±0.1 e e e e
Kani 7 3.4±0.4 e e e e
Kani 8 9.6±0.7 <6.6 e e e
Kani 9 9.4±1.1 <6.6 e e e
Kani 10 5.5±0.8 e e e e
Kani 11 11.4±1.2 <6.6 e e e
Kani 12 4.5±0.3 e e e e
Kani 13 7.9±0.4 <6.6 e e e
Kani 14 6.6±1.1 e e e e
Kani 15 10.5±0.9 <6.6 e e e
Kani 16 4.5±0.2 e e e e
Kani 17 5.8±0.1 e e e e
Kani 18 9.8±1.2 <6.6 e e e
Kani 19 6.3±1.3 e e e e
Kani 20 3.4±0.3 e e e e
Salmon 1 3.2±0.3 e e e e
Salmon 2 3.1±0.3 e e e e
Salmon 3 4.6±0.4 e e e e
Salmon 4 3.1±0.4 e e e e
Salmon 5 2.7±0.3 e e e e
Salmon 6 1.4±0.2 e e e e
Salmon 7 3.8±0.3 e e e e
Salmon 8 3.1±0.2 e e e e
Salmon 9 3.0±0.4 e e e e
Salmon 10 1.9±0.1 e e e e
Salmon 11 2.6±0.5 e e e e
Salmon 12 3.1±0.4 e e e e
Salmon 13 1.7±0.2 e e e e
Salmon 14 1.5±0.1 e e e e
Salmon 15 4.1±0.2 e e e e
Salmon 16 3.7±1.0 e e e e
Salmon 17 2.8±0.1 e e e e
Salmon 18 <1.4 e e e e
Salmon 19 <1.4 e e e e
Salmon 20 3.1±0.3 e e e e
observed byGalimberti, Corti, Cressoni, Moretti, Menotta, Galli, and Cambiaghi (2016), which developed an assessment elements (Hg, Cd, Pb) infishery products andfish imported in North Italy, from extra-European Union Countries.
Sushi samples present different mercury levels: tuna>kani>salmon. These results are comparable with studies of other authors concerning to predatoryfishes, such as tuna. These species are present in marine pelagic ecosystems at the top of food chain and they tend to accumulate great quantities of Hg. Regarding the ratio (in percent) between the organic and total mercury for tuna sushi, values of 69e99% were observed, with an average of
88%. This result is higher than those reported by Kuballa et al. (2011) who found a ratio of 70%, and it is consistent with the study ofBurger et al. (2013)who presented a ratio of 90% between the organic and total mercury. Regarding the levels of methyl-mercury,Burger et al. (2013)found an average value of 600
m
g kg 1in tuna sushi;Bosch, O’Neill, Sigge, Kerwarth, and Hoffman (2016)
found values ranging from 230 to 1024
m
g kg 1 in tuna muscle,whereas in this work a mean of 560
m
g kg 1was determined.The inorganic mercury (i-Hg) values were calculated as the difference between the total and organic mercury levels, with values between 2 and 202
m
g kg 1for tuna sushi and 4e5.7m
g kg 1for kani sushi in the present study. The ratios, in percent, between the total and inorganic levels ranged from 1 to 31% and 33e42% for
the tuna and kani sushi, respectively. For the kani sushi samples, values near to 8
m
g kg 1were also found for the organic mercuryconcentration, with a ratio corresponding to an average of 63% of the total mercury present in these samples (Fig. 2). There is no available data in the literature about mercury species in kani.
For salmon sushi, the inorganic mercury content was not calculated since the organic mercury levels were below the method limit of quantification (6.6
m
g kg 1). In our study, the mean value oftotal mercury was 2.9
m
g kg 1for this sushi type. In literature arevery few data regarding to sushi samples. Data for the presence of total Hg in pink and red canned salmon samples from the United States, showed levels of 22e79 and 15e67
m
g kg 1, respectively(Ikem&Egiebor, 2005). Low values were verified forZhang, Naidu, Kelley, Jeewett, Dasher, and Duff (2001), which observed Hg values varying from 25 to 137
m
g kg 1for salmon. In a previous study ofour group (Morgano et al., 2014) performed in samples marketed in Brazil, total Hg levels in salmon sashimi (S. salar) ranging from 10 to 20
m
g kg 1. These values are higher than levels of this study: levelsranged from no detected to 2.9
m
g kg 1.3.4. Estimation of the daily intake of methylmercury from the consumption of sushi and the exposure risk assessment
The estimated exposure to organic mercury was calculated considering a consumption of sushi: 150 g (for adults), value experimentally obtained by weighing the commercially available sushi and 20 g (for children), considering a minor portion. A number of sushi consumption situations were considered: occa-sional consumption (1 portion/week) ranging to moderate con-sumption (7 portions/week). In order to enable a comparison with the PTWI values established for MeHgþ, some considerations were
admitted:
- As methylmercury (MeHgþ) is the main organic chemical
specie infish, the organic mercury content was considered as MeHgþ;
- For kani sushi samples with MeHgþ<6.6
m
g kg 1(LOQ methodfor organic mercury) the values for MeHgþ were estimated
based on the average proportion (63%) determined experi-mentally for kani sushi samplese“Kani 1” and“Kani 2”(see Table 2);
- For salmon sushi samples with MeHgþ <6.6
m
g kg 1 (LOQmethod for organic mercury), the MeHgþlevels were estimated using reported data in literature (Zhang et al., 2001). In this study salmon muscles were analyzed and the average propor-tion obtained for MeHgþcontent was of 78%.
The values estimated for exposure are shown inTable 3, where it can be seen that the tuna sushi samples had significant MeHgþ
values: considering the weekly consumption of one portion of this sushi, average and maximum values of 0.50
m
g kg 1 bw (bodyweight) and 1.25
m
g kg 1 bw were estimated for adults,corre-sponding to 31% and 91% of the Provisional Tolerable Weekly Intake (PTWI), respectively. For the consumption of 4 servings, the average and maximum values exceeded 100% of the PTWI established for MeHgþ: 121% and 352%, respectively. Low values were estimated for the kani and salmon sushi varieties: a weekly consumption of 7 servings of these sushi could contribute up to 8.0% and 3.8%, respectively.
Values established by the World Health Organization for the PTWI (1.6
m
g kg 1) were used considering adults (60 kg) andchil-dren (15 kg; age 2e6 years), according toFAO/WHO (2011)
rec-ommendations. In theTable 3a sushi portion of 150 g and 20 g was considered for adults and children, respectively. For children, the weekly consumption of seven potions of tuna sushi exceeds the PTWI for MeHgþby 100%.
Therefore, divulging of the data concerning the high methyl-mercury levels and its toxicity is extremely important with respect to tuna sushi consumption by children, since the habit of eating
fish, especially rawfish, has increased significantly and is increasing
0 100 200 300 400 500 600 700 800
Tuna 1 Tuna 2 Tuna 3 Tuna 4 Tuna 5 Tuna 6 Tuna 7 Tuna 8 Tuna 9
Tuna 10 Tuna 11 Tuna 12 Tuna 13 Tuna 14 Tuna 15 Tuna 16 Tuna 17 Tuna 18 Tuna 19 Tuna 20
Hg (
μ
g kg
-1)
Total Hg
Organic Hg
0 2 4 6 8 10 12 14 16 18 20
Kani 1 Kani 2
Hg (
μ
g kg
-1)
Total Hg
Organic Hg
(a)
(b)
in popularity in other countries besides Japan (Yano, Yokoyama, Satomi, Oikawa,&Chen, 2004). Thus the contaminants infish su-shi, as well as the health benefits, need to be considered when examining the risks and benefits offish consumption.
The work developed byBurger et al. (2013)used the common risk assessment default assumption of a 70 kg male for the EPA's default risk guidance. The mean daily intake assuming a 60 kg body weight (bw) varied around values of 0.34
m
g/kg/day, which isgreater than the threshold oral reference dose published by the
USEPA (2015)of 0.1
m
g/kg/day, based on the neurodevelopmentaleffects of methylmercury, and also that published by the Agency for Toxic Substances and Disease Research, who indicated a minimum risk level of 0.3
m
g/kg/day (ATSDR, 1999). Nevertheless, theesti-mated exposure for children was not evaluated.
Estimating the mercury exposure from sushi is complex. This task is closely related to the eating habits of people from different regions, ethnicity, income, and also as a function of the number of
fish-sushi meals per month, number offish-sushi pieces per meal, and hence the number offish-sushi pieces per month. An interview carried out by Burger et al. (2013) in a New Jersey university community regarding fish and sushi consumption, showed that 77% of the community consumed sushi (mean ¼ 3.27 meals/ month). Caucasians and Asians ate more sushi meals/month, and more sushi pieces/meal than other ethnicities, with East Asians eating more than South Asians. In the same study it was reported that some people in all ethnic groups ate more than 40fish-sushi pieces/month. This data suggests that East Asians and Caucasians are more at risk from mercury in fish than other ethnic groups because of their sushi consumption patterns. Despite most of Jap-anese meals are composed by numerous fish species, sushi is generally composed by just one. Therefore, it is important to aware regular consumers of this dish regarding to mercury exposure, especially categories considered“vulnerable”, as young children, pregnant and breastfeeding women to include a wide range offish species in their diet, as well to control the consumption of tuna sushi.
4. Conclusion
The method developed for organic mercury using a system assisted by microwaves and TDA AAS was successfully applied to the sushi samples, agreeing to the concepts of“green chemistry”, with high extraction efficiency and a reduction in the risk of contamination and loss when compared with conventional methods in open systems. There was no interconversion between the inorganic and organic chemical species of mercury under the analytical conditions used. From the studies carried out to assess the organic extract stability, it could be seen that the organic fractions suffered no significant variation for three weeks when stored in glass tubes and held under either ambient or refrigerated conditions.
The study revealed that samples of salmon and kani sushi had low values of Hg whilst tuna sushi presented the highest overall levels of total and organic Hg, with an average proportion of organic Hg/total Hg of 88%, indicating that the most toxic form of mercury (organic) predominated in this food. The evaluation of exposure to MeHgþfrom sushi consumption was performed for adults and children: while for kani and salmon sushi the contri-bution for PTWI was insignificant; four portions (600 g) of tuna sushi could contribute 100% of the PTWI for MeHgþfor adult and for children (one of the most susceptibility groups) seven por-tions (140 g) of tuna sushi was sufficient to exceed 100% of the PTWI.
The present results highlighted the importance of including sushi consumption in risk assessments forfish intake and mercury exposure. People who eatfish frequently (more than once a week), young children, pregnant and breastfeeding women, should choose wisely and include a wide range offish species in their diet.
Acknowledgments
The authors acknowledge the financial support of FAPESP (process 2012/50667-9) and CNPq (process 442025/2014-9). E. L.
Table 3
Estimated exposure to methylmercury (average and range), assuming the consumption of 1e7 weekly sushi portions by a 60 kg adult and a 15 kg child.
Sushi Portion/week Adultsc Childrend
MeHgþe(mg kg 1bw) %PTWI MeHgþe(mg kg 1bw) %PTWI
Tuna 1 0.50 (<0.09e1.25) 31 (<6e91) 0.2 (<0.03e0.8) 17 (<1.9e47) 2 0.91 (<0.19e2.50) 60 (<12e176) 0.5 (<0.06e1.6) 29 (<3.7e97) 3 1.41 (<0.27e3.75) 92 (<18e264) 0.8 (<0.11e2.1) 44 (<5.6e146) 4 1.91 (<0.36e5) 121 (<25e352)e 1.1 (<0.14e2.7) 58 (<7.5e194) 5 2.32 (<0.47e6.25) 157 (<30e477) 1.3 (<0.17e3.3) 73 (<9.3e242) 6 2.88 (<0.54e7.5) 186 (<36e568) 1.6 (<0.20e4.0) 87 (<11.2e291) 7 3.33 (<0.66e8.75) 216 (<41e657) 1.9 (<0.23e4.8) 102 (<13.1e340) Kania 1 0.011 (<0.019
e0.020) 0.71 (<0.1e1.1) 0.01 (<0.0001e0.003) 0.38 (<0.01e0.7) 2 0.022 (<0.004e0.036) 1.42 (<0.2e2.3) 0.02 (<0.0003e0.005) 0.76 (<0.03e1.3) 3 0.033 (<0.006e0.054) 2.13 (<0.3e3.3) 0.03 (<0.0004e0.008) 1.14 (<0.04e2.0) 4 0.044 (<0.008e0.072) 2.84 (<0.4e4.2) 0.04 (<0.0005e0.010) 1.52 (<0.05e2.5) 5 0.055 (<0.009e0.091) 3.55 (<0.6e5.7) 0.05 (<0.0007e0.013) 1.90 (<0.07e3.2) 6 0.066 (<0.01e0.108) 4.26 (<0.7e6.8) 0.06 (<0.0008e0.015) 2.28 (<0.08e3.7) 7 0.077 (<0.013e0.128) 4.97 (<0.8e8.0) 0.07 (<0.0009e0.018) 2.66 (<0.09e4.4) Salmonb 1 0.006 (<0.001
e0.015) 0,35 (<0.1e0.4) 0.003 (<0.0001e0.001) 0.19 (<0.01e0.5) 2 0.012 (<0.007e0.021) 0,70 (<0.7e1.0) 0.009 (<0.0002e0.002) 0.38 (<0.04e1.0) 3 0.018 (<0.013e0.027) 1.1 (<1.3e1.6) 0.015 (<0.0003e0.003) 0.57 (<0.05e1.5) 4 0.024 (<0.019e0.033) 1.4 (<1.9e2.2) 0.021 (<0.0004e0.004) 0.76 (<0.08e2.0) 5 0.030 (<0.025e0.039) 1.7 (<2.5e2.8) 0.027 (<0.0005e0.005) 0.95 (<0.09e2.5) 6 0.036 (<0.031e0.045) 2.1 (<3.1e3.4) 0.033 (<0.0006e0.006) 1.14 (<0.11e3.0) 7 0.042 (<0.037e0.051) 2.4 (<3.7e4.0) 0.039 (<0.0007e0.007) 1.33 (<0.12e3.5)
PTWI: provisional tolerable weekly intake for MeHgþ¼1.6mg kg 1bw (body weight) (WHO, 2015). aFor non analyzed samples, values were estimated from the experimental data (63%).
b Estimated values based on literature available data (78%) (Zhang et al., 2001).
c Assuming a value of 60 kg for the weight of an adult (WHO, 2009).
d Assuming the value of 15 kg for the weight of a child (WHO, 2009).
Paiva and J. C. Alves acknowledge CAPES and B. S. Boer acknowledge CNPq for the fellowships.
References
AOAC. (2013).Association of official agricultural chemists. Guidelines for single labo-ratory validation of chemical methods for dietary supplements and botanicals. ATSDReAgency for Toxic Substances and Disease Registry. (1999). Available from:
http://app2.erg.com/registration/index.htm. Accessed 15.10.15.
Barst, B. D., Hammerschmidt, C. R., Chumchal, M. M., Muir, D. C., Smith, J. D., Roberts, A. P., et al. (2013). Determination of mercury speciation infish tissue with a direct mercury analyzer.Environmental Toxicology and Chemistry, 32(6), 1237e1241.
Batista, B. L., Rodrigues, J. L., De Souza, S. S., Oliveira Souza, V. C., & Barbosa, F., Jr. (2011). Mercury speciation in seafood samples by LC-ICP-MS with a rapid ultrasound-assisted extraction procedure: application to the determination of mercury in Brazilian seafood samples.Food Chemistry, 126(4), 2000e2004. Bosch, A. C., O'Neill, B., Sigge, G. O., Kerwarth, S. E., & Hoffman, L. C. (2016). Mercury
accumulation in Yellowfin tuna (Thunnus albacares) with regards to muscle type, muscle position andfish size.Food Chemistry, 190, 351e356.
Burger, J., Gochfeld, M., Jeitner, C., Donio, M., & Pittfield, T. (2013). Sushi con-sumption rates and mercury levels in sushi: ethnic and demographic differ-ences in exposure.Journal of Risk Research, 16(8), 1057e1075.
Burger, J., Stern, A. H., & Gochfeld, M. (2005). Mercury in commercialfish: opti-mizing individual choices to reduce risk.Environmental Health Perspectives, 113(3), 266e271.
Carbonell, G., Bravo, J. C., Fernandez, C., & Tarazona, J. V. (2009). A new method for total mercury and methylmercury analysis in muscle of seawaterfish.Bulletin of Environmental Contamination Toxicology, 83, 210e213.
Chen, X., Han, C., Cheng, H., Wang, Y., Liu, J., Xu, Z., et al. (2013). Rapid speciation analysis of mercury in seawater and marinefish by cation exchange chroma-tography hyphenated with inductively coupled plasma mass spectrometry. Journal of Chromatography A, 1314, 86e96.
Cheng, J.,&Hight, C. S. (2008). High performance liquid chromatographic-induc-tively coupled plasma-mass spectrometric determination of methylmercury and total mercury in seafood. Elemental Analysis Manual for Food Related Products, section 4.8, version 1. http://www.fda.gov/downloads/Food/ FoodScienceResearch/LaboratoryMethods/UCM479981.pdfAccessed 25.04.16. Choi, A. L., Budtz-Jorgensen, E., Jorgensen, P. J., Salonen, J. T., Tuomainen, T.,
Murata, K., et al. (2009). Methylmercury exposure and adverse cardiovascular effects in Faroese whaling men.Environmental Health Perspectives, 117, 367e372. Clemens, S., Monperrus, M., Donard, O. X., Amouroux, D., & Guerin, T. (2011). Mercury speciation analysis in seafood by species-specific isotope dilution: method validation and occurrence data.Analytical and Bioanalytical Chemistry, 401(9), 2699e2711.
Demuth, N., & Heumann, K. G. (2001). Validation of methylmercury determinations in aquatic systems by alkyl derivatization methods for GC analysis using ICP-IDMS.Analytical Chemistry, 73(16), 4020e4027.
Dorea, J. G., & Barbosa, A. C. (2005). Fish consumption and blood mercury: proven health benefits or probable neurotoxic risk.Regulatory Toxicology and Pharma-cology, 42(2), 249e250.
FAO/WHO. (2011).Report of the joint expert consultation on the risks and benefits of
fish consumption. Rome: FAO Fishery and Aquaculture Report.
Freire, C., Ramos, R., Lopez-Expinosa, M., Diez, S., Vioque, J., Ballester, F., et al. (2010). Hair mercury levels,fish consumption, and cognitive development in preschool children from Granada, Spain.Environmental Research, 110, 96e104.
Galimberti, C., Corti, I., Cressoni, M., Moretti, V. M., Menotta, S., Galli, U., et al. (2016). Evaluation of mercury, cadmium and lead levels infish andfishery products imported by air in North Italy from extra-European Union Countries.Food Control, 60, 329e337.
Harrington, C. F. (2000). The speciation of mercury and organomercury compounds by using high-performance liquid chromatography.Trends in Analytical Chem-istry, 19(2), 167e179.
Hightower, J. M., & Moore, D. (2003). Mercury levels in high-end consumers offish. Environmental Health Perspective, 111(4), 604e608.
Hites, R. A., Foran, J. A., Carpenter, D. O., Hamilton, M. C., Knuth, B. A., & Schwager, S. J. (2004). Global assessment of organic contaminants in farmed salmon.Science, 303(5655), 226e229.
Horvat, M., & Gibicar, D. (2005). Speciation of mercury: environment, food, clinical,_
and occupational health. InHandbook of elemental speciation IIeSpecies in the
environment, food, medicine and occupational health(pp. 281e304). Chichester, West Sussex, England: John Wiley&Sons Ltd.
Houserova, P., Kuban, V., Spurny, P., & Habarta, P. (2006). Determination of total mercury and mercury species infish and aquatic ecosystems of Moravian rivers. Veterinarni Medicina, 51(3), 101e110.
Huang, Z., Pan, X.-D., Han, J.-L., Wu, P.-G., Tang, J., & Tan, Y. (2012). Determination of methylmercury in marinefish from coastal areas of Zhejiang, China.Food Ad-ditives&Contaminants: Part B: Surveillance, 5(3), 182e187.
Ikem, A., & Egiebor, N. O. (2005). Assessment of trace elements in cannedfishes (mackerel, tuna, salmon, sardines and herrings) marketed in Georgia and Ala-bama (United States of America).Journal of Food Composition and Analysis, 18(8), 771e787.
INMETRO. (2011). Instituto Nacional de Metrologia, Normalizaç~ao e Qualidade
Industrial. Orientaçao Sobre Validaç~ ~ao de Metodos Analíticos. DOQ-CGCRE-008. Rev.: 04(pp. 1e20).
Issenberg, S. (2007).The sushi economy: Globalization and the making of a modern delicacy. New York: Penguin Gotham Books.
JECFA. (2004). Safety evaluation of certain food additives and contaminants. InJoint FAO/WHO Expert committee on food additives(pp. 132e139). Geneva: World Health Organization.
Jinadasa, B. K. K. K., Rameesha, L. R. S., Edirisinghe, E. M. R. K. B., & Rathnayake, R. M. U. S. K. (2010). Mercury, cadmium and lead levels in three commercially important marinefish species of Sri Lanka.Sri Lanka Journal of Aquatic Sciences, 15, 39e43.
Kehrig, H. D. A., Seixas, T. G., Palermo, E. A., Baeta, A. P., Castelo-Branco, C. W.,^
Malm, O., et al. (2009). The relationships between mercury and selenium in plankton andfish from a tropical food web.Environmental Science and Pollution Research, 16(1), 10e24.
Kensova, R., Kruzíkova, K., & Svobodova, Z. (2012). Mercury speciation and safety of fish from importantfishing locations in the Czech Republic.Czech Journal of Food Science, 30(3), 276e284.
Kuballa, T., Moellers, M., Schoeberl, K., & Lachenmeier, D. W. (2011). Survey of methylmercury infish and seafood from the southwestern German market. European Food Research and Technology, 232(4), 737e742.
Lowenstein, J. H., Burger, J., Jeitner, C. W., Amato, G., Kolokotronis, S.eO., & Gochfeld, M. (2010). DNA barcodes reveal species-specific mercury levels in tuna sushi that pose a health risk to consumers.Biology Letters, 6, 692e695. Maggi, C., Berducci, M. T., Bianchi, J., Giani, M., & Campanella, L. (2009).
Methyl-mercury determination in marine sediment and organisms by direct Methyl-mercury analyser.Analytica Chimica Acta, 641(1), 32e36.
Martins, F. O. (2006).Assessment of hygienic and sanitary quality of preparations (sushi and sashimi) based on rawfish served in buffets in the city of S~ao Paulo. S~ao Paulo, Brazil: M. Se. Dissertation. Faculdade de Saúde Pública, 142pp. Martorell, I., Perello, G., Martì-Cid, R., Llobet, J. M., Castell, V., & Domingo, J. L. (2011).
Human exposure to arsenic, cadmium, mercury, and lead from foods in Cata-lonia, Spain: temporal trend.Biological Trace Element Research, 14(3), 309e322. Morgano, M. A., Milani, R. F., & Perrone, A. M. (2015). Determination of total mer-cury in sushi samples employing direct mermer-cury analyzer.Food Analytical Methods, 8(3), 2301e2307.
Morgano, M. A., Rabonato, L. C., Milani, R. F., Miyagusku, L., & Quintaes, K. D. (2014). As, Cd, Cr, Pb and Hg in seafood species used for sashimi and evaluation of dietary exposure.Food Control, 36(1), 24e29.
Naozuka, J., & Nomura, C. S. (2011). Total determination and direct chemical speciation of Hg infish by solid sampling GF AAS.Journal of Analytical Atomic Spectrometry, 26(11), 2257e2262.
Nevado, J. B., Martín-Doimeadios, R. R., Bernardo, F. G., Moreno, M. J., Ropero, M. P., & de Marcos Serrano, A. (2011). Mercury speciation infish tissues from a Mediterranean river basin: the Tagus river (central Spain) as a case study. Ar-chives of Environmental Contamination and Toxicology, 61(4), 642e652. Nibble. (2012).Types of sushi&sashimi: And a glossary of sushi&sashimi terms.
Available from: http://www.thenibble.com/reviews/main/fi sh/seafood/sushi-glossary.aspAccessed 17.09.15.
Oken, E., Radesky, J. S., Wright, R. O., Bellinger, D. C., Amarasiriwardena, C. J., Kleinman, K. P., et al. (2008). Maternalfish intake during pregnancy, blood mercury levels, and child cognition at age 3 years in a US cohort.American Journal of Epidemiology, 167(10), 1171e1181.
Olmedo, P., Pla, A., Hernandez, A. F., Barbier, F., Ayouni, L., & Gil, F. (2013). Deter-mination of toxic elements (mercury, cadmium, lead, tin and arsenic) infish and shellfish samples. Risk assessment for the consumers.Environmental In-ternational, 59, 63e72.
Ordiano-Flores, A., Galvan-Magana, F., & Rosiles-Martínez, R. (2011). Bio-~
accumulation of Hg in muscle tissue of yellowfin tuna,Thunnus albacares, of the eastern Pacific Ocean.Biological Trace Element Research, 144(1), 606e620. Ruiz-de-Cenzano, M., Rochina-Marco, A., Cervera, M. L., & de laGuardia, M. (2014).
Speciation of methylmercury in market seafood by thermal degradation, amalgamation and atomic absorption spectroscopy.Ecotoxicology and Environ-mental Safety, 107, 90e96.
Sanz, J., De Diego, A., Raposo, J., & Madariaga, J. (2003). Routine analysis of mercury species using commercially available instrumentation: chemometric optimi-zation of the instrumental variables.Analytica Chimica Acta, 486(2), 255e267. Sarıca, D. Y., & Türker, A. R. (2012). Speciation and determination of inorganic
mercury and methylmercury by headspace single drop microextraction and electrothermal atomic absorption spectrometry in water andfish.CLEAN-Soil, Air, Water, 40(5), 523e530.
Shade, C. W., & Hudson, R. J. M. (2005). Determination of MeHgþin environmental sample matrices using Hg-thiourea complex ion chromatography with online cold vapor generation and atomicfluorescence spectrometric detection. Envi-ronmental Science&Technology, 39(13), 4974e4982.
Sioen, I., Henauw, S., Verdonck, F., Thuyne, N., & Camp, J. (2007). Development of anutrient database and distributions for use in a probabilistic risk-benefit analysis of human seafood consumption.Journal of Food Composition and Analysis, 20(8), 662e670.
Steuerwald, U., Weihe, P., Jorgansen, P. J., Bjerve, K., Brock, J., Heinzow, B., et al. (2000). Maternal seafood diet, methylmercury exposure, and neonatal neuro-logical function.Journal of Pediatrics, 136, 599e605.
US Environmental Protection Agency (USEPA). (2015).Fish: What pregnant women and parents should know. Available from: http://www.fda.gov/Food/ FoodborneIllnessContaminants/Metals/ucm393070.htmAccessed 22.09.15. Wang, Z., Forsyth, D., Belisle, S., Beraldin, F., Sparling, M., Trudelle, R.-A., et al. (2013).
Comparison of two analytical methods for the analysis of methylmercury in fish.Food Analytical Methods, 6, 157e163.
WHOeWorld Health Organization. (2015).Discussion paper on maximum levels for methylmercury infish. 9 th Session New Delhi, India, 16e20 March. Available from: ftp://ftp.fao.org/codex/Meetings/cccf/cccf9/cf09_13e.pdf Accessed 20.11.15.
WHOeWorld Health Organization. (2009).Principles and methods for the risk assessment of chemicals in food. Available from: http://apps.who.int/iris/ bitstream/10665/44065/9/WO_EHC_240_9_eng_Chapter6.pdf Accessed
25.11.15.
Yano, Y., Yokoyama, M., Satomi, M., Oikawa, H., & Chen, S. S. (2004). Occurrence of Vibrio vulnificus infish and shellfish available from markets in China.Journal of Food Protection, 67(8), 1617e1623.
Zhang, X., Naidu, A. S., Kelley, J. J., Jeewett, S. C., Dasher, D., & Duff, L. R. (2001). .Baseline concentration of total mercury and methylmercury in salmon returning via the Bering Sea (1999e2000). Marine Pollution Bulletin, 42(10), 993e997.