Article
Printed in Brazil - ©2016 Sociedade Brasileira de Química0103 - 5053 $6.00+0.00
*e-mail: [email protected]
Feasibility of Using AAS for the Characterization of a Tuna Fish Candidate
Reference Material for Total Hg and Methyl-Hg Measurement
Rodrigo Chelegão,a Vivian M. O. Carioni,b Juliana Naozukac and Cassiana S. Nomura*,b
aCentro de Pesquisas Agropecuárias, Embrapa Agrossilvipastoril, 78550-970 Sinop-MT, Brazil
bInstituto de Química, Universidade de São Paulo, 05508-000 São Paulo-SP, Brazil
cDepartamento de Ciências Exatas e da Terra, Universidade Federal de São Paulo,
09972-270 Diadema-SP, Brazil
This work describes the evaluation of several parameters for preparing a tuna fish candidate reference material (RM) in order to measure its total Hg and methyl-Hg mass fractions by cold vapor atomic absorption spectrometry (CV-AAS) and solid sampling graphite furnace atomic absorption spectrometry (SS-GF AAS). Best results were acquired after extraction with toluene and L-cysteine for 15 min at 80 °C. The parameters investigated were stability of chemical composition during production, homogeneity and analyte segregation. No analyte segregation was observed and the material was shown to be stable even when stored at 50 °C for 10 months. Total Hg mass fraction was 3.03 ± 0.22 µg g−1 by CV AAS, 2.99 ± 0.43 µg g−1 by SS-GF AAS and 2.95 ± 0.15 µg g−1 by direct mercury analyser (DMA). Methyl-Hg mass fraction was 2.49 ± 0.13 µg g−1 by CV AAS and 2.44 ± 0.46 µg g−1 by SS-GF AAS.
Keywords: reference material, tuna fish, total Hg, methyl-Hg, atomic absorption spectrometry
Introduction
Mercury (Hg) is a highly toxic pollutant found in a variety of chemical species, among which organic mercury compounds are generally more toxic than inorganic ones. Methyl-Hg can affect the immune system, alter genetics, disturb enzyme function and damage the nervous system, including coordination and the senses of touch, taste and sight.1 Fish and seafood consumption are the main source of methyl-Hg ingestion by humans.2 The levels of methyl-Hg in large predatory fish such as shark, marlin, swordfish and certain tuna fish species are high, since this compound is bioavailable in aquatic systems, bioaccumulates and also biomagnifies in the food chain. According to Codex guideline levels, maximum methyl-Hg levels are set at 1.0 and 0.5 mg kg−1 for large predatory fish and for non-predatory fishs, respectively.3 Control and knowledge of Hg levels is important in order to avoid environmental disaster and/or promote toxicological information.
Cold vapor atomic absorption spectrometry (CV AAS) and atomic fluorescence spectrometry (CV AFS) are the most widely used methods for measuring total Hg.4 For
C o n s i d e r i n g c o n c e r n s a b o u t e nv i r o n m e n t a l contamination along with the importance of obtaining accurate analytical results, the present work proposed to investigate several parameters such as homogeneity, analyte segregation and stability in the production of a tuna fish candidate reference material for total Hg and methyl-Hg mass fraction measurement. A fast and simple method relying on selective extraction of methyl-Hg was applied. The Hg measurement was done by CV AAS. Results were compared by SS-GF AAS and direct mercury analyser (DMA).
Experimental
Instrumentation
The measurements were performed with a cold vapor atomic absorption spectrometer, Model AAS Vario 6 (Analytik Jena AG, Jena, Germany), equipped with a cold vapor generation system (HS55 model, Analytik Jena AG) and a deuterium lamp for background correction. A graphite furnace atomic absorption spectrometer, model Zeenit 600 (Analytik Jena AG) equipped with transversal heating, Zeeman background corrector, graphite tubes and pyrolytically-coated boat-type solid sampling platforms (Analytik Jena) was used. A hollow mercury cathode lamp was used in both methods. The instrumental parameters, experimental conditions and heating programme used for Hg measurement by CV AAS and SS-GF AAS are presented in Table 1.
A direct Hg analyser (DMA-80 system, Milestone, Middletown, USA) equipped with a hollow Hg cathode lamp (λ = 253.7 nm) and Ni boats were also used as a comparative method for the measurement of total Hg concentrations. Samples with a mass of 100-200 mg were loaded into the Ni-boats. All these parameters were chosen according to manufacturer’s instructions.
The sample was freeze-dried using ModulyoD model (Thermo Electron Corporation, Asheville, USA). The samples were ground using a food cutting mill (GM 200 model, Retsch, Haan, Germany) and a cryogenic mill with a self-contained liquid nitrogen bath (MA 775 model, Marconi, Brazil). An automatic stainless steel sieve system (AS 200 model, Retsch) was used to separate six sample fractions of different particle sizes: > 500, 400-500, 300-400, 250-300, 200-250 and 150-200 µm. To measure total Hg by CV AAS, the fish sample was digested using a high pressure microwave oven equipped with a quartz flask (Microwave 3000, Anton Paar, Graz, Austria). A 10 L heating bath (model Q226M1, Solab, Piracicaba, Brazil, Solab) and an ultrasonic bath (model 75D, VWR International, Pennsylvania, USA) were used to promote extraction of methyl-Hg species.
Materials and reagents
All solutions were prepared from analytical reagent grade chemicals using high-purity deionized water obtained from a Milli-Q water purification system (Millipore, Belford,
USA). Nitric acid (65% m/m; Merck, Darmstadt, Germany)
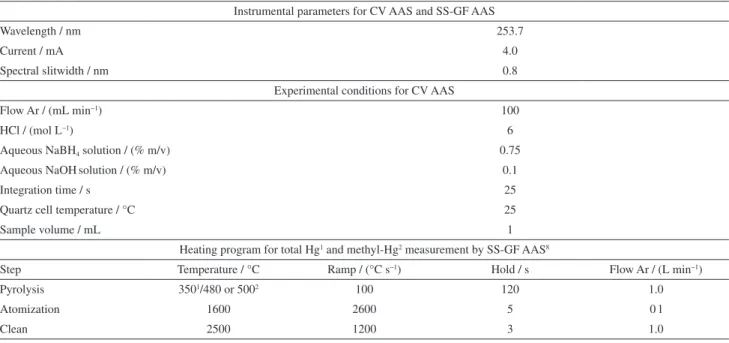
Table 1. Instrumental parameters, experimental conditions and heating program used for total Hg and methyl-Hg measurements by CV AAS and SS-GF AAS
Instrumental parameters for CV AAS and SS-GF AAS
Wavelength / nm 253.7
Current / mA 4.0
Spectral slitwidth / nm 0.8
Experimental conditions for CV AAS
Flow Ar / (mL min−1) 100
HCl / (mol L−1) 6
Aqueous NaBH4 solution / (% m/v) 0.75
Aqueous NaOHsolution / (% m/v) 0.1
Integration time / s 25
Quartz cell temperature / °C 25
Sample volume / mL 1
Heating program for total Hg1 and methyl-Hg2 measurement by SS-GF AAS8
Step Temperature / °C Ramp / (°C s−1) Hold / s Flow Ar / (L min−1)
Pyrolysis 3501/480 or 5002 100 120 1.0
Atomization 1600 2600 5 0 l
Clean 2500 1200 3 1.0
was distilled in quartz sub-boiling still (Marconi, SP, Brazil). A Tritisol standard solution of 1000 mg L−1 Hg (Merck) was used to prepare the reference analytical solutions by serial dilution. Methyl-Hg solutions were prepared using a solid standard from Sigma-Aldrich (St. Louis, MO, USA).
For the measurement of Hg by SS-GF AAS, concentrated solutions of 1 g L−1 Na
2IrCl6 (Sigma-Aldrich), 10 g L−1 Pd(NO
3)2 (Merck) and 10 g L−1 Mg(NO3)2 (Merck) were used to prepare the chemical modifiers (0.5 g L−1 Pd + 0.3 g L−1 Mg or 0.5 g L−1 Pd + 0.3 g L−1 Mg + 0.5% m/v Triton X-100). Triton X-100 (Merck) was added to the chemical modifier solution (0.5% m/v).
A 0.75% (m/v) NaBH4 solution used as a reducing solution was prepared daily by dissolving NaBH4 powder (NaBH4, Nuclear, São Paulo, Brazil) in an aqueous solution of 0.1% (m/v) NaOH (Merck). Hydrochloric acid (6 mol L−1) (Merck) was used for the hydride reaction.
Measurement of the mass fraction of the methyl-Hg species was performed after extraction using toluene (Synth, Diadema, SP, Brazil) and cysteine (Sigma-Aldrich).
The accuracy of the total Hg and/or methyl-Hg mass fraction measurement method was assessed by analysing CRMs: TORT-2 (lobster hepatopancreas, National Research Council of Canada, NRCC), certified for total Hg content, CE-464 (tuna fish, European Reference Materials, IRMM) and SRM 1566b (oyster tissue, National Institute of Standard and Technology, NIST), both certified for total Hg as well as methyl-Hg species mass fractions, and DOLT-4 (dogfish liver, National Research Council of Canada, NRCC), certified for methyl-Hg content.
Procedures
Preparation of the tuna fish candidate reference material
To prepare the candidate reference material, tuna fish were acquired from southern Brazil. The procedure adopted to prepare this material was previously described by Carioni et al.10 in which the sample was freeze-dried for 48 h, to a moisture content of 2.52 ± 0.12%, then ground using a cutting mill for 3 min at 5000 rpm followed by fine grinding using a cryogenic grinder (5 min of freezing followed by 3 cycles of 2 min of grinding, with 1 min of freezing between each cycle). Eighty glass flasks containing 30 g each of this material were generated. Prior to analysis, samples were γ irradiated. The water content in the raw fish tissue was evaluated by weighing the sample before and after the freeze-drying procedure.
Comparison methods: DMA and SS-GF AAS
Direct measurement of total Hg and methyl-Hg mass fractions by SS-GF AAS was performed using the procedure
developed by our group and published in previous work.8 For total Hg measurement, Ir film and 5 µg Pd + 3 µg Mg solution were used as permanent and co-injected chemical modifiers, respectively.11 A volume of 10 µL of Pd + Mg was co-injected together with 10 µL of analytical solutions or solid sample (0.200-0.400 mg). Calibration curves were obtained by using reference solutions containing 0.5-3.0 mg L−1 Hg2+ in 0.1% v/v HCl. For direct chemical speciation, 5 µg Pd + 3 µg Mg or 5 µg Pd + 3 µg Mg + 0.5% m/v Triton X-100 solutions were used as co-injected chemical modifiers (10 µL). Calibration with analytical solutions of 0.5-4.0 mg L−1 Hg2+ and methyl-Hg and sample masses ranging from 0.200 to 0.800 mg were used to perform the direct chemical speciation.
A direct Hg analyser (DMA-80 system, Milestone, Middletown, USA) equipped with a hollow Hg cathode lamp (λ = 253.7 nm) and Ni boats was used as a comparative method to measure total Hg concentrations. Samples with a mass of 100-200 mg were loaded into the boats and introduced into the DMA-80 system. All these parameters were applied according to manufacturer’s recommendation.
Method development for total Hg and methyl-Hg mass fraction measurement by CV AAS
Total Hg and methyl-Hg mass fraction measurements were performed by CV AAS using the instrumental parameters presented in Table 1. For total Hg mass fraction measurement, fish samples were first submitted to acid digestion using a high pressure microwave oven. Around 200 mg of fish sample were mixed together with 1 mL of HNO3, 2 mL of H2O2 and 3 mL of H2O and submitted to the following heating program [temperature (°C), ramp (min), hold (min)]: (140, 5, 1), (180, 4, 5) and (200, 4, 10). The resulting solution was diluted with deionized water to a final volume of 15 mL.
A calibration curve was made with successive dilutions of 1000 mg L−1 HgII solution. Concentrations between 5 and 40.0 µg L−1 were used in CV AAS.
The possibility of species interconversion during the heat extraction as well as the procedure’s efficiency were checked using a spike recovery test of 3 µg of HgII, 3 µg of methyl-Hg, and 1.5 µg L−1 of HgII + 1.5 µg of methyl-Hg which were added to aqueous solutions and to solutions containing the fish matrix.
Evaluation of composition during material production, analyte segregation, homogeneity and stability testing
The effects of sample processing during the production of the total Hg and methyl-Hg species caused by freeze-drying and cryogenic milling were investigated. This study was performed by analysing raw, dried and freeze-dried + cryogenically ground + γ irradiated tuna fish.
Analyte segregation was investigated by analysing different particle size samples. In this study, 200 mg of freeze-dried samples were ground in a cutting mill for 3 min at 5000 rpm, sieved and separated into six fractions: > 500, 500-400, 400-300, 300-250, 250-200, and 200-150 µm.
The homogeneity “between-bottle” and “in-bottle” were estimated. For the “between-bottle” homogeneity investigation, 12 flasks of CRM (from 80 flasks) were randomly selected and a 300 mg portion from each was analysed for total Hg and methyl-Hg mass fractions by CV AAS. To evaluate the homogeneity in one bottle, a single flask of CRM (from among 12 previously used flasks) was selected randomly and 12 portions of 300 mg were analysed using the proposed method.
The stability of the CRM was tested by analysing material for total Hg and methyl-Hg mass fractions after storage under different conditions: 4 °C (refrigerator), 25 °C (cabinet) and 50 °C (stove) for 2, 4, 6, 8 and 10 months.
Results and Discussion
Method development for total Hg and methyl-Hg mass fraction measurement by CV AAS
An accurate method of sample analysis is one of the pre-requisites for RM production, since the analyte content has to be investigated before, during and after the production process. In the case of speciation analysis, the proposed method should guarantee the chemical form of the species, avoiding interconversion between different forms. Hyphenated techniques are the most used in speciation analysis. However, it is known that good results for speciation analysis can also be obtained using simple techniques such as CV AAS. Both inorganic
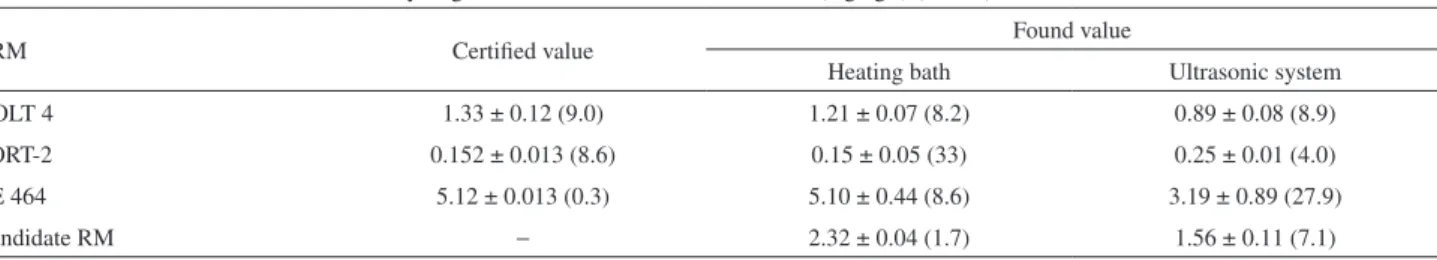
and methyl-Hg can be reduced by NaBH4, depending on the concentration of the reagents used for hydride generation. Inorganic Hg, however, can be measured at room temperature whereas methyl-Hg measurement requires heating of the quartz cell atomizer to promote methyl-Hg hydride decomposition.12,13 For this purpose, the use of an appropriate solvent to promote selective extraction of the analyte is necessary. Considering the lipophilic nature of methyl-Hg species, Westoo14 proposed the use of toluene as a solvent. To improve the efficiency of extraction, heating with microwave radiation was used. In this work, the use of a heating bath and/or ultrasonic bath instead of microwave radiation for methyl-Hg extraction is proposed. Using this procedure, methyl-Hg was dissolved in an organic solvent (toluene) and then extracted to aqueous solution (2% m/v L-cysteine solution) before analysis by CV AAS. Extraction using heating bath at 80 °C for 15 min showed the best results. Sample treatment using ultrasound bath was not efficient to extract methyl-Hg species generating low recoveries in the results. The accuracy of these procedures was checked by analysing CRMs (Table 2).
Homogeneity evaluation of RM candidate fish samples
Preparation of RMs involves several steps during which risk of contamination, loss of analyte and changes in the analyte’s microdistribution in the material need to be avoided. In the case of RM for speciation analysis, care has to be taken to avoid interconversion between species. To guarantee the quality of the final material, production has to be controlled and RMs should have their composition evaluated before, during and after production, since previous studies have shown that sample processing can change the structure of some compounds, e.g., arsenobetaine species.15 The results presented in Table 5 show the total Hg and methyl-Hg mass fractions in
raw and processed fish are close to each other, indicating no influence of the RM preparation procedure on their concentrations.
Considering the results obtained for total Hg and methyl-Hg in raw fish, freeze-dried fish and freeze-dried and cryogenically ground fish (Table 5), there was no influence of sample treatment on the total Hg or methyl-Hg mass fractions since there was good agreement between the results. These results also show that the homogeneity of total Hg and methyl-Hg mass fraction distribution was improved in the final steps of RM production. While the coefficient of variation of the unground sample was around 18%, this value was no higher than 5% for the final material (freeze-dried, ground and irradiated fish) (Table 5). The coefficient of variation obtained for the “between-bottle” and“in-bottle” homogeneity studies of the final material were, respectively, 1.6 and 5.6% for total-Hg and 1.4 and 1.8% for methyl-Hg, respectively. These results indicate this material is homogeneous for a mass of 300 mg.
Evaluation of analyte segregation
A narrow particle size distribution is required to avoid inhomogeneity caused by analyte segregation. Knowing the analyte content of a variety of particle sizes is important
Table 2. Measurement of methyl-Hg in fish by CV AAS after selective extraction using toluene and L-cysteine as solvent associated to heating bath at 80 °C for 15 min and extraction using ultrasonic system at room temperature (25 °C) for 5 min
Methyl-Hg mass fraction ± standard deviation / (mg kg−1) (CV, %); n = 3
CRM Certified value Found value
Heating bath Ultrasonic system
DOLT 4 1.33 ± 0.12 (9.0) 1.21 ± 0.07 (8.2) 0.89 ± 0.08 (8.9)
TORT-2 0.152 ± 0.013 (8.6) 0.15 ± 0.05 (33) 0.25 ± 0.01 (4.0)
CE 464 5.12 ± 0.013 (0.3) 5.10 ± 0.44 (8.6) 3.19 ± 0.89 (27.9)
Candidate RM − 2.32 ± 0.04 (1.7) 1.56 ± 0.11 (7.1)
CV: cold vapor; CRM: certified reference material.
Table 3. Addition and recovery test of HgII and methyl-Hg in aqueous
solution and in fish sample submitted to extraction procedure using toluene and L-cysteine associated to heating at 80 °C in heating bath and analysed by CV AAS
Addition Recovery / %; n = 2 Aqueous solution 3 µg of HgII 5.0 ± 0.3
3 µg of methyl-Hg 110 ± 3 1.5 µg of HgII + 1.5 µg
of methyl-Hg
55.0 ± 0.4
Fish sample 3 µg of HgII 4 ± 1
3 µg of methyl-Hg 103 ± 3 1.5 g of HgII + 1.5 µg
of methyl-Hg
50.0 ± 0.4
Table 4. Total Hg and methyl-Hgmass fraction measurement by SS-GF AAS, CV AAS and DMA in tuna fish candidate reference material
Analytical method
Analyte mass fraction ± standard deviation / (mg kg-1) (CV, %); n = 3
Total Hg Methyl-Hg SS-GF AAS 2.99 ± 0.43 (14) 2.44 ± 0.46 (19) CV AAS 3.03 ± 0.22 (7.3) 2.49 ± 0.13 (1.2)
DMA 2.95 ± 0.15 (5.1) −
SS-GF AAS: solid sampling graphite furnace atomic absorption spectrometry; CV AAS: cold vapor atomic absorption spectrometry; DMA: direct mercury analyser.
Table 5. Total Hg and methyl-Hgmass fraction measurement by CV AAS in tuna fish candidate reference material submitted to different pretreatment
Sample
Analyte mass fraction ± standard deviation / (mg kg−1) (CV, %); n = 3
Total Hg Methyl-Hg
Raw fish tissue 2.66 ± 0.48 (18) 2.36 ± 0.40 (17)
Freeze-dried fish tissue 2.78 ± 0.22 (8) 2.13 ± 0.41 (19)
Final materiala 2.75 ± 0.13 (5) 2.33 ± 0.10 (4)
Non-fractionated
sample 2.85 ± 0.20 (7.0) 2.32 ± 0.02 (0.9)
to prevent sampling errors, especially because during RM storage, different sized particles tend to become separated.16
The mean particle size value was 36 µm and 80% of the particles were less than 100 µm. Another 20% is comprised of particles between 100 and 600 µm. The occurrence of analyte segregation was checked by measuring total Hg and methyl-Hg mass fractions in different particle sizes obtained by sieving (Table 6). The results showed that only the fraction containing particles between 200 and 300 µm presented a lower total Hg content. In the case of methyl-Hg, particles between 100 and 150 µm presented high concentrations of this analyte. However, the high standard deviation indicated statistically equivalent values when compared with the results obtained for other fractions. A cryogenically ground unfractionated sample was also analysed and the results were in accordance with the mean value of all fractions (Table 6). The results (Table 6) also showed that the coefficient of variation did not change with particle size, indicating good homogeneity in the sample mass taken for analysis (300 mg). Considering these observations, cryogenic grinding was therefore indicated for tuna fish RM preparation, in which the mean particle size was 36 µm.9
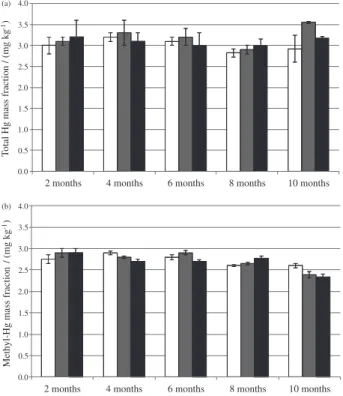
Stability testing
The composition of a reference material and the parameters studied should remain stable over the entire period of utilisation of the material.16 Samples were stored either at low temperature (4 °C, refrigerator), environmental temperature (25 °C, cabinet) and higher temperature (50 °C, stove). The sample kept in the refrigerator was considered the reference since microbiological activity and compound degradation are minimized at low temperature. The results for total Hg (Figure 1a) and methyl-Hg (Figure 1b) mass fractions in these samples kept under different conditions are presented in Table 6. Comparing the results of total-Hg
mass fraction even for samples under extreme conditions (50 °C for 10 months), no variation was observed when Student’s t-test (95% confidence level) was applied. Same results were observed for methyl-Hg except under 25 °C and 50 °C for 10 months which presented results around 15% lower. Stability testing will be done after 2 years but the presented results indicate that the tuna fish candidate reference material is suitable for use as a quality control specially if stored at 4 °C.
Conclusions
The AAS technique is commonly used for total element content measurement. This paper showed it can also be used for speciation analysis. Solid sampling-GF AAS was shown to be an interesting alternative for measuring total-Hg and methyl-total-Hg during routine analysis of fish samples. The possibility of using a low sample mass size (< 0.5 mg) makes it suitable to be applied in microanalysis. In the case of CV AAS, appropriate sample pre-treatment such as acid decomposition (for total-Hg measurement) or selective extraction using an appropriate solvent (for methyl-Hg measurement) allowed speciation analysis.
The preparation of reference materials requires the investigation of several parameters such as homogeneity, analyte segregation and stability, since they are directly linked to the accuracy and precision of the results. In the
Table 6. Evaluation of the homogeneity and segregation of Hg by CV AAS in the tuna fish candidate reference material
Fraction / µm
Analyte mass fraction ± standard deviation / (mg kg−1) (CV, %); n = 3
Total Hg Methyl-Hg
500-400 2.63 ± 0.19 (7.2) 2.42 ± 0.03 (1.2)
400-300 2.80 ± 0.13 (4.6) 2.45 ± 0.06 (6.5)
300-250 2.54 ± 0.10 (3.9) 2.42 ± 0.02 (0.8)
250-200 2.55 ± 0.06 (2.4) 2.39 ± 0.07 (2.9)
150-100 2.82 ± 0.15 (5.3) 2.55 ± 0.10 (3.9)
< 50 2.71 ± 0.14 (5.2) 2.53 ± 0.01 (0.4)
Mean value 2.68 ± 0.35 (12.3) 2.49 ± 0.69 (7.0)
0.0 0.5 1.0 1.5 2.0 2.5 3.0 3.5 4.0
4.0 (a)
(b)
2 months 4 months 6 months 8 months 10 months
T
otal Hg mass fraction / (mg kg
-1)
0.0 0.5 1.0 1.5 2.0 2.5 3.0 3.5
2 months 4 months 6 months 8 months 10 months
Methyl-Hg mass fraction
/ (mg kg
-1)
case of reference material for speciation analysis, special attention has to be paid to interconversion between species during sample preparation.
The tuna fish candidate reference material was analysed using two methods developed by the group. SS-GF AAS and CV AAS were shown to be interesting tools to measure total Hg and methyl-Hg mass fractions in tuna fish. In the first case, direct solid sample analysis was performed. In the second, acid digestion of the sample was required for total-Hg mass fraction measurement and extraction with toluene and L-cysteine was used for measurement of methyl-Hg.
Considering the composition of tuna fish evaluated before, during and after the preparation of a tuna fish candidate RM, no contamination, loss of analyte or conversion of methyl-Hg species to other species was observed. Except for the raw fish tissue, adequate homogeneity was obtained with all the pre-treatment procedures and all the particle sizes evaluated, although the coefficients of variation indicated that the best procedure for RM preparation was fine grinding in a cryogenic mill. Taking into consideration the mass fractions of total-Hg and methyl-Hg in all the studied particle sizes, analyte segregation was not observed. All the results indicate that this candidate RM is suitable for quality control for total-Hg and methyl-total-Hg measurement in tuna fish samples, since the stability of the material has been confirmed and mass fraction values have been properly assigned.
This material has already been distributed to many Brazilian research laboratories to be analysed. The distribution was done via a proficiency-testing program organized by PhD Ana Rita Araújo Nogueira and PhD Gilberto Batista de Souza from Embrapa Pecuaria Sudeste (São Paulo, SP).
Acknowledgements
We kindly acknowledge Fundação de Amparo à Pesquisa do Estado de São Paulo (FAPESP No. 2007/56504-6, 2012/11517-1 and 2012/11998-0) and Conselho Nacional de Desenvolvimento Científico e Tecnológico (CNPq) for financial support and fellowships. We also acknowledge Mr Paulo de Souza Santos (Instituto de Pesquisas Energéticas e Nucleares-IPEN, São Paulo, SP) for sample irradiation and
PhD Ana Rita Araújo Nogueira and PhD Gilberto Batista de Souza from Brazilian Agricultural Research Corporation (Embrapa, São Carlos, SP, Brazil) for proficiency testing.
References
1. Zhu, Z.; Liu, Z.; Zheng, H.; Hu, S.; J. Anal. At. Spectrom. 2010, 25, 697.
2. Reyes, L. H.; Rahman, G. M. M.; Kingston, H. M. S.; Anal. Chim. Acta 2009, 631, 121.
3. Food and Agriculture Organization of the United Nations, Codex Alimentarius Commission, Guideline Levels for Methylmercury in Fish (CAC/GL 7-1991).
4. Taylor, A.; Day, M. P.; Hill, S.; Marshall, J.; Patriarca, M.; White, M.; J. Anal. At. Spectrom. 2015, 30, 542.
5. Pilz, C.; Antes, F. G.; Moreira, C. M.; Mello, P. A.; Duarte, F. A.; Pozebonc, D.; Flores, E. M. M.; Dressler, V. L.; BrJAC--Braz. J. Anal. Chem. 2011, 5, 228.
6. Vieira, M. A.; Grinberg, P.; Bobeda, C. R. R.; Reyes, M. N. M.; Campos, R. C.; Spectrochim. Acta, Part B 2009, 64, 459. 7. Gelaude, I.; Dams, R.; Resano, M.; Vanhaecke, F.; Moens, L.;
Anal. Chem. 2002, 74, 3833.
8. Naozuka, J.; Nomura, C. S.; J. Anal. At. Spectrom. 2011, 26, 2257.
9. Ibáñez-Palomino, C.; López-Sánchez, J.; Sahuquillo, A.; Anal. Chim. Acta 2012, 720, 9.
10. Carioni, V. M. O.; Chelegão, R.; Naozuka, J.; Nomura, C. S.; Accredit. Qual. Assur. 2011, 16, 453.
11. Naozuka, J.; Oliveira, P. V.; Pedrotti, J. J.; Quim. Nova 2003, 26, 934.
12. Alp, O.; Ertas, N.; J. Anal. At. Spectrom. 2009, 24, 93. 13. Torres, D. P.; Frescura, V. L. A.; Curtius, A. J.; Microchem. J.
2009, 93, 206.
14. Westoo, G.; Acta Chem. Scand. 1966, 20, 2131.
15. Devesa, V.; Vélez, D.; Montoro, R.; Food Chem. Toxicol. 2008, 46, 1.
16. Quevauviller, P.; Spectrochim. Acta, Part B 1998, 53, 1261.
Submitted: September 3, 2015
Published online: November 19, 2015