Vol.52, n. 4: pp. 953-960, July-August 2009
ISSN 1516-8913 Printed in Brazil BRAZILIAN ARCHIVES OF
BIOLOGY AND TECHNOLOGY
A N I N T E R N A T I O N A L J O U R N A L
Analysis of Mercury-Rich Plants and Mine Tailings Using
the Hydride-Generation AAS Method
Fábio Netto Moreno
1*, Christopher Anderson
2, Robert Stewart
2and Brett Robinson
31 Setor de Águas Subterrâneas e do Solo; Companhia de Tecnologia de Saneamento Ambiental do Estado de São
Paulo; Av. Prof. Frederico Hermann Jr., 345; 05459-900; São Paulo - SP – Brasil. 2Soil and Earth Science;
Institute of Natural Resources; Massey University; Palmerston North - New Zealand. 3Agriculture and Life Sciences
Division; Lincoln University; Lincoln 7647, Canterbury - New Zealand
ABSTRACT
A hydride-generation atomic absorption spectroscopy (AAS) method was developed for the analysis of total Hg in liquid matrices of mercury-rich plants and mine tailings samples. The detection limit for this method was as low as 11.4 ng/mL. The reproducibility of the mercury signals (in terms of relative standard deviation) was 4.6%. Accuracy of the method was verified by analyses of deionised water samples spiked with HgCl2 and HgNO3. Recovery values
for total mercury ranged from 88.5 to 94.3% for both mercury species added. An external certified laboratory validated the analytical method with a maximum discrepancy of 15 %. Optimal analytical response of the equipment for Hg analysis of plant samples was achieved when the sample volume added to the reaction vessel was 0.25 mL.
Key words: hydride-generation, mercury, plant and mine tailings, sodium borohydride (NaBH4), phytoextraction
*
Author for correspondence:[email protected]
INTRODUCTION
The discharge of mercury (Hg) into soils and aquatic systems from anthropogenic activities is of great environmental concern due to the potential transformation of inorganic Hg forms into methylmercury. In many countries of the developing world, Hg is still used in artisanal and small-scale gold mining operations. It is estimated that around 160,000 artisanal mine sites are spread in South America, Russia and Asia, releasing between 450 to 800 tonnes per year of metallic Hg into the environment (Lacerda, 2003; Veiga, 2004). In the Brazilian Amazon, for instance, the figures point for around 2000 abandoned artisanal gold mine sites (Veiga and Hinton, 2002). Phytoextraction removes metals from the soil
subsurface through repeated cropping and safety storage of the harvested plant biomass following its accumulation in the aerial tissues (Brooks, 1998). Plant species can be an economic alternative to conventional remediation technologies because they rely uniquely on the sun’s energy to perform the remediation job. Research was carried out to investigate the feasibility of ligand-induced phytoextraction for the removal of Hg from contaminated mine wastes (Moreno, 2005). Plant species were able to accumulate up to 100 mg/kg of Hg following treatment of the contaminated soil with S-containing ligands (Moreno et al, 2004; Moreno et al, 2005).
Hg in plant and soil matrices. Hydride generation is a technique developed for the determination of hydride-forming metals and metalloids (Atkins and Jones, 1997). Mercury can be converted in the gaseous form upon reaction with either stannous chloride (SnCl2) or sodium borohydride (NaBH4).
However, SnCl2 reduces only inorganic mercury.
Total mercury determinations with this reducing agent will be possible only after all organomercury species have been decomposed into inorganic Hg. On the other hand, NaBH4 has the ability to reduce
both inorganic and organic Hg in the same sample solution, thus making this reducing agent potentially advantageous over SnCl2 in the case of
total Hg determinations (Oda and Ingle, Jr, 1981). In this work, we describe the hydride generation method for the determination of total Hg in Hg-rich plant and soil samples. The performance of the method was evaluated using the following criteria: 1) the generation of linear calibration graphs; 2) the detection limit; 3) the recovery of Hg in Hg spiked deionized water and plant samples; 4) the determination of total Hg concentration in a tailings reference materials of known Hg concentration; 5) a comparative analysis of total Hg concentrations in solutions and Hg-rich plant samples by an external certified laboratory.
MATERIAL AND METHODS
Standards and reagents
All the solutions were prepared using reverse osmosis (RO) water and the chemicals used were of analytical reagent grade. A Spectrosol Atomic Absorption (AA) solution of mercury nitrate HgNO3 (1000 mg/L) was used as the primary
standard (May and Baker, AAS standard reagent solution, England). Four working standard solutions were prepared during each analysis by appropriately diluting a 10 mg/L Hg solution in RO water.
Liquid samples containing Hg were added to the Hg vapour-generation flask along with 10 mL of 0.5 M hydrochloric acid (HCl). Sodium borohydride (NABH4) was used as a reducing
agent to generate elemental Hg in a 5% NaBH4 +
1% potassium hydroxide (KOH) w/v solution.
The instrument
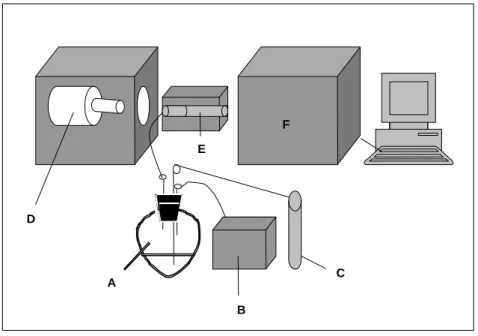
The apparatus consisted of a nitrogen source, a peristaltic pump, a sodium borohydride container, a mercury-vapour generation flask (reaction vessel), an absorption tube and a GBC900 atomic absorption spectrophotometer (Victoria, Australia) (Figure 1). A peristaltic pump was used to injecta single burst of NaBH4 into the reaction vessel at a
flow rate of 15 mL/min. Nitrogen gas was used as a carrier to transport the mercury vapour to the atomic absorption tube.
The reaction vessel was a 75 mL pear-shaped glass flask mounted on a chassis. A Teflon bung with three inserted glass tubes sealed the vessel. Of the tubes, the first injected sodium borohydride, the second tube carried a continuous flow of low-pressure nitrogen gas into the sample. The last tube connected the reaction vessel to the absorption tube. The absorption tube was a silica tube with an input tube at one end and an exit at the other. The tube was located at the path of the GBC 900 AAS. An ICI mercury hollow cathode lamp operating at a wavelength of 253.7 nm and a lamp current of 3 mA emitted light according to the spectral line for Hg.
The GBC 900 instrument was set in the flame mode and quantification of mercury concentration was achieved by recording the peak height of the Hg signal over a period of 30 seconds. Interference by non-atomic absorption was minimised by a background correction system that measures absorbance from a broad-band output deuterium lamp (D2).
Mercury-rich plant samples
Figure 1 - Schematic diagram of the hydride generation apparatus. A, Hg-vapour generation flask (reaction vessel); B, peristaltic pump; C, nitrogen source; D, mercury lamp; E, heating device; F, absorption tube.
Extraction procedure
The ammonium thiosulphate extraction method was used to extract Hg bound to the solid-phase of a talings reference substrate (Moreno et al., 2004). One gram samples of substrate were weighed into 50 mL polypropylene centrifuge tubes in triplicate. After the addition of the (NH4)2S2O3 solution (20
mL at 2 g/L), the tubes were rotated in a shaker overnight at 45 rotations per minute (RPM) and the supernatant separated via centrifugation at 3000 RPM for three minutes.
Plant digestion
Harvested shoot tissues were washed in tap water and placed in a drying oven at 70 oC until a constant weight was obtained. After grinding, subsamples (0.5 g) were accurately weighed into 50 mL plastic pots before 15 mL of HNO3 was
added. The plant samples were left overnight then heated in a water bath at 80 oC for 1 h. Subsequently, the digest solutions were transferred to 10 mL polythene tubes and diluted with RO water to make a final volume of 10 mL.
Substrate digestion
Total Hg from tailings reference substrate was measured using aqua regia digestion. For this purpose, one-gram substrate-samples were
weighed into 50 mL polypropylene pots in triplicate and a 15 mL solution of HNO3 and HCl
at 1:3 ratio was added. The samples were digested in a water bath at 80oC for 1 h and the filtrates diluted to a final volume of 50 mL by adding RO water.
Accuracy of the method
The accuracy of the proposed method was assessed through Hg analysis of: 1) deionized water samples spiked with either HgNO3 or HgCl2
solutions to give a final Hg concentration of 125, 250, 500 and 1000 ng/mL and; 2) B.juncea plant digests spiked with HgNO3 solution to give a final
Hg concentration of 500 ng/mL.
Quality control assessment
The quality assessment of the hydride generation method was obtained by: 1) analysis of a tailings reference material obtained from the Department of Mining and Mineral Process Engineering (UBC, Vancouver, Canada) with a known concentration of 100 mg of Hg /kg of substrate; 2) ICP-MS analysis of total mercury concentrations in Hg-spiked solutions and Hg-rich plant samples by a external certified laboratory (Hill Laboratories, Hamilton, NZ).
A D
B
C F
Statistical analysis
A copy of SAS PC version 8e was used for statistical analyses (SAS Inst, 1988). The t-test was used to compare two treatment means assuming equality of variances. Simple linear and polynomial regression models were used to interpret the relationships between the two variables. The significance of the fitted regression was assessed through the ANOVA and the coefficient of determination (r2).
RESULTS AND DISCUSSION
Formation of Hg0
There are several methods for hydride generation and collection and all have the following features in common: 1) a strong reducing agent to generate
the hydride; 2) a heating device that decomposes the hydride, and 3) an atomic absorption measuring device which quantifies the amount of hydride produced (Robinson, 1994).
Elemental Hg (Hg0) can be generated by reaction of Hg2+ with NaBH4 according to the following
equation:
4Hg2+(aq) + 2NaBH4(aq) + 6H2O
4Hg0(g) + 7H2(g) + 2H3BO3(aq) + 2Na +
(aq) (1)
System Calibration
The hydride generation system utilised a flow rate of 280 to 320 mL/min for nitrogen and 15 mL/min for NaBH4. Under these conditions, linear
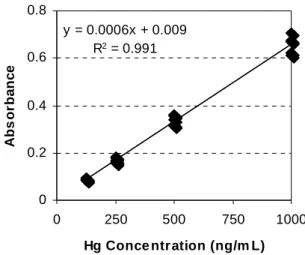
calibration curves were obtained over the range of 125 to 1000 ng/mL of Hg (Fig. 2).
Figure 2 - Calibration graph for the hydride- generation method
The limit of detection (LOD) for mercury was calculated using the general definition proposed by Harris (1986). The LOD should correspond to the concentration of an element necessary to yield a net signal equal to two times the standard deviation of 10 blank measurements. For the Hg hydride generation method in this study the LOD found was 11.4 ng/mL. The reproducibility of the mercury signals (in terms of relative standard deviation) was 4.6%. This was determined by
analysing 10 standards containing 1 mg/L of Hg.
Accuracy
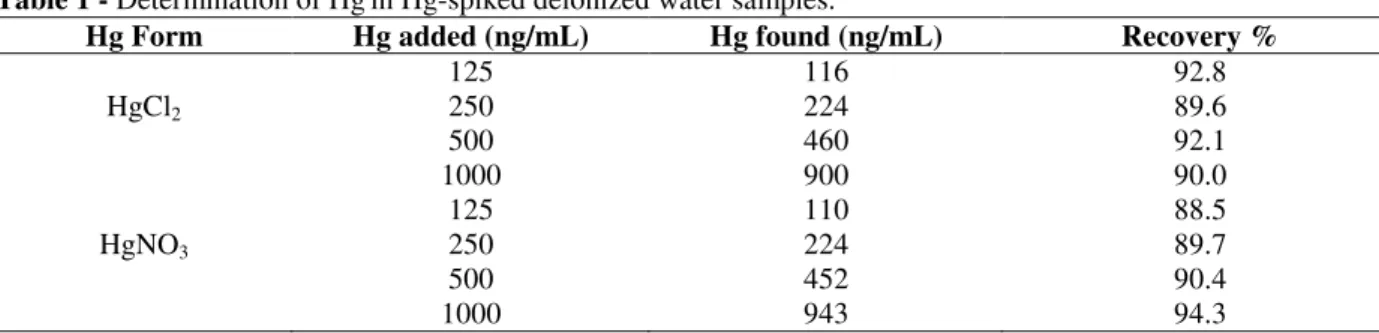
The accuracy of the hydride-generation method for the analysis of water samples was investigated by spiking deionized water with two mercury species (HgCl2 and HNO3) at four different concentrations
(125, 250, 500 and 1000 ng/mL). Table 1 showed that the recovery values for total mercury ranged from 88.5 to 94.3% for both Hg species added.
y = 0.0006x + 0.009 R2 = 0.991
0 0.2 0.4 0.6 0.8
0 250 500 750 1000
Hg Conce ntration (ng/m L)
A
b
s
o
rb
a
n
c
Table 1 - Determination of Hgin Hg-spiked deionized water samples.
Hg Form Hg added (ng/mL) Hg found (ng/mL) Recovery %
125 116 92.8
HgCl2 250 224 89.6
500 460 92.1
1000 900 90.0
125 110 88.5
HgNO3 250 224 89.7
500 452 90.4
1000 943 94.3
Analysis of plant sample digests spiked with Hg at 500 ng/mL were also examined for accuracy at different sample volumes added to the reaction vessel. This was performed because Hg determination by cold vapour methods could present errors if oxides of nitrogen, incompletely oxidized organic vapours, or smoke, having absorption lines at 253.7 nm, were present in the liquid matrix (Mitra, 1986). In the presence of such substances, a significant fraction of light emitted from the hollow cathode lamp is scattered and the absorbance can be substantially reduced. Figure 3 shows a strong negative correlation between the volume of the sample added to the reaction vessel and the relative peak heights for Hg in the AAS (r2 = 0.99, p < 0.0001). For
instance, at 0.25 mL of sample volume, the relative peak for Hg was not significantly different from the control (488 ± 67 and 500 ± 29, respectively, p > 0.05). However, as the volume increased from 0.5 to 3 mL, the relative peak height for Hg in plant tissue sharply reduced from 403 ± 38 to 182 ± 31).
Quality control assessment
The hydride generation method was validated by the analysis of total mercury concentrations in a reference tailings substrate, in Hg-spiked solutions and Hg-rich plant samples. The samples were analysed in triplicate and the results were compared with the total Hg analysis performed by an external certified laboratory.
Figure 3 - Relative peak heights in plant sample digests spiked with 500 ng/mL of Hg at different sample volumes. Bars denote ± 1 standard deviation from the mean of three replicates. The control sample was made from deionised water spiked with Hg at 500 ng/mL.
0 100 200 300 400 500 600
Control 0.25 0.5 1 3
Volum e of Sam ple (m L)
R
e
la
ti
v
e
P
e
a
k
H
e
ig
h
Figure 4 compares aqua-regia and (NH4)2S2O3
procedures to extract Hg from a tailings reference substrate containing 100 mg/kg of Hg. The use of 2 g/L of (NH4)2S2O3 resulted in significantly
higher Hg recoveries when compared to the HNO3/HCl acid mixture (122.2 ± 9.4mg/kg and
67.47 ± 11.2 mg/kg, respectively, t-test, p = 0.0056). The concentration of Hg recovered using the (NH4)2S2O3 procedure was in good agreement
with the total Hg content of the reference substrate. Losses of Hg through volatilisation might have contributed to the discrepancy observed between the Aqua regia and the (NH4)2S2O3 extraction procedures.
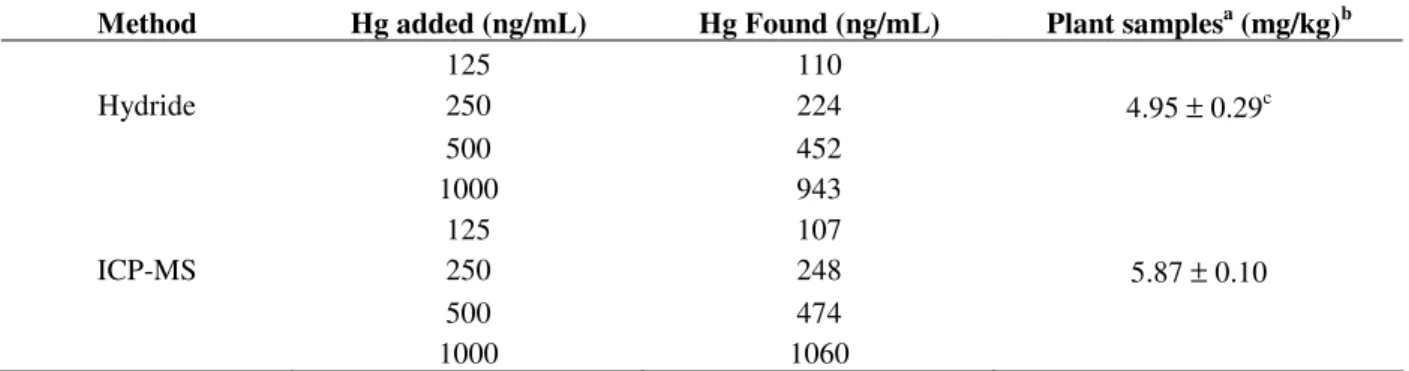
The comparative evaluation between the hydride
generation method and ICP-MS analysis for the total Hg contents in spiked solutions and Hg-rich plant samples is shown in Table 2.
Total Hg concentrations determined in solutions using the hydride generation AAS method were in good agreement with the Hg values found by the certified laboratory. Mercury recoveries ranged between 88 to 103%. Table 2 showed that Hg concentration found in the Hg-rich biomass agreed reasonably well with the Hg concentration detected by the ICP-MS method. Analysis by the hydride generation method reported 84 % of the Hg reported by analysis using ICP-MS. This difference was shown to be statistically significant (t-test, p = 0.0069).
Figure 4 - Comparison between Aqua regia and (NH4)2S2O3 to extract Hg from a tailings
reference substrate containing 100 mg/kg of Hg. Bars denote ± 1 standard deviation from the mean of three replicates.
Table 2 - Comparison between the hydride generation and the ICP-MS methods for the Hg determination in Hg-spiked solutions and plant samples.
Method Hg added (ng/mL) Hg Found (ng/mL) Plant samplesa (mg/kg)b
125 110
Hydride 250 224 4.95 ± 0.29c
500 452
1000 943
125 107
ICP-MS 250 248 5.87 ± 0.10
500 474
1000 1060
aMean and standard deviation of three replicates. b
Concentration values for dry weight plant samples. cValue achieved at 0.25 mL of sample volume added to the reaction vessel. 0
20 40 60 80 100 120 140
(NH4)2S2O3 Aqua-regia
H
g
E
x
tr
a
c
te
d
(
m
g
/k
g
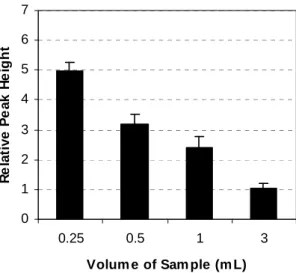
Figure 5 shows the relative peak heights for the Hg concentration in the Hg-rich biomass of B.juncea as a function of the volume of sample added to the reaction vessel. On average, the relative peak height Hg decreased significantly from 4.95 ± 0.29 to 1.02 ± 0.17 as the sample volume increased from 0.25 to 3 mL (r2= 0.979, p = 0.0002). As demonstrated previously, the presence of oxidized plant tissues in the liquid matrix significantly interfered with the analytical response of the hydride-generation method.
In conclusion, the hydride generation method has been proven to be accurate for the determination of Hg in an acid matrix of soil and plant samples with a limit of detection as low as 11.4 ng/mL. In the presence of oxidised plant tissues in the liquid
matrix, however, analytical precision of the equipment decreased significantly as the volume of the sample added to the reaction vessel increased. In order to improve the analytical precision of the equipment for Hg analysis in plant samples, not more than 0.25 mL volume of this sample type should be added to the reaction vessel. Because Hg determination was done on plant samples with high Hg content, detection of Hg could be achieved at 0.25 mL of sample volume. However, for plant samples with low Hg content, the Hg signal could be within the limit of detection of the machine. Concentrating the Hg mass in the liquid matrix (increasing the amount of plant tissue to be digested or reducing the dilution factor of the sample) could solve this problem.
Figure 5 - Relative peak heights in Hg-rich plant samples as a function of sample volume. Bars denote ± 1 standard deviation from the mean of three replicates.
ACKNOWLEDGEMENTS
We are thankful to the National Council for Scientific and Technological Development (CNPq/Brazil) for providing a post-doctoral scholarship to the first author.
RESUMO
Um protocolo para análise do mercúrio (Hg) em amostras líquidas de solo e tecidos vegetais enriquecidos com Hg foi desenvolvido com base na técnica de geração de hidretos. O limite de
detecção para este método foi de 11.4 ng/mL. A reproducibilidade do método (calculado com base no desvio padrão relativo) foi de 4.6%. A precisão do método foi verificada pela análise de amostras de água deionizada contendo HgCl2 and HgNO3.
Os valores de mercúrio total recuperados variaram de 88.5 a 94.3% para ambas as espécies testadas. O método analítico foi validado por um laboratório externo certificado com discrepância máxima de 15 %. O desempenho analítico do equipamento para análise do mercúrio em tecidos vegetais foi considerado ótimo para volumes de amostra de até 0.25 mL.
0 1 2 3 4 5 6 7
0.25 0.5 1 3
Volum e of Sam ple (m L)
R
e
la
ti
v
e
P
e
a
k
H
e
ig
h
REFERENCES
Atkins, P. and Jones, L. (1997), Chemistry, 3rd Ed. W.H.Freeman and Company, USA, 886 pp.
Brooks, R. R. Ed. (1998), Plants that Hyperaccumulate Heavy Metals, CAB International, Cambridge, United Kingdom.
Cursino, L., Mattos, S. V. M., Silva, N. O., Chartone-Souza, E., and Nascimento, A. M. A. (2003) Measurement of volatilised mercury by a mini-system: a simple, reliable and reproducible technique.
Brazilian Arch. Biol. Technol. 46 (4):731-734 Glass, D. J. (1999), Current market trends in
Phytoremediation. Int. J. Phytoremediation 1(1),1-8. Harris, D.C. (1986), Quantitative Chemical Analysis.
W.H. Freeman and Company, USA.
Lacerda, L. D. (2003), Updating global Hg emissions from small-scale gold mining and assessing its environmental impacts. Environ. Geol. 43 (3), 308-314.
Meagher, R. B., Rugh, C. L., Kandasamy, M. K., Gragson, G. and Wang, N. J. (2000), Engineering phytoremediation of mercury pollution in soil and water using bacterial genes. In- Phytoremediation of Contaminated Soil and Water. Ed. N. Terry and G. Bañuelos, Eds. Lewis Publisher, USA, pp 201-219. Moreno, F. N. (2005), Phytoremediation of
mercury-contaminated mine wastes. PhD Thesis, Massey University, Palmerston North, New Zealand.
Moreno, F. N., Anderson, C. W. N., Robinson, B.H. and Stewart, R.B. (2004), Phytoremediation of mercury-contaminated mine tailings by induced
plant-Hg accumulation. Environ. Practice 6 (2),165-175.
Moreno, F. N., Anderson, C. W. N., Stewart, R. B. Robinson, B. H., Ghomshei, M. and Meech, J. A. (2005), Induced plant uptake and transport of mercury in the presence of sulphur-containing ligands and humic acid. New Phytol. 166, 445-454.
Mitra, S. (1986), Mercury in the Ecossystem. TransTech Publications, USA.
Oda, C. E. and Ingle, Jr., J. D. (1981), Speciation of mercury by cold vapor atomic absorption spectrometry with selective reduction. Anal. Chem. 53 (14), 2305-2309.
Robinson, B. H. (1994), Pollution of the Aquatic Biosphere by Arsenic Elements in the Taupo Volcanic Zone, Master Thesis, Massey University, New Zealand.
Veiga, M. M. and Hinton, J. J. (2002), Abandoned artisanal gold mines in the Brazilian Amazon: a legacy of mercury pollution. Nat. Res. Forum 26, 15-26.
Veiga, M. M. (2004), Mercury pollution: revealing sources and suggesting solutions. Environ. Practice 6 (2), 97-98.
Wilkinson, G., Gillard, R. D. and McCleverty, J. A., eds. (1987), Comprehensive Coordination Chemistry, Vol. 2. Pergamon Press, UK.