ACPD
9, 24051–24083, 2009Mercury emission and speciation of coal-fired power
plants
S. Wang et al.
Title Page
Abstract Introduction
Conclusions References
Tables Figures
◭ ◮
◭ ◮
Back Close
Full Screen / Esc
Printer-friendly Version
Interactive Discussion Atmos. Chem. Phys. Discuss., 9, 24051–24083, 2009
www.atmos-chem-phys-discuss.net/9/24051/2009/ © Author(s) 2009. This work is distributed under the Creative Commons Attribution 3.0 License.
Atmospheric Chemistry and Physics Discussions
This discussion paper is/has been under review for the journal Atmospheric Chemistry and Physics (ACP). Please refer to the corresponding final paper in ACP if available.
Mercury emission and speciation of
coal-fired power plants in China
S. Wang1, L. Zhang1, G. Li1, Y. Wu1, J. Hao1, N. Pirrone2, F. Sprovieri2, and M. P. Ancora2
1
Department of Environmental Science and Engineering, and State Key Joint Laboratory of Environment Simulation and Pollution Control, Tsinghua University, Beijing 100084, China
2
CNR – Institute of Atmospheric Pollution Research, Via Salaria Km 29.300-CP10, 00015 Monterotondo St., Rome, Italy
Received: 29 September 2009 – Accepted: 13 October 2009 – Published: 12 November 2009
Correspondence to: S. Wang ([email protected])
ACPD
9, 24051–24083, 2009Mercury emission and speciation of coal-fired power
plants
S. Wang et al.
Title Page
Abstract Introduction
Conclusions References
Tables Figures
◭ ◮
◭ ◮
Back Close
Full Screen / Esc
Printer-friendly Version
Interactive Discussion
Abstract
Comprehensive field measurements are needed to understand the mercury emissions from Chinese power plants and to improve the accuracy of emission inventories. Char-acterization of mercury emissions and their behavior were measured in six typical coal-fired power plants in China. During the tests, the flue gas was sampled simultane-5
ously at inlet and outlet of selective catalyst reduction (SCR), electrostatic precipitators (ESP), and flue gas desulfurization (FGD) using the Ontario Hydro Method (OHM). The pulverized coal, bottom ash, fly ash and gypsum were also sampled in the field. Mercury concentrations in coal burned in the measured power plants ranged from 17 to 385µg/kg. The mercury mass balances for the six power plants varied from 87 to 10
116% of the input coal mercury for the whole system. The total mercury concentrations in the flue gas from boilers were at the range of 1.92–27.15µg/m3, which were signif-icantly related to the mercury contents in burned coal. The mercury speciation in flue gas right after the boiler is influenced by the contents of halogen, mercury, and ash in the burned coal. The average mercury removal efficiencies of ESP, ESP plus wet FGD, 15
and ESP plus dry FGD-FF systems were 24%, 73% and 66%, respectively, which were similar to the average removal efficiencies of pollution control device systems in other countries such as US, Japan and South Korea. The SCR system oxidized 16% elemen-tal mercury and reduced about 32% of toelemen-tal mercury. Elemenelemen-tal mercury, accounting for 66–94% of total mercury, was the dominant species emitted to the atmosphere. The 20
mercury emission factor was also calculated for each power plant.
1 Introduction
Mercury (Hg) is one of the most important environmental contaminants that has aroused a global concern due to its toxicity, long range transport, persistence and bioaccumulation in the environment. Coal combustion is believed to be the main source 25
ACPD
9, 24051–24083, 2009Mercury emission and speciation of coal-fired power
plants
S. Wang et al.
Title Page
Abstract Introduction
Conclusions References
Tables Figures
◭ ◮
◭ ◮
Back Close
Full Screen / Esc
Printer-friendly Version
Interactive Discussion total mercury emissions (Pacyna et al., 2006). Streets et al. (2009) suggested that
the change of global anthropogenic Hg emissions may range anywhere from−4% to
+96% by 2050, depending on future implementation of best available technology (BAT) in coal-fired utilities and energy demand.
Mercury is present in coal in trace amounts (0.01–0.5 mg/kg). At the high tempera-5
tures in combustion zone of boilers, combustion releases the Hg in coal into the exhaust gas as elemental mercury (Hg0). This vapor may then be oxidized by HCl, SO2, and fly ash in flue gas due to thermo-chemical processes (Meij et al., 2002; Niksa et al., 2004; Lee et al., 2006; Park et al., 2008). Oxidized mercury (Hg2+) is soluble and has a tendency to associate with the particles in flue gas to form particulate-bound mercury 10
(Hgp). Therefore, emissions of Hg2+, may be efficiently controlled by typical air pollu-tion control devices (APCD), such as electrostatic precipitators (ESP), fabric filter (FF), and flue gas desulfurization (FGD) systems (US EPA, 1997, 2002a, 2000b). However, because the relative proportions of Hg2+, Hgpand Hg0can vary widely, the correspond-ing reductions in total mercury achieved by APCD vary (Pavlish et al., 2003; Srivastava 15
et al., 2006; Lee et al., 2008; Cao et al., 2008a). For example, the removal efficiency of Hg from the flue gas by a combination of cold side ESP and wet FGD range from 24 to 70%. Emission speciation is an important source of uncertainty when assess-ing the atmospheric fate of mercury because Hg2+, Hgp and Hg
0
have very different physic-chemical characteristics and, consequently, different atmospheric lifetimes. 20
As the largest coal producer and consumer in the world, Hg emissions in China have been increasing rapidly in recent years and are getting more and more attentions (Wu et al., 2006; Pirrone et al., 2009). Wu et al. (2006) estimated mercury emissions from coal-fired power plants in China have been growing at annual growth rate of 5.9% during 1995–2003, much higher than the average growth rate of all coal consumption 25
sectors. By 2007, the coal consumption by power generation in China increased to 1.49 billion tons, indicating a even higher annual growth rate during 2004–2007.
ACPD
9, 24051–24083, 2009Mercury emission and speciation of coal-fired power
plants
S. Wang et al.
Title Page
Abstract Introduction
Conclusions References
Tables Figures
◭ ◮
◭ ◮
Back Close
Full Screen / Esc
Printer-friendly Version
Interactive Discussion available for the developed countries such as United States (US EPA, 2002b) and
Japan (Yokoyama et al., 2000; Ito et al., 2006). Due to the paucity on Hg emission rates, speciation profiles from Chinese utility boilers and the capture of Hg in Chinese air pollution control devices, the uncertainty of total Hg emissions was estimated to be approximately−40%/+70% for coal-fired power plants in China (Streets et al., 2005;
5
Wu et al., 2009). There are even higher uncertainties for the speciation profiles. There-fore there has been increasing needs to characterize the Hg emissions from coal-fired power plants in China (Niksa and Fujiwara, 2009; Clack, 2009).
Up to now, mercury emission tests have been conducted only for a few power plants in China (Chen et al., 2007; Zhang et al., 2008; Tang et al., 2007). Chen et al. (2007) 10
and Zhang et al. (2008) reported Hg speciation data based on flue gas monitoring with the Ontario Hydro protocol from 6 plants at the inlets and outlets to the particle collection devices. They found that the average mercury removal efficiencies of the ESP systems was 11%, that of the FF systems was 52%, much lower than the average removal efficiencies of pollution control devices in US plants. The test also indicates 15
the share of Hg0 vs. total Hg in Chinese boilersis much higher than that found in US boilers. For example, the share of Hg0is 26% on average for the outlet of ESPs tested in the US, while such ratio increases to 56% on average for Chinese boilers, which may be mainly because the compositions of Chinese coals differ from those of US coals. At the end of 2008, about 48% of Chinese coal-fired power plants were equipped with 20
FGD. Considering that FGDs are going to be installed in all new units (according to the 11th five-year plan), the application rate of FGDs will reach up to 60% in 2010 and will keep increasing during 2010–2020 (Zhao et al., 2008). However, the test data for Hg emissions from coal-fired power plants with ESPs plus FGD are scarce in China. Therefore, more field tests are needed on more Chinese power plants to 25
understand the full details of mercury partitioning and emissions from Chinese power plants, especially those with ESPs plus FGD.
ACPD
9, 24051–24083, 2009Mercury emission and speciation of coal-fired power
plants
S. Wang et al.
Title Page
Abstract Introduction
Conclusions References
Tables Figures
◭ ◮
◭ ◮
Back Close
Full Screen / Esc
Printer-friendly Version
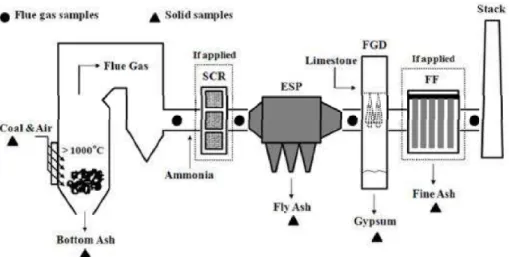
Interactive Discussion Method was used to sample the mercury in flue gases, at the inlet of the APCDs and
at the stack, in order to understand the change in chemical forms of mercury. The fate of Hg in coal-fired power plants, including its removal by APCDs was quantified by collecting and analyzing gaseous samples as well as solid samples such as coal, fly ash, bottom ash, gypsum (by-product from FGD), and effluents. The assessment of 5
mercury emission and total mercury mass balance were estimated by gathered sample data.
2 Experimental methods
2.1 Power plants tested
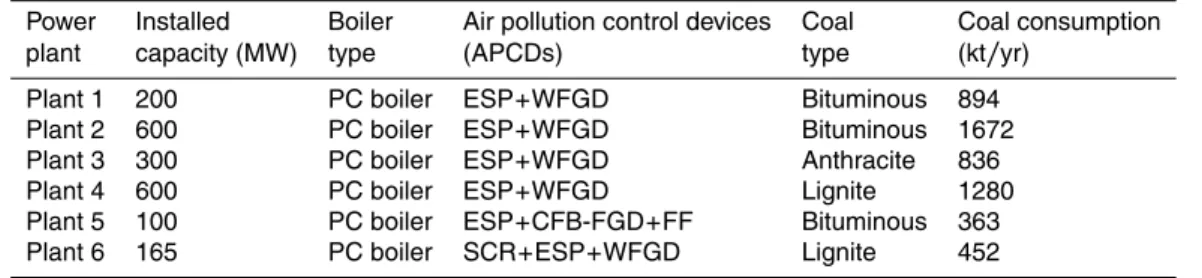
Onsite tests were carried out in six typical coal-fired power plants across China, cov-10
ering the most common unit types in terms of boiler variety, coal quality, and emission control device. As shown in Table 1, all the tested units are pulverized coal boilers ranging from 100 to 600 MW, among these unites, three of them burn bituminous coal, two burn lignite coal and one burns anthracite coal. All tested units have ESP or FF systems for removing particles in flue gases. Five of six tested units install wet FGD 15
while plant 5 uses CFB-FGD, a type of dry FGD, to control SO2 emissions. Plant 6 installs selective catalyst reduction system (SCR) to control NOx emissions. During the test period, all of the power units were operating under normal conditions.
2.2 Sampling and analysis methods
The APCD configuration and all the sampling locations in power plants were shown in 20
ACPD
9, 24051–24083, 2009Mercury emission and speciation of coal-fired power
plants
S. Wang et al.
Title Page
Abstract Introduction
Conclusions References
Tables Figures
◭ ◮
◭ ◮
Back Close
Full Screen / Esc
Printer-friendly Version
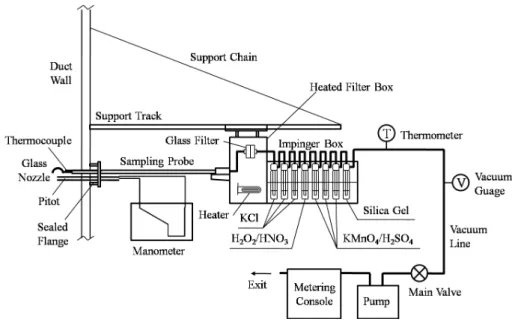
Interactive Discussion an ice bath. The particulate-bound mercury is collected on the quartz fiber filter. The
Hg2+ is collected in the first three impingers with 1.0 mol/L potassium chloride (KCl) solution and Hg0 is collected in subsequent impingers, of which one impinger contain-ing a 5% nitric acid (HNO3) and 10% peroxide (H2O2) solution and three impingers with a solution of 10% sulfuric acid (H2SO4) and 4% potassium permanganate (KMnO4), 5
as shown in Fig. 2.
Liquid and solid samples were collected in the field and analyzed in accordance with US EPA 7470A for liquid samples and 7473 for solid samples. The impinger solutions are recovered and analyzed with Cold Vapor Atomic Absorption Spectrophotometry (CVAAS) type mercury analyzer with a detection limit of 0.005µg/m3. The samples 10
of coal, fly ash, bottom ash and gypsum were analyzed with Direct Mercury Analyzer (Milestone DMA-80, Italy) with a detection limit of 0.05µg/g.
2.3 Quality assurance and quality control (QA/QC)
All sampling tests and analysis were carried out in triplicate or more to obtain parallel results and reduce uncertainties. The parallel tests were found to be reproducible. Dif-15
ferences of tests in each sampling site are within a range of±20%, which is acceptable
for onsite tests. Most of the differences came from the fluctuation of flue gas because of the time difference of sampling. The error in the analytical procedure is less than 5%. The data obtained from tests at the same conditions were averaged to get the final results.
20
Each of the seven impingers in the sampling train of Ontario Hydro Method was recovered and analyzed separately. Thereby the success of the sample collection can be evaluated. For example, if the first KCl impinger collected over 85% of the Hg2+ and the last one collected less than 5%, we could have a reasonable degree of confidence that the Hg2+ had been successfully collected. Otherwise we would 25
ACPD
9, 24051–24083, 2009Mercury emission and speciation of coal-fired power
plants
S. Wang et al.
Title Page
Abstract Introduction
Conclusions References
Tables Figures
◭ ◮
◭ ◮
Back Close
Full Screen / Esc
Printer-friendly Version
Interactive Discussion The removal efficiencies of APCDs can be calculated either by the mercury
con-centration in flue gas at inlet/outlet of APCDs or by the mass balance. The removal efficiency based on the mercury concentration in flue gas at inlet/outlet of APCDs and that based on the mass balancing were compared and their differences were less than 20%.
5
3 Results and discussion
3.1 Properties of feed-coal
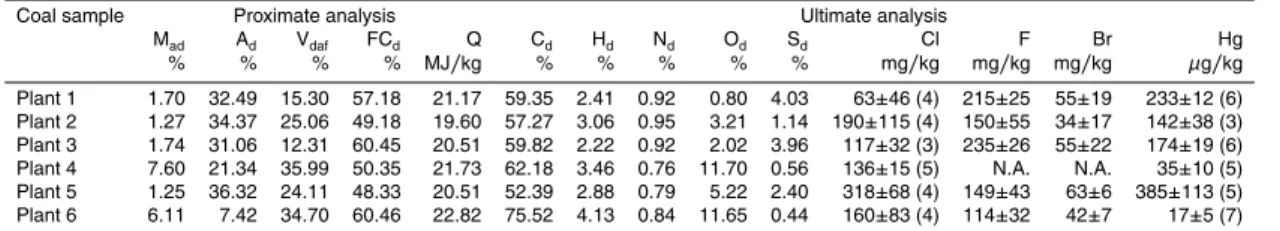
The six selected plants locate in different parts of China, and thus the coals collected from each plant have different qualities. Differences in coals quality may lead to a different behavior of mercury species in the flue gas. The results of proximate and 10
ultimate analysis of feed-coals were presented in Table 2. The contents of mercury, chlorine (Cl) and ash in coal have significant impacts on Hg speciation. The mercury content in these coals varies from 17 to 385µg/kg, which agrees with mercury contents of 10–570µg/kg in Chinese coals found by other researchers (USGS, 2004; Zheng et al., 2007a,b). The chlorine content in feed-coal varies from 63–318 mg/kg, which is 15
much lower than the average value of US coals, 628 mg/kg (Ren et al., 2006). The ash content of tested coals varies from 7.42 to 36.32% and sulfur content ranges from 0.44 to 4.03%. The ash and sulfur content of coals used in plant 1–5 is much higher than that in US coals. To identify the impacts of bromine (Br) and fluorine (F) on Hg emissions, we also analyzed the content of Br and F in tested coals. The results 20
indicate that the fluorine in coal ranges from 114 to 235 mg/kg and bromine from 34 to 63 mg/kg.
3.2 Mercury concentration and speciation in flue gas
ACPD
9, 24051–24083, 2009Mercury emission and speciation of coal-fired power
plants
S. Wang et al.
Title Page
Abstract Introduction
Conclusions References
Tables Figures
◭ ◮
◭ ◮
Back Close
Full Screen / Esc
Printer-friendly Version
Interactive Discussion
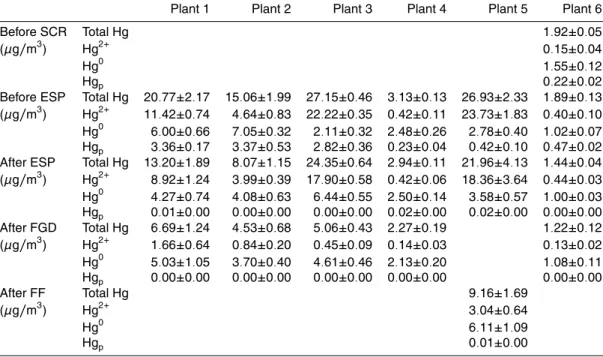
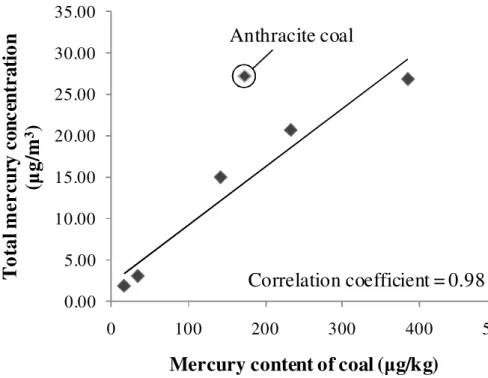
3.2.1 Mercury release from coal combustion
The total mercury concentration in flue gas at inlet of ESP (at inlet of SCR for plant 6) varies at a large range, from 1.92 to 27.15µg/m3. There is significant correlation between the mercury content of coal and the total mercury concentration in flue gas released from the tested boilers (as shown in Fig. 3), with a correlation coefficient 5
of 0.98 for bituminous and lignite coal-fired boilers. The anthracite coal-burning unit emitted higher concentration of total mercury than the bituminous and lignite coal-fired boilers, which is in line with a previous study in Korea (Park et al., 2008). Further study is necessary to investigate the mechanism of Hg release from anthracite.
During combustion, most of the Hg in coal is first released in Hg0 form. With the 10
existence of Cl, Br, and particles in flue gas, part of the Hg0is oxidized into Hg2+either by gas phase oxidation or catalytic oxidation (Galbreath and Zygarlicke, 2000). As the flue gas temperature decrease, part of the Hg0and Hg2+ in the gas phase condenses on or is adsorbed by fly ash particles. According to Table 3, the speciation profile varies a lot among the tested plants. Generally the share of Hg0 to total Hg in flue 15
gas released from lignite coal-burning boilers (80% on average) is significantly higher than that from the bituminous coal-fired boilers (30% on average). On the contrast, the share of Hg2+ to total Hg in flue gas released from lignite coal-burning boilers is significantly lower than that from the bituminous coal-fired boilers. The share of Hgpto total Hg varies from 2 to 22%, which is significantly lower than that from US tests. 20
Halogen in coal can be a key factor influencing Hg speciation. We collected data from over twenty onsite tests and analyzed the effect of chlorine content in coal on mercury speciation in the flue gas released from the boilers, as shown in Fig. 4a. We found that, with three sample points excluded, the correlation coefficient reached 0.75, indicating that chlorine content of coal may have significant effect on distribution 25
ACPD
9, 24051–24083, 2009Mercury emission and speciation of coal-fired power
plants
S. Wang et al.
Title Page
Abstract Introduction
Conclusions References
Tables Figures
◭ ◮
◭ ◮
Back Close
Full Screen / Esc
Printer-friendly Version
Interactive Discussion reactions, M stands for metal and X stands for halogen.
MX(s)−→MX(g) (R1)
MX(g)−→M(g)+X(g) (R2)
Hg(s)−→Hg(g) (R3)
Hg(g)+2X(g)−→HgX
2(g) (R4)
5
The three exceptional sample points in Fig. 4a are probably because of the bromine content of coal. There is evidence that bromine species are capable of enhancing the conversion of Hg0 to Hg2+ (Liu et al., 2007; Cao et al., 2008b; Niksa et al., 2009). We found there was significant correlation between the Hg2+ percentage in flue gas released from the tested boilers and the bromine content of coal (see Fig. 4b), with 10
a correlation coefficient of 0.83. Elemental mercury is a large atom with 80 electrons moving around its nucleus. As a result, it is highly polarizable, and the London dis-persion forces should play an important role in its interaction with surrounding atoms and molecules. The London dispersion forces increase significantly as the size of the atom increases (Liu et al., 2007). Bromine has 35 electrons compared to 17 electrons 15
on Cl. It is expected that Br is more effective than Cl for Hg0 oxidation, leading the Reaction (4) to be more sufficient. The bromine content of coal eventually determines the Hg2+ percentage in the flue gas more than chlorine.
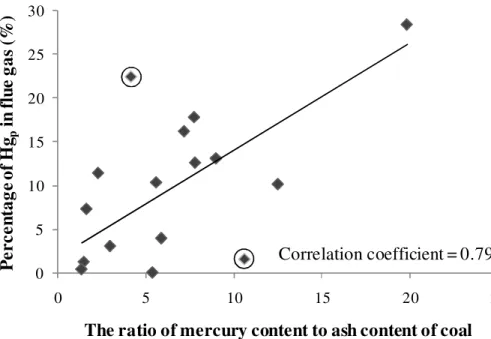
The particulate concentration in flue gas is largely affected by the ash content in coal burned. Particles tend to be the adsorbents in flue gas. Mercury adsorption 20
onto the particulates in flue gas can be considered as mono-molecule-layer adsorption. Therefore, Langmuir’s adsorption isotherm formula (see Eq. 1) can be applied in this case.
γ= K bp
ACPD
9, 24051–24083, 2009Mercury emission and speciation of coal-fired power
plants
S. Wang et al.
Title Page
Abstract Introduction
Conclusions References
Tables Figures
◭ ◮
◭ ◮
Back Close
Full Screen / Esc
Printer-friendly Version
Interactive Discussion In Eq. (1),γ is the total amount of adsorption;K andb are constants; pis the partial
pressure of the adsorbate. Mercury is a trace element in flue gas, which meansbp≪1.
Accordingly, Eq. (1) can be rewritten as Eq. (2):
γ=K bp . (2)
To a certain amount of adsorbent, more mercury leads to higher mercury partial pres-5
sure, and higher partial pressure leads to larger amount of adsorption. In other words, the higher ratio of mercury content to ash content of coal (M/A ratio) contributes to higher adsorption rate, i.e. the Hgp percentage in flue gas. The correlation between M/A ratio and Hgp percentage was tested in Fig. 5. We found that the correlation co-efficient was 0.79 when we removed two exceptional sample points. The exception 10
might have something to do with the temperature, which is another sensitive variable in adsorption process.
3.2.2 Mercury behavior across APCDs
ESP is the most commonly used APCD in coal-fired power plants. In China, more than 90% of total installed power capacity has ESPs. Particulate-bound mercury is 15
simultaneously removed when the particles are captured by ESP. ESPs can capture nearly all Hgp, as shown in Table 3. When flue gas flows through the charging electrode (as shown in Fig. 6), all particles are loaded with negative charge. When the particles with negative charge pass through the collecting boards which have positive charge, they are collected on the dust collecting electrode. Although gas phase mercury is 20
barely removed by ESPs, it does transform continuously across the ducts and devices. Oxidized mercury with positive charge, on the other hand, will move forward along with the flue gas. Therefore, Hg2+ is unlikely to be adsorbed onto particles to transform to Hgp. However, some of the Hg
0
will be adsorbed or oxidized into Hgp or Hg
2+ when
cooling to 400◦C, which explains the fact that total gaseous mercury decreased when 25
ACPD
9, 24051–24083, 2009Mercury emission and speciation of coal-fired power
plants
S. Wang et al.
Title Page
Abstract Introduction
Conclusions References
Tables Figures
◭ ◮
◭ ◮
Back Close
Full Screen / Esc
Printer-friendly Version
Interactive Discussion 5. Another process taking place inside ESP is the transformation of Hg2+ to Hg0. If no
Hg2+ was supposed to be adsorbed to particles, then all the Hg2+ reduction occurred across the ESP because all Hg2+ was transformed into Hg0. The balance between Hg2+ and Hg0was broken when some of the Hg0was adsorbed onto the particles and removed by ESP. To build up a new balance, some Hg2+converts into Hg0. The rate is 5
kinetically controlled and the concentration of Hg2+ played important role, as shown in Fig. 7. As a result, the share of Hg0at outlet of ESP was 46% on average, which was much higher than that at outlet of ESPs tested in the United States (26% on average). Wet FGD is also widely used in Chinese coal-fired power plants. Due to the solubility of Hg2+ in water, 67–98% of Hg2+ was absorbed in the scrubber solution and retained 10
in the FGD gypsum. Higher concentration of Hg2+ in the flue gas led to higher removal efficiency in wet FGD (see Fig. 8). The reduction of Hg0 in flue gas across wet FGD was less than 30%.
Plant 6 is the only tested plant installing SCR. According to Table 3, the three mercury species were redistributed across SCR. The oxidability of flue gas was enhanced in 15
SCR due to the existence of the catalyst. The catalyst can accelerate Reaction (5):
Hg+O2 catalyst
−→ HgO. (R5)
Part of the Hg0was thus transformed to Hg2+. The share of Hg2+in flue gas increased from 8% before SCR to 21% after SCR. On the contrast, the share of Hg0 in flue gas decreased from 81% before SCR to 54% after SCR. Ammonia injection before SCR 20
might have positive effect on the adsorption of mercury onto the particulate matter. That could be the reason why the Hgpconcentration increased. More tests are needed to confirm the effects of SCR and its catalysts on mercury speciation.
Plant 5 is the only plant with CFB-FGD plus FF system. The sticky Hg2+ in flue gas tends to adsorb on the particles when flue gas goes through CFB-FGD and then be 25
ACPD
9, 24051–24083, 2009Mercury emission and speciation of coal-fired power
plants
S. Wang et al.
Title Page
Abstract Introduction
Conclusions References
Tables Figures
◭ ◮
◭ ◮
Back Close
Full Screen / Esc
Printer-friendly Version
Interactive Discussion Final emission from stack to the atmosphere varied from 1.22 to 9.60µg/m3, and
was dominated by Hg0. For the boilers with wet FGD systems, the share of Hg0 to total Hg in stack gas to the atmosphere was 75–94%. For the boiler with ESP+ CFB-FGD+FF system, the share of Hg0 to total Hg in stack gas to the atmosphere was 67%.
5
3.3 Mercury removal efficiencies of APCDs
In this study, the average mercury removal efficiencies of the ESP, ESP+WFGD, and ESP+CFB-FGD+FF systems were 24%, 73% and 66%, respectively, as shown in Fig. 9. The removal efficiencies of ESP for tested power plants, including the results from US, Japan and South Korea, varied significantly from 6 to 52%. The mercury 10
removal efficiencies of ESP+WFGD were around 70% for bituminous coal-fired power plants. The Hg removal efficiency for anthracite coal-burning unit is higher than that for bituminous coal. The lignite coal-burning plants have lowest Hg removal efficiencies.
The overall mercury removal efficiency was in a logarithmic correlation with the total mercury concentration in the flue gas after the boiler (Fig. 10). Shape of the corre-15
lation curve was determined by the chlorine content, bromine content, and M/A ratio of the coal. The combination of SCR+ESP+WFGD has relatively higher mercury re-moval efficiency than ESP+WFGD due to the oxidizing effect of SCR. Combination of ESP+CFB-FGD+FF has a relatively lower efficiency than ESP+WFGD, which in-dicates stronger co-benefit of mercury abatement from wet FGD than from dry FGD 20
system.
3.4 Mercury mass balance in coal-fired power plants
Table 4 shows the Hg concentrations of solid and liquid samples collected in the field. The Hg concentration in bottom ash ranged from 1 to 16µg/kg. The concentration of Hg in fly ash from the ESP hopper varied from 10 to 295µg/kg. The Hg content of 25
ACPD
9, 24051–24083, 2009Mercury emission and speciation of coal-fired power
plants
S. Wang et al.
Title Page
Abstract Introduction
Conclusions References
Tables Figures
◭ ◮
◭ ◮
Back Close
Full Screen / Esc
Printer-friendly Version
Interactive Discussion in fine ash from FF was 2945µg/kg. All of the collected data have been used for the
calculation of mercury mass balance in the coal-fired power plants.
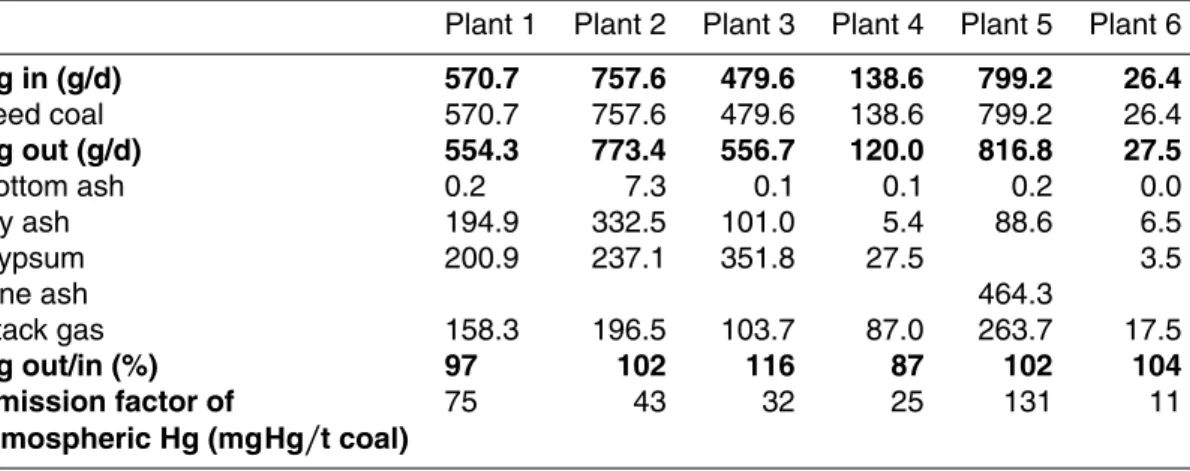
The mercury balance was estimated based on the results of Hg analysis in above sessions. Table 5 gives the details of the daily average mass balance calculations for all the six plants. For all the six power plants, the mercury balances recovery rates 5
ranged from 87 to 116% of the mercury in feed-coals. All the results were within the acceptable error range of±20%.
The mass balance results indicate the fate of mercury across APCDs in power plants. Figure 11 is the summarized diagram with mass distribution of mercury in the coal-fired power plants. Only a very small part (<1%) of Hg in coal was retained in bottom ash. 10
About 5–43% of Hg is collected in the ESP fly ash hopper. About 13–63% of the Hg in coal is captured in gypsum of wet FGD and 19–72% of Hg is emitted to the atmosphere.
3.5 Mercury emission factors
The atmospheric mercury emission factors of each tested power plants are given in Table 5. The emission factor for ESP+WFGD was in the range of 25 to 75 mgHg/t 15
coal. That for SCR+ESP+WFGD was 11 mgHg/t coal and for ESP+CFB-FGD+FF 131 mgHg/t coal. The wide distribution of the emission factors obtained in this study in-dicates that mercury emissions in Chinese power plants are rather complicated. There-fore, great caution shall be taken when apply the mercury emission characteristics measured in US or other countries to estimate mercury emissions in China.
20
4 Conclusions
To investigate the Hg emission characteristics from coal-fired power plants in China, Hg sampling was carried out at six typical power plants burning various types of coals. It was found that the Hg emission was dependent on coal properties and APCDs con-figuration.
ACPD
9, 24051–24083, 2009Mercury emission and speciation of coal-fired power
plants
S. Wang et al.
Title Page
Abstract Introduction
Conclusions References
Tables Figures
◭ ◮
◭ ◮
Back Close
Full Screen / Esc
Printer-friendly Version
Interactive Discussion Type of coal was a major factor affecting the Hg emission and speciation in flue gas
right after the coal-fired boilers without controls. Anthracite coal with a higher concen-tration of Hg emitted than bituminous coal. Mercury speciation was mainly influenced by the content of chlorine and bromine in coal.
Mercury concentration and speciation was changed across APCDs. Some of the 5
Hg0 in flue gas was oxidized to Hg2+ in SCR. Large amounts of particulate-bound Hg were removed through ESP and small amounts of Hg0 oxidized to Hg2+. Around 67– 98% of Hg2+in flue gas was absorbed in the scrubber solution and retained in the FGD gypsum. CFB-FGD plus FF system also removed 80% of Hg2+.
For the six power plants tested, the mercury mass balances varied from 87 to 116% 10
of the input coal mercury to the plants, which was enough to describe the distribution of mercury in the plant. The distribution of mercury confirmed significant amount of Hg removal by ESP and FGD systems. The average mercury removal efficiencies of the ESP, ESP+WFGD, and ESP+CFB-FGD+FF systems were 24%, 73% and 66%, respectively. And 19–72% of Hg in flue gas was emitted to the atmosphere through 15
stack, which was dominated by Hg0.
For a better reliable understanding of the mercury behavior from a coal-fired power plant and other combustion facilities, long-term experiment plan and continuously mon-itoring of the flue gas are necessary.
Acknowledgement. This work was sponsored by Natural Science Foundation of China
20
(No. 20 937 002), Government of Norway (Sino-Norwegian cooperation Project “Capacity build-ing for reducbuild-ing mercury pollution in China-Case Study in Guizhou province”), and Ministry for the Environment, Land and Sea, Republic of Italy. Additional support was from State Key Joint Laboratory of Environment Simulation and Pollution Control in China (No. 08Z03ESPCT). We also would like to express our thanks for the support from the Ministry of Environmental
25
ACPD
9, 24051–24083, 2009Mercury emission and speciation of coal-fired power
plants
S. Wang et al.
Title Page
Abstract Introduction
Conclusions References
Tables Figures
◭ ◮
◭ ◮
Back Close
Full Screen / Esc
Printer-friendly Version
Interactive Discussion
References
ASTM D6784-02: Standard test method for elemental, oxidized, particle-bound, and total mer-cury in flue gas generated from coal-fired stationary sources (Ontario-Hydro Method), ASTM International, Pennsylvania, USA, 2002.
Cao, Y., Cheng, C., Chen, C., Liu, M. , Wang, C., and Pan, W.: Abatement of mercury emissions
5
in the coal combustion process equipped with a Fabric Filter Baghouse, Fuel, 87, 3322– 3330, 2008a.
Cao, Y., Gao, Z., Zhu, J., Wang, Q., Huang, Y., and Chiu, C.: Impacts of halogen additions on mercury oxidation, in a slipstream selective catalyst reduction (SCR), reactor when burning sub-bituminous coal, Environ. Sci. Technol., 42(1), 256–261, 2008b.
10
Chen, L., Duan, Y., Zhuo, Y., Yang, L., Zhang, L., Yang, X., Yao, Q., Jiang, Y., and Xu, X.: Mercury transformation across particulate control devices in six power plants of China: The co-effect of chlorine and ash composition, Fuel, 86(4), 603–610, 2007.
Clack, H.: Mercury capture within coal-fired power plant electrostatic precipitators: model eval-uation, Environ. Sci. Technol., 43, 1460–1466, 2009.
15
Galbreath, K. C. and Zygarlicke, C. J.: Mercury transformations in coal combustion flue gas, Fuel Process. Technol., 65–66, 289–310, 2000.
Ito, S., Yokoyama, T., and Asakura, K.: Emissions of mercury and other trace elements from coal-fired power plants in Japan, Sci. Total Environ., 368, 397–402, 2006.
Lee, C. W., Serre, S. D., Zhao, Y., Lee, S. J., and Hastings, T. W.: Mercury oxidation promoted by
20
a selective catalytic reduction catalyst under simulated powder river basin coal combustion conditions, J. Air Waste Manage., 58, 484–493, 2008.
Lee, S. J., Seo, Y. C., Jang, H. N., Park, K. S., Baek, J. I., An, H. S., and Song, K. C.: Speciation and mass distribution of mercury in a bituminous coal-fired power plant, Atmos. Environ., 40, 2215–2224, 2006.
25
Liu, S., Yan, N., Liu, Z., and Qu, Z.: Using bromine gas to enhance mercury removal from flue gas of coal-fired power plants, Environ. Sci. Technol., 41(4), 1405–1412, 2007.
Meij, R., Vredendregt, L. H. J., and Winkel, H.: The fate and behavior of mercury in coal-fired power plants, J. Air Waste Manage., 52, 912–917, 2002.
Niksa, S. and Fujiwara, N.: Predicting Complete Hg Speciation Along Coal-Fired Utility
Ex-30
ACPD
9, 24051–24083, 2009Mercury emission and speciation of coal-fired power
plants
S. Wang et al.
Title Page
Abstract Introduction
Conclusions References
Tables Figures
◭ ◮
◭ ◮
Back Close
Full Screen / Esc
Printer-friendly Version
Interactive Discussion onlinelibrary, 2004.
Pacyna, E. G., Pacyna, J. M., Steenhuisen, F., and Wilson, S.: Global anthropogenic mercury emission inventory for 2000, Atmos. Environ., 40(22), 4048–4063, 2006.
Park, K. S., Seo, Y. C., Lee, S. J., and Lee, J.: Emission and speciation of mercury from various combustion sources, Powder Technol., 180, 151–156, 2008.
5
Pavlish, J. H., Sondreal, E. A., Mann, M. D., Olson, E. S., Galbreath, K. C., Laudal, D. L., and Benson, S. A.: Status review of mercury control options for coal-fired power plants, Fuel Process. Technol., 82(2–3), 89–165, 2003.
Pirrone, N., Cinnirella, S., Feng, X., Finkelman, R. B., Friedli, H. R., Leaner, J., Mason, R., Mukherjee, A. B., Stracher, G., Streets, D. G., and Telmer, K.: Global Mercury Emissions to
10
the Atmosphere from Natural and Anthropogenic Sources, in: Mercury Fate and Transport in the Global Atmosphere: Emissions, Measurements and Models, edited by: Mason, R. and Pirrone, N., Springer USA, 1–47, doi:10.1007/978-0-387-93958-2, 2009.
Ren, D., Zhao, F., Dai, S., Zhang, J., and Luo, K.: Geochemistry of Trace Elements in Coal, Science Press, Beijing, 2006 (in Chinese).
15
Srivastava, R. K., Hutson N., Martin B., Princiotta F., and Staudt, J.: Control of mercury emis-sions from coal-fired electric utility boilers: an overview of the status of mercury control technologies, Environ. Sci. Technol., 40(5), 1385–1393, doi:10.1021/es062639u, 2006. Streets, D. G., Zhang, Q., and Wu, Y.: Projections of global mercury emissions in 2050, Environ.
Sci. Technol., 43(8), 2983–2988, 2009.
20
Tang, S., Feng, X., Qiu, J., Yin, G., and Yang, Z.: Mercury speciation and emissions from coal combustion in Guiyang, Southwest China, Environ. Res., 105(2), 175–182, 2007.
US EPA: Mercury study report to congress, Vol. VIII, EPA-452/R-97-010, US Environmental Protection Agency, Washington, DC, 1997.
US EPA: Control of mercury emissions from coal-fired electric utility boilers, EPA-600/R-01-109,
25
US Environmental Protection Agency, Washington, DC, 2002a.
US Environmental Protection Agency: ICR data, online available at: http://www.epa.gov/ttn/ atw/combust/utiltox/icrdata.xls, 2002b.
US Geological Survey (USGS), Mercury content in coal mines in China, unpublished data, 2004.
30
ACPD
9, 24051–24083, 2009Mercury emission and speciation of coal-fired power
plants
S. Wang et al.
Title Page
Abstract Introduction
Conclusions References
Tables Figures
◭ ◮
◭ ◮
Back Close
Full Screen / Esc
Printer-friendly Version
Interactive Discussion Wu, Y., Streets, D. G., Wang, S., and Hao, J.: Uncertainties in estimating mercury emissions
from coal-fired power plants in China, Atmos. Chem. Phys., in press, 2009.
Yang, X., Duan, Y., Jiang, Y., and Yang, L.: Research on mercury form distribution in flue gas and fly ash of coal-fired boiler, Coal Sci. Technol., 35(12), 55–58, 2007 (in Chinese with abstract in English).
5
Yokoyama T, Kazuo, U., Matsuda, A. H., Ito, S., and Noda, N.: Mercury emissions from a coal-fired power plant in Japan, Sci. Total Environ., 259, 97–103, 2000.
Zhang, L., Zhuo, Y., Chen, L., Xu, X., and Chen, C.: Mercury emissions from six coal-fired power plants in China, Fuel Process. Technol., 89(11), 1033–1040, 2008.
Zhao, Y., Wang, S., Duan, L., Lei, Y., Cao, P., and Hao, J.: Primary air pollutant emissions
10
of coal-fired power plants in China: current status and future prediction, Atmos. Environ., 42(36), 8442–8452, 2008.
Zheng, L., Liu, G., Qi, C., Chen, Y., and Zhang, Y.: Study on environmental geochemistry of mercury in Chinese coals, J. Univ. Sci. Technol. B., 37(8), 953–963, 2007a.
Zheng, L., Liu, G., and Zhou, C.: The distribution, occurrence and environmental effect of
15
ACPD
9, 24051–24083, 2009Mercury emission and speciation of coal-fired power
plants
S. Wang et al.
Title Page
Abstract Introduction
Conclusions References
Tables Figures
◭ ◮
◭ ◮
Back Close
Full Screen / Esc
Printer-friendly Version
Interactive Discussion Table 1.Information of the onsite tested utility boilers.
Power Installed Boiler Air pollution control devices Coal Coal consumption
plant capacity (MW) type (APCDs) type (kt/yr)
Plant 1 200 PC boiler ESP+WFGD Bituminous 894
Plant 2 600 PC boiler ESP+WFGD Bituminous 1672
Plant 3 300 PC boiler ESP+WFGD Anthracite 836
Plant 4 600 PC boiler ESP+WFGD Lignite 1280
Plant 5 100 PC boiler ESP+CFB-FGD+FF Bituminous 363
Plant 6 165 PC boiler SCR+ESP+WFGD Lignite 452
Notes:
PC boiler – pulverized-coal boiler ESP – electrostatic precipitator FF – fabric filter
FGD – flue gas desulfurization WFGD – wet FGD
ACPD
9, 24051–24083, 2009Mercury emission and speciation of coal-fired power
plants
S. Wang et al.
Title Page
Abstract Introduction
Conclusions References
Tables Figures
◭ ◮
◭ ◮
Back Close
Full Screen / Esc
Printer-friendly Version
Interactive Discussion Table 2.Proximate and ultimate analysis of tested coals.
Coal sample Proximate analysis Ultimate analysis
Mad Ad Vdaf FCd Q Cd Hd Nd Od Sd Cl F Br Hg
% % % % MJ/kg % % % % % mg/kg mg/kg mg/kg µg/kg
Plant 1 1.70 32.49 15.30 57.18 21.17 59.35 2.41 0.92 0.80 4.03 63±46 (4) 215±25 55±19 233±12 (6)
Plant 2 1.27 34.37 25.06 49.18 19.60 57.27 3.06 0.95 3.21 1.14 190±115 (4) 150±55 34±17 142±38 (3)
Plant 3 1.74 31.06 12.31 60.45 20.51 59.82 2.22 0.92 2.02 3.96 117±32 (3) 235±26 55±22 174±19 (6)
Plant 4 7.60 21.34 35.99 50.35 21.73 62.18 3.46 0.76 11.70 0.56 136±15 (5) N.A. N.A. 35±10 (5)
Plant 5 1.25 36.32 24.11 48.33 20.51 52.39 2.88 0.79 5.22 2.40 318±68 (4) 149±43 63±6 385±113 (5)
Plant 6 6.11 7.42 34.70 60.46 22.82 75.52 4.13 0.84 11.65 0.44 160±83 (4) 114±32 42±7 17±5 (7)
ACPD
9, 24051–24083, 2009Mercury emission and speciation of coal-fired power
plants
S. Wang et al.
Title Page
Abstract Introduction
Conclusions References
Tables Figures
◭ ◮
◭ ◮
Back Close
Full Screen / Esc
Printer-friendly Version
Interactive Discussion Table 3.Concentrations of different mercury species in flue gas at each sampling location.
Plant 1 Plant 2 Plant 3 Plant 4 Plant 5 Plant 6
Before SCR Total Hg 1.92±0.05
(µg/m3) Hg2+ 0.15±0.04
Hg0 1.55±0.12
Hgp 0.22±0.02
Before ESP Total Hg 20.77±2.17 15.06±1.99 27.15±0.46 3.13±0.13 26.93±2.33 1.89±0.13
(µg/m3) Hg2+ 11.42±0.74 4.64±0.83 22.22±0.35 0.42±0.11 23.73±1.83 0.40±0.10
Hg0 6.00±0.66 7.05±0.32 2.11±0.32 2.48±0.26 2.78±0.40 1.02±0.07
Hgp 3.36±0.17 3.37±0.53 2.82±0.36 0.23±0.04 0.42±0.10 0.47±0.02
After ESP Total Hg 13.20±1.89 8.07±1.15 24.35±0.64 2.94±0.11 21.96±4.13 1.44±0.04
(µg/m3) Hg2+ 8.92±1.24 3.99±0.39 17.90±0.58 0.42±0.06 18.36±3.64 0.44±0.03
Hg0 4.27±0.74 4.08±0.63 6.44±0.55 2.50±0.14 3.58±0.57 1.00±0.03
Hgp 0.01±0.00 0.00±0.00 0.00±0.00 0.02±0.00 0.02±0.00 0.00±0.00
After FGD Total Hg 6.69±1.24 4.53±0.68 5.06±0.43 2.27±0.19 1.22±0.12
(µg/m3) Hg2+ 1.66±0.64 0.84±0.20 0.45±0.09 0.14±0.03 0.13±0.02
Hg0 5.03±1.05 3.70±0.40 4.61±0.46 2.13±0.20 1.08±0.11
Hgp 0.00±0.00 0.00±0.00 0.00±0.00 0.00±0.00 0.00±0.00
After FF Total Hg 9.16±1.69
(µg/m3) Hg2+ 3.04±0.64
Hg0 6.11±1.09
ACPD
9, 24051–24083, 2009Mercury emission and speciation of coal-fired power
plants
S. Wang et al.
Title Page
Abstract Introduction
Conclusions References
Tables Figures
◭ ◮
◭ ◮
Back Close
Full Screen / Esc
Printer-friendly Version
Interactive Discussion Table 4.Mercury contents in solid samples.
Plant 1 Plant 2 Plant 3 Plant 4 Plant 5 Plant 6
Feed coal (µg/kg) 233±12 (6) 142±38 (3) 174±19 (6) 35±10 (5) 385±113 (5) 17±5 (7)
Bottom ash (µg/kg) 3±1 (6) 16±4 (4) 7±3 (3) 3±1 (3) 3±1 (6) 1±0 (7)
Fly ash (µg/kg) 295±59 (5) 245±34 (5) 160±19 (4) 10±2 (6) 134±36 (4) 24±3 (6)
Gypsum (µg/kg) 368±108 (3) 561±8 (3) 309±12 (6) 90±7 (4) 38±4 (5)
Fine ash (µg/kg) 2945±132 (3)
ACPD
9, 24051–24083, 2009Mercury emission and speciation of coal-fired power
plants
S. Wang et al.
Title Page
Abstract Introduction
Conclusions References
Tables Figures
◭ ◮
◭ ◮
Back Close
Full Screen / Esc
Printer-friendly Version
Interactive Discussion Table 5.Mass balance and emission factors of the tested coal-fired power plants.
Plant 1 Plant 2 Plant 3 Plant 4 Plant 5 Plant 6
Hg in (g/d) 570.7 757.6 479.6 138.6 799.2 26.4
Feed coal 570.7 757.6 479.6 138.6 799.2 26.4
Hg out (g/d) 554.3 773.4 556.7 120.0 816.8 27.5
Bottom ash 0.2 7.3 0.1 0.1 0.2 0.0
Fly ash 194.9 332.5 101.0 5.4 88.6 6.5
Gypsum 200.9 237.1 351.8 27.5 3.5
Fine ash 464.3
Stack gas 158.3 196.5 103.7 87.0 263.7 17.5
Hg out/in (%) 97 102 116 87 102 104
Emission factor of 75 43 32 25 131 11
ACPD
9, 24051–24083, 2009Mercury emission and speciation of coal-fired power
plants
S. Wang et al.
Title Page
Abstract Introduction
Conclusions References
Tables Figures
◭ ◮
◭ ◮
Back Close
Full Screen / Esc
Printer-friendly Version
ACPD
9, 24051–24083, 2009Mercury emission and speciation of coal-fired power
plants
S. Wang et al.
Title Page
Abstract Introduction
Conclusions References
Tables Figures
◭ ◮
◭ ◮
Back Close
Full Screen / Esc
Printer-friendly Version
ACPD
9, 24051–24083, 2009Mercury emission and speciation of coal-fired power
plants
S. Wang et al.
Title Page
Abstract Introduction
Conclusions References
Tables Figures
◭ ◮
◭ ◮
Back Close
Full Screen / Esc
Printer-friendly Version
Interactive Discussion
0.00 5.00 10.00 15.00 20.00 25.00 30.00 35.00
0 100 200 300 400 500
T
o
ta
l
m
e
r
c
u
ry
c
o
n
c
en
tr
a
ti
on
(
μ
g
/m
3
)
Mercury content of coal (μg/kg)
Correlation coefficient = 0.98
Anthracite coal
ACPD
9, 24051–24083, 2009Mercury emission and speciation of coal-fired power
plants
S. Wang et al.
Title Page Abstract Introduction Conclusions References Tables Figures ◭ ◮ ◭ ◮ Back Close
Full Screen / Esc
Printer-friendly Version Interactive Discussion 0 10 20 30 40 50 60 70 80 90 100
0 200 400 600 800 1000 1200
P e r c e n ta g e o f Hg 2+ in f lu e g a s (%)
Chlorine content of coal (mg/kg)
Correlation coefficient = 0.75
(a) Chlorine 0 10 20 30 40 50 60 70 80 90
30 35 40 45 50 55 60 65 70
P e r c e n ta g e o f Hg 2+ in f lu e g a s (%)
Bromine content of coal (mg/kg)
Correlation coefficient = 0.83
(b) Bromine
2+
ACPD
9, 24051–24083, 2009Mercury emission and speciation of coal-fired power
plants
S. Wang et al.
Title Page
Abstract Introduction
Conclusions References
Tables Figures
◭ ◮
◭ ◮
Back Close
Full Screen / Esc
Printer-friendly Version
Interactive Discussion
0 5 10 15 20 25 30
0 5 10 15 20 25
P
e
r
ce
n
ta
g
e
o
f
Hg
p
in
f
lu
e
g
a
s
(%)
The ratio of mercury content to ash content of coal
Correlation coefficient = 0.79
ACPD
9, 24051–24083, 2009Mercury emission and speciation of coal-fired power
plants
S. Wang et al.
Title Page
Abstract Introduction
Conclusions References
Tables Figures
◭ ◮
◭ ◮
Back Close
Full Screen / Esc
Printer-friendly Version
Interactive Discussion
Dust collecting electrode (+)
Dust collecting electrode (+)
Dust charging
electrode (
–
)
–
–
Hg2+
Hg2+
–
–
– –
– –
– – –
–
–
–
– –
Hg0
Hg2+
Hg2+
Hg0
Hg0
Hg2+ Reactive gaseous Hg0
mercury (RGM)
Gaseous elemental mercury (GEM)
Particulate matter (PM)
Hg0
ACPD
9, 24051–24083, 2009Mercury emission and speciation of coal-fired power
plants
S. Wang et al.
Title Page
Abstract Introduction
Conclusions References
Tables Figures
◭ ◮
◭ ◮
Back Close
Full Screen / Esc
Printer-friendly Version
Interactive Discussion
-1.00 0.00 1.00 2.00 3.00 4.00 5.00 6.00
0.00 5.00 10.00 15.00 20.00 25.00
C
o
n
c
e
n
tr
a
ti
o
n
o
f
Hg
2+
tr
a
n
sf
o
rm
e
d
to
Hg
0
in
si
d
e
E
S
P
(
μ
g
/m
3
)
Hg
2+concentration in flue gas before ESP (
μ
g/m
3)
Correlation coefficient = 0.99
ACPD
9, 24051–24083, 2009Mercury emission and speciation of coal-fired power
plants
S. Wang et al.
Title Page
Abstract Introduction
Conclusions References
Tables Figures
◭ ◮
◭ ◮
Back Close
Full Screen / Esc
Printer-friendly Version
Interactive Discussion
60% 65% 70% 75% 80% 85% 90% 95% 100%
0.00 5.00 10.00 15.00 20.00
R
e
m
o
v
a
l
r
a
te
o
f
Hg
2+
b
y
W
F
GD
Hg
2+concentration before WFGD (
μ
g/m
3)
Correlation coefficient = 0.98
ACPD
9, 24051–24083, 2009Mercury emission and speciation of coal-fired power
plants
S. Wang et al.
Title Page
Abstract Introduction
Conclusions References
Tables Figures
◭ ◮
◭ ◮
Back Close
Full Screen / Esc
Printer-friendly Version
Interactive Discussion 0
10 20 30 40 50 60 70 80 90
Plant 1 Plant 2 Plant 3 Plant 4 Plant 5 Plant 6 U. S. Japan S. Korea
M
e
r
c
u
r
y
r
e
m
o
v
a
l
e
ff
ic
ien
c
y
(
%)
ESP ESP+WFGD
ESP+CFB-FGD+FF Bit. Bit.
Bit. Bit. Bit. Anth.
Lig.
Lig.
ACPD
9, 24051–24083, 2009Mercury emission and speciation of coal-fired power
plants
S. Wang et al.
Title Page
Abstract Introduction
Conclusions References
Tables Figures
◭ ◮
◭ ◮
Back Close
Full Screen / Esc
Printer-friendly Version
Interactive Discussion
0% 20% 40% 60% 80% 100%
0.00 5.00 10.00 15.00 20.00 25.00 30.00
O
v
er
a
ll
m
e
rc
u
ry
r
em
ov
a
l
e
ff
ic
ie
n
cy
Total mercury concentration in the flue gas after boiler (μg/m3)
ESP+WFGD
ESP+CFB-FGD+FF
SCR+ESP+WFGD
ACPD
9, 24051–24083, 2009Mercury emission and speciation of coal-fired power
plants
S. Wang et al.
Title Page
Abstract Introduction
Conclusions References
Tables Figures
◭ ◮
◭ ◮
Back Close
Full Screen / Esc
Printer-friendly Version
Interactive Discussion
0% 10% 20% 30% 40% 50% 60% 70% 80% 90% 100%
Plant 1 Pla nt 2 Plant 3 Pla nt 4 Plant 5 Pla nt 6
M
a
ss
d
is
tr
ib
u
ti
on
Bottom ash Fly ash Gypsum Fine ash Stack gas