* Biochemistry Department, Molecular Biology Laboratory, Faculty of Medicine, ABC Foundation – São Paulo/SP, Brazil.
** Head and Neck Surgery Department, Hospital das Clínicas, São Paulo University Medical School – São Paulo/SP, Brazil.
*** Pathology Department, Immunohistochemistry Laboratory (Lim05), São Paulo University Medical School.
E-mail: [email protected]
Received for publication on March 30, 2006. Accepted for publication on June 19, 2006.
CLINICAL SCIENCES
IMMUNOHISTOCHEMISTRY QUANTIFICATION BY A
DIGITAL COMPUTER-ASSISTED METHOD
COMPARED TO SEMIQUANTITATIVE ANALYSIS
Leandro Luongo de Matos,* Elaine Stabenow,** Marcos Roberto Tavares,** Alberto Rosseti Ferraz,** Vera Luiza Capelozzi,*** Maria Aparecida da Silva Pinhal*
de Matos LL, Stabenow E, Tavares MR, Ferraz AR, Capelozzi VL, Pinhal MAS. Immunohistochemistry quantification by a digital computer-assisted method compared to semiquantitative analysis. Clinics. 2006;61(5):417-24.
PURPOSE: To compare immunostaining quantification obtained by a digital computer-assisted method with the well-established semiquantitative analysis.
METHODS: Cytoplasmic staining of galectin-3 was obtained by standard immunohistochemical reactions in 25 cases of well-differentiated thyroid carcinoma. The expression index that associates the conventional area fraction of labeled cells with the immunostaining intensity score based on visual qualitative observation was used as the semiquantitative analysis. A digital computer-assisted method is described based on the use of an image processing program (ImageLab®). Three parameters were obtained: (1)
percentage of labeled cells; (2) digital immunostaining intensity, and (3) digital expression index. The proposed method allows numerical analysis of the immunostaining intensity.
RESULTS: There was a strong correlation between the immunostaining intensity obtained by the two methods (Pearson correlation coefficient, r = 0.71, P = 0.0001). The same was observed between expression indexes (Pearson correlation coefficient, r = 0.66, P = 0.0001).
CONCLUSION: Results obtained with our proposed digital computer-assisted method for immunoexpression analysis were concordant with the semiquantitative analysis. In addition, digital values can also resolve disagreement among different observers about the quality of staining intensity because the digital method does not classify the results into groups, but rather provides a numerical value for each individual case; thus, it increases the diagnostic and, more importantly, the prognostic sensitivity of the immunohistochemical analysis.
KEYWORDS: Digital computer-assisted image analysis. Immunohistochemical quantification. Galectin-3. Well-differentiated thyroid carcinoma.
INTRODUCTION
Immunohistochemistry is a well-established method in clinical practice that allows staining of cellular components
and extracellular matrix by specific antibodies. In surgical pathology, it is used as a diagnostic tool to differentiate be-nign and malignant tissues. As a prognostic tool, it is used to study the presence of molecules involved in cancer ag-gressiveness.1
immunostaining score that associates the area fraction of labeled cells with a staining intensity score based on visual qualitative observation. This has now become a well-estab-lished method.
Computer-assisted analysis of digital images was used for the first time in 1980 to quantify immunostaining.4 Since then, several authors have applied this technology using different methods.5-16
Digital images can be translated into numerical values, and these values are able to describe staining intensity as a numeric variable, which is more precise than visual quali-tative observation. Considering numerical data for staining intensity and percentage of labeled cells, a combined dig-ital immunostaining index can be defined.
The purpose of this study was to compare immunostaining intensity quantification by a digital com-puter-assisted analysis with the semiquantitative method3 to verify the concordance of these techniques and identify advantages of one method over the other.
METHODS
Twenty-five consecutive cases of well-differentiated thy-roid carcinoma classified according to World Health Or-ganization criteria were studied. All patients were surgi-cally treated at the Hospital das Clínicas of São Paulo Uni-versity Medical School.
IMMUNOHISTOCHEMICAL STAINING
Representative tumor areas were chosen based on hematoxylin and eosin-stained sections. The correspond-ing archived paraffin-embedded specimens were sectioned into 3 µm slices, and immunohistochemical staining was performed according to the standard avidin-biotin immunoperoxidase complex technique. Mouse monoclonal anti-human galectin-3 antibody (LabVision®, California, USA) was diluted in a 1:40 proportion and used as the pri-mary antibody.
The brownish-color was considered to be evidence of a positive expression of galectin-3 in the tumor cells. His-tological slices of normal human tongue were used as con-trols. Unstained red blood cells and labeled foamy cells were considered, respectively, as negative and positive in-ternal controls.
QUANTIFICATION OF IMMUNOEXPRESSION
Slides were analyzed using a TS100 Nikon Eclipse® light microscope to identify areas that best represented galectin-3 immunostaining (hot spots). For each case, the
quantification of immunostaining was made by 2 different methods: semiquantitative and computer-assisted digital image analysis.
Digital Computer-Assisted Method
From each case, photomicrographs of 640x480 pixels were obtained from noncoincident consecutive fields, at a magnification of X400, with a 4300 Nikon Coolpix® dig-ital camera, adjusted to these parameters. The obtained im-ages were analyzed by the imaging processing and analy-sis system, ImageLab® (Softium Informática®, São Paulo, Brazil), adjusted to the micrometric scale (µm).
Percentage of labeled cells (PLC)
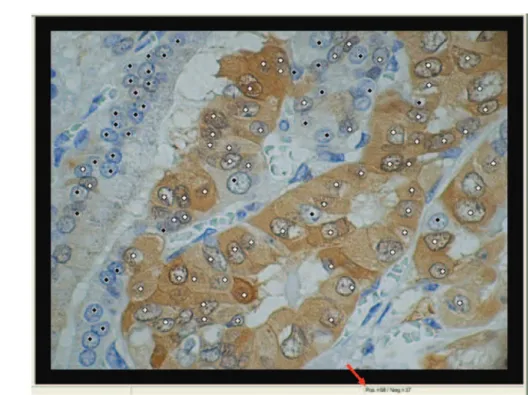
At least 1,000 tumor cells of epithelial origin, for each case, were counted by the ImageLab® while the observer classified them as positive or negative cells (Figure 1). Thus, the percentage of labeled cells (PLC) was deter-mined, according to the following equation:
number of labeled cells
PLC = —————————— x 100 → [%]
total counted cells
Digital Immunostaining Intensity (ITIdig)
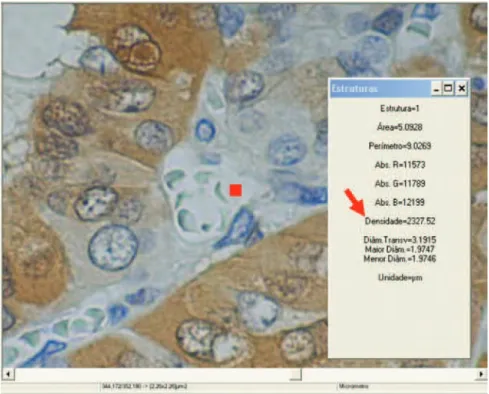
ImageLab® was used to quantify the intensity of brown-ish-color immunostaining. For each case, the same photomicrographs used for determining the PLC were con-sidered. Twelve randomized labeled cytoplasmic regions from different cells were indicated, with the same-sized square (tool of ImageLab® system). The average optical density (OD) of these areas was automatically calculated and represents the average of red, green, and blue color composition (RGB) per area of cytoplasm analyzed (Fig-ure 2), expressed in optical units per micrometer squared (ou/µm2).
The same procedure was applied to obtain the back-ground optical density (BOD) from an area without tissue or vascular space (Figure 3) for each photomicrograph. A single area was enough, since the background was constant in each photomicrograph.
The absolute white color that corresponds to the maxi-mum optical density (3207 ou/µm2) is composed by the to-tality of red, green, and blue; and black is the absence of these colors. Therefore, the optical density values calcu-lated by the program make up a decreasing scale in which the high values correspond to the colors that are visually clear.
Figure 2 - ImageLab® software demonstration. (A) Manual determination of 12 cytoplasmic-labeled areas with peroxidase (red squares); (B) Tables
showing the results, the arrow indicates the optic density of the total selected area.
Figure 1 - Demonstration of ImageLab® software in the identification of positive labeled cells (white spots) and negative cells (black spots). The calculation
of PLCDIG is indicated by the arrow.
immunostaining intensity (ITIdig) for each case, whose val-ues make up an increasing scale, equalized by the BOD, proportionally to the optical density of absolute white.
320.7 x Σ OD
ITIdig = 320.7 - ——————— → [ou/µm2]
Σ BOD
Digital expression index (EIdig)
PLC
EIdig = ——— x ITIdig→ [ou/µm2] 100
Semiquantitative Analysis
The semiquantitative analysis (as described by Klein)3 was obtained by calculation of the expression index (EIsq) that associates the area fraction of labeled cells (ALC) with the immunostaining intensity (ITIsq) obtained by visual qualitative observation categorized as described above.
Five noncoincident microscopic fields at X400 magni-fication were consecutively analyzed by the TS100Nikon Eclipse® light microscope equipped with a 100-point grid. Labeled cells that coincided with grid points were counted, and the area fraction of labeled cells was determined ac-cording to the following equation:
total of counted labeled cells
ALC= ———————————— x 100 → [%]
500
The ALC values were categorized into 4 scores as fol-lows: 0, absence of labeled tumor cells; 1, 0% to 10% of labeled tumor cells; 2, from 11% to 50%; and 3, above 50% of labeled tumor cells. A score of 0 to 3 was attributed to the immunostaining intensity (ITISQ) as follows: 0, no stain-ing; 1, weak; 2, mild; 3, strong intensity. Finally, the ex-pression index (EISQ) was determined by multiplying the
Table 1 - Averages of galectin-3 ITI obtained by the digital computer-assisted method (ITIDIG) according to the scores of staining defined by the semiquantitative analysis (ITISQ).
ITISQ Scores n ITIDIG Average *
No staining 1 0.0 ± 0.0 ou/µm2
Weak 8 54.9 ± 5.3 ou/µm2
Mild 7 72.9 ± 17.3 ou/µm2
Strong 9 96.4 ± 17.9 ou/µm2
Total 25
* Average ± standard deviation (ANOVA. P = 0.0001). n: number of patients in each ITISQ score.
Figure 3 - ImageLab® software defining the area where there is no tissue reaction (red square) and the calculation of its optic density (arrow).
ALC and the ITISQ as follows: no staining, weak (1, 2, or 3 points), mild (4 points) and strong (6, 7, or 9 points).
RESULTS
The ALC varied from 0% to 60.8% and PLC from 0% to 94%. Only one case did not present cytoplasmic immunostaining.
significant difference was found between them and ITIdig average of the mild group. A significant correlation was observed between ITIsq and ITIdig (Pearson correlation co-efficient, r = 0.71, P = 0.0001).
The EIdig varied from 0 to 94.2 ou/µm2, with an aver-age of 47.6 ± 26.9 ou/µm2. The averages of the immunostaining indexes of galectin-3 obtained by the dig-ital method, according to the immunostaining score defined by the semiquantitative method are represented in Table 2. There was significant difference between the EIdig average of the weak group and EIdig average of the strong group (ANOVA, P = 0.0001; Bonferroni test, P = 0.007), but no significant difference between them and EIdig average of the mild group. A significant correlation was observed between EIsq and EIdig (Pearson correlation coefficient, r = 0.66, P = 0.0001).
DISCUSSION
This paper describes a digital computer-assisted quan-tification method of immunostaining for biological mark-ers by the immunohistochemical technique, using cytoplas-mic staining of galectin-3 in well-differentiated thyroid car-cinomas. It is important to note that this method has been used with other biological markers by immunohistochem-istry in many types of tumors (for example, heparanase, caspase-3, bcl-2, bax, CEA, and prolactin-3 in lung, ovar-ian, breast, rectal cancers, and melanoma), showing simi-lar statistically significant results.
The semiquantitative method of immunostaining inten-sity (ITISQ) was used by Klein et al3 in a study of immuno-histochemical expression of the vascular endothelial growth factor in thyroid papillary carcinoma. Through visual ob-servation and the use of a scoring system, they classified immunostaining intensity as absent, weak, mild, or strong. Generally, digital image processing aims to improve the quantification of immunostaining17 and does not classify results into groups.
Two independent observers can describe the
immunostaining intensity of a determined area in differ-ent ways. Weaker- or stronger-stained areas do not require deeper discussions because independent observers usually agree on these categories. However, moderate upper or lower borderline-staining intensity can cause problems. In these cases, techniques that establish a numerical value for the staining intensity offer a uniform way to quantify the intensity in a defined area.17 Software capture of immuno-histochemical images can be used for this purpose, as in the method that is being proposed here.
The results of this study show that for extreme stain-ing intensities, there was a high concordance between the semiquantitative and the digital methods. In contrast, tumors with mild intensity scores produced divergent re-sults between semiquantitative and digital immunostaining intensity analysis. This suggests that there is disagreement between observers about the quality of intermediary intensities that could be resolved by the proposed digital quantification.
Tomatis et al18 reported that an image analysis system was more precise than visual observation for separating melanomas from benign nevus, mainly in the intensity of hyperpigmentation and variety of colors of the lesion, sug-gesting greater accuracy with the digital quantification method compared to conventional visualization. Ruifrok19 used digital image analysis to quantify the immunostaining of the growth factors EGF and TNF for the diaminobenzidine chromogen in fasting mice, separating, by manual subtraction of the RGB, the hematoxylin mark-ing. Other authors20-22 have used the automatic subtraction of RGB using the “magic wand tool,” available in the Photoshop® software, to determine the immunostaining in-tensity and in an attempt to quantify the concentration of antibodies used in the immunohistochemistry. This auto-mated form has the inconvenience of introducing small er-rors into the final reading of the immunostaining intensity in cases where the limits among the colors to be subtracted are imprecise. It is also not possible to separate immunostaining of areas outside the cell compartment to be studied.17 Moreover, tumor regions not exactly express-ing the ITI expression chosen for the analysis are not con-sidered in the calculation and, therefore, are not repre-sented.17 In our proposed method, the optic density of immunoexpression is determined without the subtraction of RGB for the determination of only the cytoplasmic area of the labeled cells in all the photomicrographs studied, thus representing the immunostaining intensity diversity case by case, without the possibility of going askew and considering structures that should not be analyzed and of leaving out regions more or less expressed.
When the digitalization of an image is done, the color
Table 2 – Averages of galectin-3 EI obtained by the digital computer-assisted method (EIDIG) according to the scores of staining defined by the semiquantitative analysis (EISQ)
EISQ Scores n EIDIG Average *
No staining 1 0.0 ± 0.0 ou/µm2
Weak 9 30.6 ± 18.3 ou/µm2
Mild 5 54.3 ± 27.1 ou/µm2
Strong 10 64.2 ± 20.7 ou/µm2
Total 25
tones do not occupy all the scales available; that is a par-ticular and intrinsic feature of each obtained photomicro-graph, making comparison between two photomicrographs impossible. To get around this situation, the scale of colors can be modified artificially so that they occupy the same and greatest interval possible. This procedure has been named equalization.17 Many investigators do not recognize the importance of this fact18-23 and so do not equalize the images obtained, possibly causing errors in obtaining the ITI values. One form of equalization is the use of digital cameras of the highest resolution with the best light fil-ters.24 The images thus obtained have exactly the same color spectrum, but this equipment increases the cost of the sys-tem, limiting its utility. The method proposed in this study uses a simple algorithm for the equalization of images that makes the measurement of the ITI proportional to the back-ground optic density (BOD), in relation to the optic den-sity of absolute white, for each photomicrograph analyzed. This solves the intrinsic problems of the immunohisto-chemical method itself as well as the problem of the elec-tronic noise that can result in a color spectrum that is dif-ferent among the digital images; it also enables a compari-son of the immunostaining among the different cases analyzed.
In contrast to the methods proposed by other
investi-gators who have sought to measure the concentration of the chromogen by obtaining its intensity20,22 and expression in-dex,23 the method described in this study aims to enable a comparison among the cases without the application of in-tensity scores.3
By comparing immunostaining quantification obtained by a digital computer-assisted method with a well-estab-lished semiquantitative analysis, we conclude that results of both methods are concordant. However, digital measure-ment could resolve disagreemeasure-ment between two observers about the quality of staining intensity because the digital method does not classify the results into groups, but rather provides a numerical value for each individual case and, thus, increases the diagnostic and, above all, prognostic sen-sitivity of the immunohistochemical analysis.
ACKNOWLEDGEMENTS
We express our gratitude to Sandra de Moraes Fernezlian, Esmeralda Miristene Eher, Angela Batista dos Santos (Immunohistochemical Laboratory), technicians of the Pathology Department of the University of São Paulo Medical School (Lim05), for the vital role they played and dedicated work in the immunohistochemical reactions. This study was supported by NEPAS, FAPESP and CAPES.
RESUMO
de Matos LL, Stabenow E, Tavares MR, Ferraz AR, Capelozzi VL, Pinhal MAS. Método digital assistido por computador de quantificação imunohistoquímica compara-do à análise semiquantitativa. Clinics. 2006;61(5):417-24.
OBJETIVO: Comparar a quantificação da imunomarcação
através de um método digital assistido por computador à bem estabelecida análise semiquantitativa.
MÉTODO: A marcação citoplasmática de galectina-3 foi
obtida por reações imunohistoquímicas em 25 casos de car-cinoma bem-diferenciado da glândula tireóide. Determinou-se o índice de expressão da análiDeterminou-se Determinou-semiquantitativa que
associa a convencional fração de área de células marcadas com os escores de intensidade da imunoexpressão, com base na observação visual qualitativa. O método digital as-sistido por computador foi desenvolvido com o uso de um programa de análise de imagem (ImageLab®). Três parâmetros foram obtidos: (1) porcentagem de células marcadas; (2) intensidade de imunoexpressão digital e (3) índice de expressão digital. O método proposto resulta na análise numérica da intensidade de imunoexpressão.
RESULTADOS: Houve importante correlação entre as
O mesmo foi observado entre os índices de expressão (co-eficiente de correlação de Pearson, r=0,66, p=0,0001).
DISCUSSÃO: Os resultados de intensidade de
imunoexpressão obtidos com o emprego do método digi-tal assistido por computador foram concordantes com os escores da análise semiquantitativa. Entretanto, os resulta-dos alcançaresulta-dos com o emprego do método digital podem resolver a discordância entre diferentes observadores com relação a esta intensidade de imunomarcação. Além disso,
o método proposto não categoriza os resultados em gru-pos, o que torna a análise imunohistoquímica numerica-mente mensurável individualnumerica-mente, aumentando seu poder diagnóstico e, sobretudo, prognóstico.
UNITERMOS: Análise digital de imagens. Quantificação
imunohistoquímica. Morfometria. Galectina-3. Carcinoma bem-diferenciado da tireóide.
REFERENCES
1. Alves VAF, Bacchi CE, Vassallo J. Manual de imuno-histoquímica. São Paulo: Sociedade Brasileira de Patologia; 1999.
2. Gundersen HJ, Bendtsen TF, Korbo L, Marcussen N, Moller A, Nielsen K, et al. Some new, simple and efficient stereological methods and their use in pathological research and diagnosis. Apmis. 1988;96:379-94. 3. Klein M, Vignaud JM, Hennequin V, Toussaint B, Bresler L, Plénat F, et
al. Increased expression of the vascular endothelial growth factor is a pejorative prognosis marker in papillary thyroid carcinoma. J Clin Endocrinol Metab. 2001;86:656-8.
4. Schuh D, Steidl R, Voss K. The differential diagnosis of follicular adenomas and carcinomas in fine needle biopsies of the thyroid gland by means of automatic image analysis. Zentralbl Allg Pathol. 1980;124:557-60.
5. Zhu QY. Analysis of blood vessel invasion by cells of thyroid follicular carcinoma using image processing combined with immunohistochemistry. Zhonghua Yi Xue Za Zhi. 1989;69:573-5. 6. Holschbach A, Kriete A, Schaffer R. Differential diagnosis of papillary
carcinomas of the thyroid, using image analysis and three dimensional reconstruction from serial sections. Verh Dtsch Ges Pathol. 1990;74:270-4.
7. Jensen MH, Davis RK, Derrick L. Thyroid cancer: a computer-assisted review of 5287 cases. Otolaryngol Head Neck Surg. 1990;102:51-65.
8. Salmon I, Kiss R, Franc B, Gasperin P, Heimann R, Pasteels JL, et al. A. Comparison of morphonuclear features in normal, benign and neoplastic thyroid tissue by digital cell image analysis. Anal Quant Cytol Histol. 1992;14:47-54.
9. Tseleni S, Kavantzas N, Yova D, Alexandratou E, Karydakis V, Gogas J, et al. Findings of computerised nuclear morphometry of papillary thyroid carcinoma in correlation with known prognostic factors. J Exp Clin Cancer Res. 1997;16:401-6.
10. Gordower L, Decaestecker C, Kacem Y, Lemmers A, Gusman J, Burchert M, et al. Galectin-3 and galectin-3-binding site expression in human adult astrocytic tumours and related angiogenesis. Neuropathol Appl Neurobiol. 1999;25:319-30.
11. Gupta N, Sarkar C, Singh R, Karak AK. Evaluation of diagnostic efficiency of computerized image analysis based quantitative nuclear parameters in papillary and follicular thyroid tumors using paraffin-embedded tissue sections. Pathol Oncol Res. 2001;7:46-55. 12. Kavantzas N, Tseleni-Balafouta S, Davaris P. Computerized nuclear
morphometry and quantitation of angiogenesis in thyroid neoplasms. J Exp Clin Cancer Res. 2002;21:247-54.
14. Silva Junior AN, Pinheiro AL, Oliveira MG, Weismann R, Ramalho LM, Nicolau RA. Computerized morphometric assessment of the effect of low-level laser therapy on bone repair: an experimental animal study. J Clin Laser Med Surg. 2002;20:83-7.
15. Rald DP, Lage-Marques JL. In vitro evaluation of the effects of the interaction between irrigating solutions, intracanal medication and Er:YAG laser in dentin permeability of the endodontic system. Pesqui Odontol Bras. 2003;17:278-85.
16. Borra RC, Andrade PM, Silva ID, Morgun A, Weckx LL, Smirnova AS, et al. The Th1 /Th2 immune-type response of the recurrent aphthous ulceration analyzed by cDNA microarray. J Oral Pathol Med. 2004;33:140-6.
17. Novelli MD, Barreto E, Matos D, Saad SS, Borra RC. Computer-assisted image processing for quantifying histopathologic variables in the healing of colonic anastomosis in dogs. Rev Ass Med Brasil. 1999;43:277-82. 18. Tomatis S, Bono A, Bartoli C, Tragni GBF, Marchesini R Image analysis in the RGB and HS colour planes for a computer-assisted diagnosis of cutaneous pigment lesions. Tumori. 1998;84:29-32.
19. Ruifrok AC. Quantification of immunohistochemical staining by color translation and automated thresholding. Anal Quant Cytol Histol. 1997;19:107-13.
20. Lehr H, Mankoff DA, Corwin D, Santeusanio G, Gown AM. Application of Photoshop-based image analysis to quantification of hormone receptor expression in breast cancer. J Histochem Cytochem. 1997;46:1559-65.
21. Lehr H, van der Loos CM, Teeling P, Gown AM. Complete chromogen separation and analysis in double immunohistochemical stains using Photoshop-based image analysis. J Histochem Cytochem. 1999;47:119-25.
22. Matkowskyj K, Cox R, Jensen RT, Benya RV. Quantitative immunohistochemistry by measuring cumulative signal strength accurately measures receptor numbers. J Histochem Cytochem. 2003;51:205-14.
23. Kohlberger PD, Kieback DG, Breitenecker F, Loesch A, Gitsh G, Kainz C, et al. Epithelial and stromal estrogen and progesterone receptor expression in endometrial cancer: true color computer-assisted image analysis versus subjective scoring. Gynecol Oncol. 1997;64:404-10. 24. Ornberg RL, Woerner BM, Edwards DA. Analysis of stained objects in