AR
TICLE
1 Centro de Ciências Sociais Aplicadas, Universidade Federal de Pernambuco. Av. dos Economistas s/n, Cidade Universitária. 50740-580 Recife PE Brasil. [email protected]
The impact of the “Bolsa Família” Program on household diet
quality, Pernambuco State, Brazil
Abstract This article analyzes the impact of the Bolsa Família Program (BFP) on the quality of dietsamong households from Pernambuco State using data from the 2008-2009 Brazilian House-hold Budget Survey. The propensity score match-ing method, which corrects the sample selection bias, was used to make a comparison between beneficiary families and beneficiaries not in the program. The results show that beneficiary fam-ilies in the Program scored, on average, 9.05 more on the Diet Quality Index (DQI), compared with families not participating in the BFP. The results point to the effectiveness of the BFP in improving the quality of family diets, particularly in reduc-ing fat and sodium, and increasreduc-ing variety.
Key words Bolsa Familia Program, Nutrition,
Diet Quality Index (DQI), Pernambuco
Pedro Lima Coelho 1
C
oe
lho PL, Introduction
The literature highlights the importance of good nutrition for quality of life, with a particular em-phasis on the negative associations between nutri-tional deficiency and health status; and between nutritional deficiency and academic and profes-sional performance. These associations are even stronger when it comes to malnutrition during early years of life, which can have a negative im-pact on the future development of the individual. Children raised in food deficient households are more likely to have poor general health1-3,
stomachaches and frequent headaches4, more
chronic diseases2, increased probability of being
hospitalized1, psychosocial problems2,5,6,
prob-lems of depression and symptoms of suicide7,
behavior problems8 and poorer developmental
results9,10, altered mental proficiency11, and
high-er levels of iron deficiency12.
The FAO13 estimated there to be 852
mil-lion undernourished households in the world, although it is widely recognized that explaining this phenomenon is not just about food pro-duction capacity. Runge et al.14 and Sachs15 have
pointed out that improved technology in pro-duction means that current capacity should be sufficient to provide enough food for humanity.
In the literature on nutrition economics, con-cerns about diet quality involve both ends of the spectrum, from malnutrition16 to obesity17; it is
possible even to identify cases of association be-tween malnutrition and obesity18. At the lower
end, malnutrition can be a direct consequence of chronic hunger, as well as a poor diet resulting from a failure to intake certain nutrients. In both cases, however, the negative effects on produc-tivity and well-being come from a lack of power, proteins, and some micronutrients19-21.
Barros et al.22, Lima et al.23 and Onis et al.24
studied the extent and distribution of this multi-factorial problem in different populations, as well as its association with factors related to school-ing and age of the head of household, health care, healthy environment, living conditions and household income. But among the different fac-tors, low family income and poverty have been identified as its main determinants.
According to the annual report of the United Nations Environment Programme25, about 2.2
billion people currently live in or are close to liv-ing in poverty, representliv-ing more than a third of the world’s population. In extreme situations, the purchasing power of the poor is below a mini-mum subsistence level and can lead to starvation
and death. In less extreme situations, poverty can lead to an insufficient intake of food and nutrients. Also according to the PNUD report25,
among people affected by poverty, 842 million live with chronic hunger, representing 12% of the world’s population.
Malnutrition problems are strongly related to issues of poverty and are therefore particular-ly prevalent in developing countries, where they are a matter of public health. In this sense, there are several examples of countries that use condi-tional income transfer programs, in order to re-duce the problems associated with malnutrition. Mexico, Colombia, Ecuador, Chile, Portugal, and Brazil are all countries that use these programs with the aim of reducing social hardship, includ-ing malnutrition26.
In Brazil, this role falls to the Bolsa Família
Program (BFP), and this study aims to identify the program’s effect on the quality of household diet. The analysis will focus on the state of Per-nambuco and draw on data from the Household Budget Survey (HBS) for the years 2008-2009. In addition to socio-economic data about the fami-ly unit, the HBS has information from a 24-hour recall about the type and quantity of food con-sumed by household members.
Some national studies have evaluated the impact of BFP and other income transfer pro-grams on food expenditures. Resende and Ol-iveira26 estimated the impact of the Bolsa Escola
program (prior to the Bolsa Família program) on household expenditures using the 2002-2003 HBS data and observed rising food costs, among other important impacts. With regard to the BFP, a report by the Brazilian Ministry of Social De-velopment27 noted that food consumption by
ex-tremely poor families increased by approximately R$ 388 per year after receiving the benefit; and a second study by Duarte et al.28 of rural
northeast-ern families in 2005 concluded that expenditure on food by beneficiary families was on average R$ 246 more than by non-beneficiaries.
But increased spending on food may not necessarily reflect better nutrition. Assessing the impacts of the program on anthropometric in-dices (height for age, weight for height, weight for age, and body mass index for age) Andrade et al.29 found no statistically significant effects of
the program. However, despite the poor results, the authors warn that the changes in anthropo-metric indices would only be noticeable with a longer-term engagement by families in the BFP.
e C
ole
tiv
a,
22(2):393-402,
2017
nor in the short term by anthropometric indi-ces, this paper proposesthe Diet Quality Index (DQI) as a measure of nutritional quality. The DQI evaluates a combination of different foods, nutrients and dietary constituents in relation to dietary recommendations. It measures various dietary risk factors for chronic diseases in order to simultaneously evaluate and monitor diets at the individual and populational levels30. The DQI
is able to capture changes to eating habits in the short/medium term which may lead to changes in anthropometric indices in the long run.
The method of impact assessment proposed in this paper is propensity score matching, which is a valuable tool in public empirical evaluation policies26,28,31,32. By using the 2008-2009 HBS, this
study adds a new analytical approach to the un-derstanding of BFP impacts and to evaluating the DQI. There are analyses of the estimated impact of the BFP in various areas, but none related to DQI, nor using the HBS data. There were no studies of this nature and magnitude either in Brazil or in the literature.
The subsequent section details the DQI esti-mation method, propensity score matching, and finally describes the data and the selected vari-ables. The third section of this article presents and discusses the results obtained from the im-pact of the Bolsa Família Program on the quality of diet of the families studied, while the fourth section presents final considerations.
Methods
This paper was developed in two phases, both of which used data from the Household Budget Survey (2008/2009) for Pernambuco State. In the first phase, the DQI was estimated for each household in the sample. In the second, a differ-ence was established between BFP beneficiary familiesand non-beneficiaries. Propensity score matching was used for estimating this difference. The following sections describe the strategies used during both phases.
The Diet Quality Index
The Diet Quality Index (DQI) was developed by Patterson et al.33, with the objective of creating
a tool for measuring global diet quality to reflect a risk gradient for many chronic diseases related to food consumption. The tool identifies a high quality diet, reflected by a range of nutritional needs and reduced consumption of total and
sat-urated fat, as recommended by the Committee on Diet and Health34.
The DQI is obtained a points system for ten components, which characterize different aspects of a healthy diet. Each component is analyzed and scored from zero to ten, so that the DQI val-ue ranges from zero to one hundred points, with the maximum score representing complete con-formity with the Committee’s recommendations.
The first six components are represented by food groups, three components are represented by total fat, cholesterol and sodium nutrients and the last by diet variety. In this paper, “saturated fat” was substituted by the “legumes group”, in line with the process followed by Phillip et al.35.
This option was selected on account of the Bra-zilian dietary habit of bean consumption. If it had remained part of the group for meat and eggs, there was a risk of over-estimating con-sumption of the items in that group.
The criteria for the attribution of the max-imum, minimum and intermediary scores were based on the consumption of relative propor-tions from the Committee’s recommendapropor-tions.
The Propensity Score Matching Method
The propensity score matching (PSM) meth-od is used to estimate the impact of the Bolsa Família Program on the quality of families’ diets, and the variable that is of interest to this paper is the DQI. The PSM, created by Rosenbaum and Rubins36, is one of the most important methods
for pairing and is different from other multidi-mensional tools in that one control variable can be included, namely the propensity score itself.
The propensity score represents the probabil-ity that a given family receives the benefit of the Program conditioned on observable features. In this particular case, the probability of the family unit being a beneficiary of the Bolsa Família Pro-gram is conditional to its socioeconomic charac-teristics. It is this conditionality imposed on the analysis that guarantees the correction of any se-lection bias, explained by observable features that exist in the choice of the beneficiary families in the Program28. An analysis made without the use
of this method, or another one with similar pair-ings, even if controlled for socioeconomic vari-ables, would not be able to adequately separate the influence of these variables.
The use of the PSM requires an assumption of two hypotheses37: the first relates to the balance
C
oe
lho PL, a determinant of participation or non-participa-tion in the Program, but is only determined by it. The second implies an existence of common support, meaning that for each control group (non-beneficiary families) there is one corre-sponding treatment group (beneficiary families). For the propensity score, it is first necessary to estimate one regression logit, to obtain a prob-ability that the families participate in the BFP, with their own socioeconomics features. In this regression, the dependent or explanatory vari-able is a dummy varivari-able, which assumes a val-ue of one when the family is a beneficiary of the programand zero when this is not the case. The independent variables, in turn, are the socioeco-nomic factors that affect the inclusion of an in-dividual in the Program, such as income, age or children in the home. The Logit regression that is used for the calculation is DPBF = Sn.b
i.Xi, where
DPBF represents the variable dummy, Xi represents the family’s socioeconomic characteristics and bi represents the estimated coefficient of the model. After estimating the propensity score (PS), subgroups are obtained within the control group with similar probabilities to those individuals in the treatment group; and after carrying out the necessary tests, define a number of strata, being able to subsequently calculate the Average Effect with Stratified Pairing, which is one of the exist-ing methods in the literature37.
For stratification, a distribution of Program beneficiaries and non-beneficiaries is calculated across acertain number of strata of the estimated propensity score, so that the average PS estimates for the two groups present no statistically signifi-cant difference in each stratum. Since the DQI is the variable of interest, the firststep is to simply calculate the differences in DQI between the ben-eficiaries and non-benben-eficiaries within the strata. The final result is calculated to obtain an overall weighted average for the importance of each stra-tum in the total beneficiaries’ sample.
Samples and variables used in the model
The data used in this analysis relate to the state of Pernambuco and are from the 2008-2009 Household Budget Survey (HBS-IBGE)38.
518 households were interviewed in this survey, representing the state as a whole. To estimate the logit model in the first stage of the PSM, two types of variables were used as suggested in the literature. The first type is countable variables that characterize the family according to their annual family income (net receipt of BFP), the
number of residents in the family unit; and age and schooling in number of years of study of the head of the family. The second type involves dummy variables (binary variable of type yes = 1 / no = 0) established to characterize the family in general, including whether there are any chil-dren underthe age of 17; the head of household’s profile including gender (if male) and race (if white); and the residence itself, stating whether it is located in an urban area, if the street is paved, if it has a bathroom and/or piped water, and if is made out of brick.
Results and discussion
In the first section to follow, we provide a de-scriptive analysis of the families and their homes; the second shows the results for the estimated Diet Quality Index (DQI); the third section pres-ents the results for the logit model and the fourth contains the analysis of the impact of the Bolsa Família Program on the DQI of its beneficiaries.
Descriptive Analysis Sample
Table 1 provides information about the sam-ple that formed the basis for the study, for groups of beneficiaries and non-beneficiaries separate-ly so that it is possible to compare the two. The difference between the two is given in the final column of the table.
The first part of the table shows the results for the dummies, which may be summarized in terms of its frequency and proportion. In the sec-ond part the results of the accounting variables are presented, which are summarized in terms of the mean and standard deviation.
The table lists the number of households sur-veyed, as well as some of the characteristics of the head of household and the residence where they live. Comparing the beneficiary families with non-beneficiaries, families who are part of the BFP were found to have a higher frequency of children in the household, a greater frequency of men as head of the household and a lower fre-quency of white householders. In addition, their homes have a lower frequency of bathrooms, brickwork, plumbing and paved streets.
The table also provides the mean and stan-dard deviation of income, age, education, and number of people per family unit. The families who benefited from the BFP were found on aver-age to have lower income, younger aver-age of head of household and lower education than
e C
ole
tiv
a,
22(2):393-402,
2017
ficiaries. They were also found to have a greater number of people per household.
It should be clear that these characteristics do not relate to program impact; they only help to characterize better the family groups. In oth-er words, they give some idea about the policy focus, and whether it has reached the target au-dience of the most vulnerable families, which in this case, it appears to have done so.
The Diet Quality Index
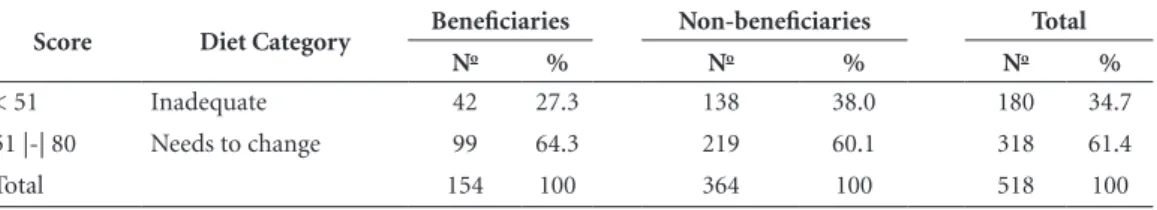
In order to calculate the DQI, data process-ing was carried out manually, based on informa-tion about food consumpinforma-tion in the 2008-2009 HBS-IBGE. The DQIis analyzed as a continuous variable in the logit model, but to characterize the results for food quality, the households were clas-sified according to the degree to which they had an adequate diet. Table 2 shows the classification of the 518 families from the study, whether they participated in the BFP or not, and the difference between the groups in the last column.
In the comparison between the two groups the program’s beneficiaries were found propor-tionately to have a more appropriate diet. It is, however, not yet possible to attribute this to the Program. As explained above, the impact of the Program can only becalculated when each family or group of familiesis compared withyour match (result of the pairing) of the untreated group. But one should also note that even the average
fam-ilies also demonstrate a high degree of dietary inadequacy.
Estimation and discussion of the logit model
Table 3 shows the results for the logit mod-el. The coefficients represent the weights of the characteristics of each household and head of household on the probability of a family unit being a beneficiary of the Bolsa Família Program (BFP).
The analysis makes it possible to evaluate the coefficients and, for the most part, the variables have the expected signs, and are consistent with the theory: when positive, they imply that the feature increases the probability of the recipient and when negative imply thatthe feature reduces the probability of belonging to the program.
The variable’s signals of age and age squared
suggest that the greater the ageof the head of household, the greater the chances of receiving the benefit; beyond a specific point, however, the trend is reversed, thus reducing the probabili-ty that the family is part of the social program. The presence of children in the residence and a greater number of residents also have positive impacts on the probability of participation in the program.
The variables relating to the characteristics of the residence were not significant, except for the plumbing, but Duarte et al.28 also found no
significance in these characteristics. However the Table 1. Frequency and proportion of households by characteristics of the head of household and residence – HBS 2008/2009, Pernambuco.
Variable Beneficiaries Non-beneficiaries
Dummy variable type Frequency Proportion Frequency Proportion
Family with child under 17 years
137 89.54 183 50.27
Gender – male 114 74.51 222 60.99
Race – white 44 28.76 115 31.59
Location – urban 39 25.49 173 47.53
Bathroom 143 93.46 349 95.88
Brickwork 148 96.73 359 98.63
Plumbing 117 76.47 323 88.74
Paving 65 42.45 226 62.09
Countable variable type Average Standard Deviation Average Standard Deviation
Income 777.59 683.07 2087.91 3696.07
Age 42.46 11.72 49.54 16.69
Schooling 4.19 3.61 6.85 4.83
C
oe
lho PL,
fact of being located in rural areas resulted in a greater likelihood of receiving the Bolsa Família.
From the estimated logit model, one obtains the probabilities of each family unitreceiving treatment (i.e. being a beneficiary of the BFP). Among the non-beneficiaries, results reveal a highly concentrated distribution close to zero, with relative asymmetry. Due to the asymmetry, if the comparison between the beneficiary and non-beneficiary units was carried out this time, one would have a bias in the analysis, because there would be nosufficient units to perform an efficient matching. Thus, from five layers of the sample, as shown in Table 3, one obtained sub-groups with scores similar for individuals in the treatment group to those in the treated group, ensuring a more appropriate comparison to in-vestigate the impact of the Program.
As might be expected there are among the beneficiaries a higher proportion of families with a higher probability (greater than 40%) of par-ticipating in the BFP. It should be noted that this probability was calculated as a function of family characteristics, which is different to just consid-ering the fact that it is the beneficiary; in this case the probability would be 100%.
The impact of the Bolsa Família on the Diet Quality Index (DQI)
After stratified pairing, the impact of the BFP on the Diet Quality Index (DQI) of the families is calculated, using the differences explained previ-ously. Table 4 shows this impact per stratum and the total effect.
On average, the BFP effect contributed with an increase of 9.05 to the QDI. If the comparison is made using only usual methods the effect that is attributed to the BFP is found to be 6.47. There is a bias inherent in comparing relatively differ-ent families, and this is eliminated when the HBS model is used. It is worth pointing out that on ac-count of the proposed method, it was possible to observe that the gain in the IQD grows with the probability of participation in the Program, un-til it reaches approximately 60%, at which point it begins to fall. This result shows that although there is a positive gain in the quality of the diet of families in all strata with the exception to the first one, this gain is largest for those families that present conditions of intermediate eligibility for the Program.
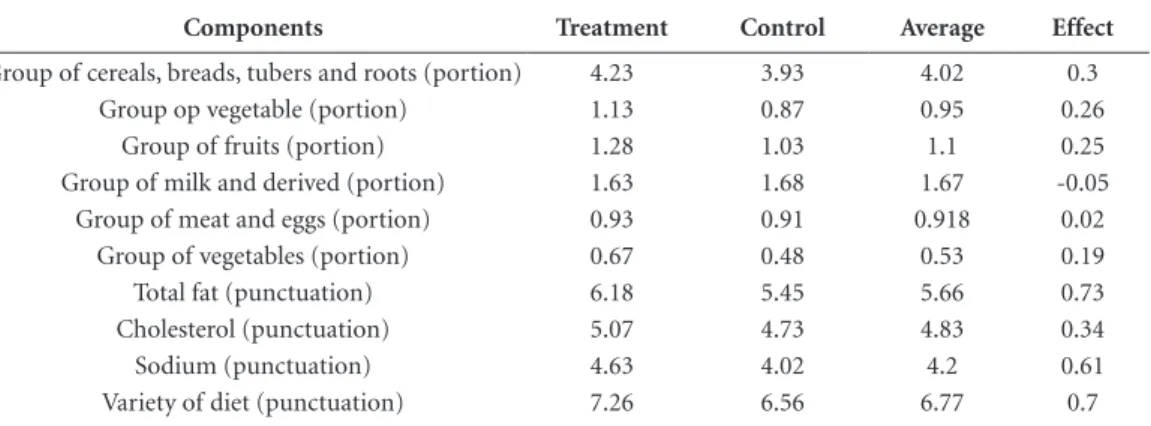
Evaluating the BFP impact on the components of QDI separately, positive differences on the quality of diet treatment (beneficiaries) and con-trol (non-beneficiaries) groups are observed. The results of this analysis are presented in Table 5.
For the foods group, a comparison was made with the quantity of portions; for total fat, choles-Table 2. Family Unit Classification according to degree of dietary adequacy according to Bowman et al.39 for the families of the 2008/2009 HBS in Pernambuco.
Score Diet Category Beneficiaries Non-beneficiaries Total
No % No % No %
< 51 Inadequate 42 27.3 138 38.0 180 34.7
51 |-| 80 Needs to change 99 64.3 219 60.1 318 61.4
Total 154 100 364 100 518 100
Table 3. Coefficients estimated by logit model.
Variable Coefficient Standard Deviation
Income -0.537* 0.096
Age 0.063** 0.033
Age2 -0.001* 0.000
No of residents 0.144* 0.049
Schooling -.0.072* 0.022
Child 0.839* 0.207
Gender 0.352** 0.168
Race 0.228 0.159
Urban -0.359** 0.161
Bathroom 0.337 0.339
Brickwork 0.547 0.248
Plumbing -0.354*** 0.209
Paving 0.011 0.157
Intercept -2.515*** 1.693
e C
ole
tiv
a,
22(2):393-402,
2017
terol, sodium and dietary variety, average scores were compared, remembering that the higher the score, the higher the quality of diet.
The analysis presented in Table 5 shows that, in general, the BFP family units consumed the groups of food in greater portions when com-pared to non-beneficiaries. Only the consump-tion of the milk group and derivatives did not prove to be consistent with other food groups. According to what is found in the Research iBase40, however, these results concluded that for
the beneficiary’s family, in the Northeast, there were an increase of reported consumption of all groups of food with a lower proportion of milk and its derivatives. Furthermore, by comparing the scores for total fat, cholesterol, sodium and dietary variety, one can verify that the beneficiary families have higher scores than non-beneficia-ries. One may thus conclude that the BFP has a positive impact on these indicators.
Final considerations
The Bolsa Família Program is a social policy that ties a basic guarantee of income to certain condi-tions. The Program is concerned with ensuring food safety and good health, in addition to pro-moting access to school for children and keeping them in school. In the short term, the Program aims to alleviate the problems arising from pov-erty, and in the long term, aims at investment in human capital and thus breaking the intergener-ational cycle of poverty.
One problem regarding this policy is to ensure that it is being successful in meeting its objectives. Thus, several analyses have been carried out in or-der to determine its effects on beneficiary families by observing the increase in food consumption, number of hours worked and attendance. Using data from the 2008-2009 HBS for the state of Per-nambuco, this research aimed to analyze qualita-tive food consumption, as itis used as a variable of the Diet Quality Index (DQI).
Table 4. Average results of the DQI of Control Groups and groups that receive treatment according to the stratum of propensity score.
Lower limit of strata of Propensity Score
Number of Families Average DQI Effect
Δ5
Beneficiaries Non-beneficiaries Beneficiaries Non-beneficiaries
0 14 96 55.64 58.95 -3.31
0.2 27 65 61.74 50.77 10.97
0.4 43 34 61.79 49.47 12.32
0.6 43 17 59.65 49.18 10.47
0.8 26 6 60.15 54.17 5.98
Total/Average 153 218 60.34 51.28 9.05
Table 5. Average result of each of the control group components and the group making the treatment.
Components Treatment Control Average Effect
Group of cereals, breads, tubers and roots (portion) 4.23 3.93 4.02 0.3
Group op vegetable (portion) 1.13 0.87 0.95 0.26
Group of fruits (portion) 1.28 1.03 1.1 0.25
Group of milk and derived (portion) 1.63 1.68 1.67 -0.05
Group of meat and eggs (portion) 0.93 0.91 0.918 0.02
Group of vegetables (portion) 0.67 0.48 0.53 0.19
Total fat (punctuation) 6.18 5.45 5.66 0.73
Cholesterol (punctuation) 5.07 4.73 4.83 0.34
Sodium (punctuation) 4.63 4.02 4.2 0.61
C
oe
lho PL, Since it is not possible to comparea family over two periods, we used the propensity score matching method, which allows for comparison between different groups at a given point intime. The ideal would be to compare the data of the beneficiary families with data from ahypothetical situation, involving non-beneficiaries. However, this comparison is not possible, so that the pairing between two groups, control and treatment, offer an alternative to reduce selection bias, as the group benefited from the BFP is not chosen randomly.
The result estimated from the pairing of sub-groups, and the average difference of DQI of the families and non-participants concluded that there is a positive difference between the average of the treatment and the control group. Further-more, it was found that the greater the probabil-ity of being a beneficiary of the BFP, the greater the portion allocated fromtransfers to the con-sumption of healthier foods. The results show that the DQI average value among beneficiary households is 9.05 higher than the average DQI value ofnon-participant families.
To disaggregate DQI components, one can analyze the consumption of each of these in the index. The average consumption of food por-tions of groups is generally higher among partici-pating families compared with non-participants;
with the exceptions of the groups for milk and dairy products. In addition, when comparing the scores of the components for total fat, cholester-ol, sodium and dietary variety, beneficiary fami-lies were also found to have higher scores than non-beneficiaries.
We conclude that there is a positive effect of income transfers on the quality ofdiet of house-holds from Pernambuco. This result shows that the BFP increases investment in human capital by improving the nutrition of individuals and, consequently, in breaking the intergenerational cycle of poverty in the long run.
In calculating the DQI of families from Per-nambuco based on data about dietary intake from the 2008-2009 HBS, and using the propen-sity score method to reduce BFP selection bias, this research has not only contributed to the pos-itive results arising from program analysis, but also by means of the methodology used to find them. Thus, when using this strategy, this study has proposed a new approach to the diagnosis of public policies related to nutrition.
e C
ole
tiv
a,
22(2):393-402,
2017
Collaborations
PL Coelho was responsible for working with the data and execution of the models used to cal-culate the Diet Quality Index (IQD) for the es-timation of the Propensity Score Matching and the impact of the Bolsa Família Program on IQD. ASSA Melo was responsible for designing the re-search, monitoring and reviewing the estimates made, and preparing the final report.
References
1. Cook JT, Frank DA, Berkowitz C, Black MM, Casey PH, Cutts DB, Meyers AF, Zaldivar N, Skalicky A, Leven-son S, Heeren T, Nord M. Food Insecurity Is Associated with Adverse Health Outcomes Among Human Infants and Toddlers. J Nutr 2004; 134(6):1432-1438. 2. Weinreb L, Wehler C, Perloff J, Scott R, Hosmer D,
Sa-gor L, Gundersen C. Hunger: its impact on children’s health and mental health. Pediatrics 2002; 110(4):e41. 3. Dunifon R, Kowaleski-Jones L. The influences of
par-ticipation in the National School Lunch Program and food insecurity on child well-being. Social Service Re-view 2003; 77:72-92.
4. Alaimo K, Olson CM, Frongillo EA Jr, Briefel RR. Food insufficiency, family income, and health in US pre-school and pre-school-aged children. Am J Public Health 2001; 91(5):781-786.
5. Kleinman RE, Murphy JM, Little M, Pagano M, We-hler CA, Regal K, Jellinek MS. Hunger in children in the United States: potential behavioral and emotional correlates. Pediatrics 1998; 101(1):e3.
6. Murphy JM, Wehler CA, Pagano ME, Little M, Klein-man RE, Jellinek MS. Relationship between hunger and psychosocial functioning in low-income Ameri-can children. J Am Acad Child Adolesc Psychiatry 1998; 37(2):163-170.
7. Alaimo K, Olson CM, Frongillo EA. Family Food In-sufficiency, but Not Low Family Income, Is Positively Associated with Dysthymia and Suicide Symptoms in Adolescents. J Nutr 2002; 132(4):719-725.
8. Slack K, Yoo J. Food hardship and child behavior prob-lems among lowincome children. Social Service Review 2005; 79(3):511-536.
9. Whitaker R, Phillips S, Orzol S. Food insecurity and the risks of depression and anxiety in mothers and behav-ior problems in their preschool-aged children. Pediat-rics 2006; 118(3):e859-e868
10. Jyoti DF, Frongillo EA, Jones SJ. Food insecurity affects school children’s academic performance, weight gain, and social skills. J Nutr 2005; 135(12):2831-2839. 11. Rose-Jacobs R, Black MM, Casey PH, Cook JT, Cutts
DB, Chilton M, Heeren T, Levenson SM, Meyers AF, Frank DA. Household food insecurity: Associations with at-risk infant and toddler development. Pediatrics 2008; 121(1):65-72.
12. Skalicky A, Meyers AF, Adams WG, Yang Z, Cook JT, Frank DA. Child food insecurity and iron deficiency anemia in low-income infants and toddlers in the Unit-ed States. Matern Child Health J 2006; 10(2):177-185. 13. Food and Agriculture Organization (FAO). The State of
Food Insecurity in the World. Rome: FAO; 2012. 14. Runge CF, Senauer B, Pardey PG, Rosegrant MW.
End-ing Hunger in our Lifetime: Food Security and Globaliza-tion. Baltimore: Johns Hopkins University Press; 2003. 15. Sachs JD. The End of Poverty: Economic Possibilities for
Our Time. New York: The Penguin Press; 2005. 16. Ramos MKP. Descrição da agenda para intensificação da
atenção nutricional à desnutrição infantil e suas metas nos municípios brasileiros [dissertação]. Brasília: Uni-versidade de Brasília; 2014.
C
oe
lho PL, 18. Vagner Ferreira do Nascimento, Patrícia Bachiega, Alis-séia Guimarães Lemes, Fernanda Muálem de Moraes
Mendes. Estado nutricional de profissionais em am-biente pré-escolar. Gestão e Saúde 2015; 6(1):323-335. 19. Dasgupta P, Ray D. Inequality as a determinant of
mal-nutrition and unemployment: theory. Economic Jour-nal 1986; 96:1011-1034.
20. Strauss J, Thomas D. Health, nutrition and econom-ic development. Journal of Economic Literature 1998; 36:766-817.
21. Wheeler D. Basic needs fulfillment and economic growth. Journal of Development Economics 1980; 7:435-451.
22. Barros FC, Victora CG, Scherpbier R, Gwatkin D. Ini-quidades sociais na saúde e nutrição de crianças em países de renda baixa e média. Rev Saude Publica 2010; 44(1):1-16
23. Lima ALL, Silva ACF, Konno SC, Conde WL, Benício MHA, Monteiro CA. Causas do declínio acelerado da desnutrição infantil no Nordeste do Brasil (1986-1996-2006). Rev Saude Publica 2010; 44(1):17-27.
24. Onis M, Blössner M, Borghi E, Frongillo EA, Morris R. Estimates of global of childhood underweight in 1990 and 2015. JAMA 2009; 291(21):2600-2606.
25. Brasil. Atlas do Desenvolvimento Humano no Brasil. Brasília: PNUD; 2014.
26. Resende ACC, Oliveira AMHC. Avaliando resultados de um programa de transferência de renda: o impacto do Bolsa-Escola sobre os gastos das famílias brasileiras. Estudos Econômicos 2008; 38(2):235-265.
27. Brasil. Ministério do Desenvolvimento Social e Com-bate à Fome (MDS). Sumário Executivo: Avaliação de Impacto do Programa Bolsa Família. Brasília: MDS; 2007.
28. Duarte GB, Sampaio B, Sampaio Y. Programa Bolsa Família: impacto das transferências sobre os gastos com alimentos em famílias rurais. Rev. Econ. Sociol. Rural 2009; 47(4):903-918.
29. Andrade MV, Chein F, Ribas RP. Políticas de transfe-rência de renda e condição nutricional de crianças: uma avaliação do Bolsa Família. Belo Horizonte: Cedeplar, Universidade Federal de Minas Gerais; 2007.
30. Previdelli AN, Andrade SC, Pires MM, Ferreira SRG, Fisberg RM, Marchioni DC. Índice de Qualidade da Dieta Revisado para população brasileira. Rev Saude Publica 2011; 45(4):794-798.
31. Menezes-Filho N, organizador. Avaliação econômica de projetos sociais. São Paulo: Fundação Itaú; 2012.
32. Diamond A, Jasjeet S. Genetic matching for estimating causal effects: A general multivariate matching method for achieving balance in observational studies. Review of Economics and Statistics 2013; 95(3):932-945. 33. Pattersson RE, Haines OS, Popkin BM. Diet quality
in-dex: capturing a multidimensional behavior. J Am Diet Assoc 1994; 94(1):57-64.
34. National Research Council (NRC). Committee on Diet and Health, Food and Nutrition Board, Commission on Life Sciences. Diet and Health: Implications for Re-ducing Chronic Disease Risk. Washington: National Academy Press; 1989.
35. Philippi ST, Latterza AR, Cruz ATR, Ribeiro LC. Pirâ-mide alimentar adaptada: guia para escolha dos ali-mentos. Rev Nutr 1999; 12(1):65-80.
36. Rosembaum R, Rubin DB. The central role of propen-sity score in observational studies for causal effects. Biometrika 1983; 70(1):41-55.
37. Heckman J, Ichimura H, Todd P. Matching as an econo-metric evaluation estimator: evidence from evaluating a job training program. Review of Economic Studies 1997; 64(4):605-654.
38. Instituto Brasileiro de Geografia e Estatística (IBGE). POF 2008 2009 - Antropometria e estado nutricional de crianças, adolescentes e adultos no Brasil. Rio de Janeiro: IBGE; 2010.
39. Bowman SA, Lino M, Gerrior SA, Basiotis PP. The Healthy Eating Index: 1994-96. Washington: U.S. De-partment of Agriculture, Center for Nutrition Policy and Promotion; 1998.
40. Instituto Brasileiro de Análises Sociais e Econômicas (IBASE). Repercussõesdo Programa Bolsa Família na segurança alimentar e nutricional: relatório síntese. Rio de Janeiro: IBASE;2008.
Article submitted 31/07/2015 Approved 16/12/2015