© FECAP
RBGN
Received on February 14, 2014 Approved on February 27, 2015
1. Luís António Gomes Almeida
Master in Economics
University of Aveiro (Portugal) [[email protected]]
2.Elisabeth Teixeira Pereira
PhD in Industrial Management University of Aveiro (Portugal) [[email protected]]
3.Fernando Oliveira
Tavares
PhD in Industrial Management University of Aveiro (Portugal) [[email protected]]
Revista Brasileira de Gestão e Negócios
DOI:10.7819/rbgn.v17i54. 1943
Determinants of Dividend Policy:
evidence from Portugal
Luís António Gomes Almeida and Elisabeth Teixeira Pereira
DEGEI, University of Aveiro, Portugal
Fernando Oliveira Tavares
Assistant Professor at University Portucalense Infante D. Henrique, Porto, Portugal
Responsible editor: André Taue Saito, Dr. Evaluation process: Double Blind Review
ABsTRAcT
Objective – he objective of this article is to identify the determinants of non-inancial companies’ dividend policy of the Portuguese capital market and contribute to resolve the divergence of determinants of the dividend policy existent in previous studies.
Design/methodology/approach – To solve the problematic under study were tested several inancial determinants, through the application of the method of multiple linear regressions to the non-inancial listed companies on the Euronext Lisbon, between 1997 and 2011.
Findings – he results suggest as main indicators for the Portuguese dividend policy the stability, the value of the market, the previous pay-out and the business dimension; which inluence positively the amount of dividends distribute through the company. herefore, the opportunities of growing and investment inluence negatively the distribution of dividends.
Practical implications – Identify the principal determinants of the dividend policy of the non-inancial companies listed on the Portuguese capital markets - Euronext Lisbon and allow sustaining and improving the corporations and investors’ decisions.
Originality/value – his study opens up an opportunity to contribute to the understanding of the determinants of dividend policy of the listed corporations in the Lisbon Stock Exchange, aiming permeates greater scientiic knowledge in the context of understanding the determinants of dividend puzzle policy and the existing divergences of several previous empirical studies.
Keywords – Dividend Policy, Euronext Lisbon, Cash Flow, Random Walk, Capital Markets.
1 INTRODUcTION
Profit is the main economic purpose for companies, being that there can be two destinations attributed to it: the proit can be held in the company and used in its activities, or it can be distributed to shareholders. As for its distribution, it can be done in two ways: in the form of dividends or through the repurchasing of circulating shares.
The present article discusses profit distribution options in the form of dividends, while empirically testing the determinants of dividend policies in non-inancial companies listed in the Lisbon Stock Exchange (BVL), between 1997 and 2011.
Gordon (1959) deined the dividends as the form of fragmented payment that investors expect to receive, and determined proit to be the most likely cause for the distribution of dividends.
he dividend policy is considered as part of the set of relevant inancial decisions in corporate life because it triggers changes in corporate economic and financial indicators, having a direct impact on funding policy and investment. By the company distributing dividends, it causes a decrease in the liquidity of their assets, which is relected in a decrease of cash low1 surpluses, directly inluencing the form of compensation of investors in the form of dividends or capital gains.
In formulating its dividend policy, the company needs to assess an optimal level of payment to maximize the return of shareholders. The comparison of these objectives causes a trade-of2 between the payable amount value
and the value to retain. he retention translates into the adequacy of the company’s inancial structure, while the distribution is relected in the proitability of shareholders. his uncertainty makes dividends one of the most controversial topics in the corporate inance world, leading to the existence of a diverse and divergent literature on this topic, and proving that the determinants of dividend policy are one of the areas of inance with several unanswered questions. hese reasons led Black (1976) to classify this issue as “dividend
puzzle”, because as one tries to solve it, the more
it proves to be like an unsolved puzzle, idea that Black (1976, p.5) explains in his statement “he more we look at dividends, the more it looks like a
puzzle, where the pieces just do not it.” Despite
the numerous theoretical and empirical studies in this area, there is no unanimous position on the choice of the determinants of dividend policy, continuing to open new investigations.
Under this motivation, the present work deals with the determinants of dividend policy in listed corporations in the Lisbon Stock Exchange, because the current Portuguese capital market has not yet reached the same level of development of other dimensions of markets, such as the European market, the US market or the Brazilian market.
Therefore, this study opens up an opportunity to contribute to the understanding of this problem, aiming to permeate greater scientiic knowledge in the context of understanding the determinants of dividend policy.
This work is organized as it follows: Section 2, which follows this introduction, being addressed the most relevant theories to explain the determinants of dividend policy; Section 3, devoted to the formulation of hypotheses, sample description, data selection and explanation of the methodology used to obtain empirical results; Section 4, which proceeds to the veriication and validation of the assumptions of the methodology used, a presentation and discussion is done through results obtained by a Multiple Linear Regression Model (MLRM); and Section 5, where the general conclusions of this study are presented.
2 LITERATURE REVIEW
dividends, and it persists decisively inluencing all the research and recent explanatory theories of dividend policy, which will be enunciated.
2.1 Relevance heory of Dividends
he theory of Relevance of Dividend, defended by Lintner (1956) and Gordon (1956), supports the existence of a relationship between the amount of dividends paid and the value of company shares, which are a result of two major factors, net income generated and Dividend payout. his last factor is a dividend distribution indicator for the previous iscal year.
Lintner (1956) conducted pioneering work in this ield through a series of twenty-eight interviews with managers of American companies on the decision of dividend distribution, which found that decisions on the dividend policy were based mainly on payouts. he author also concluded that, in a scarce environment, the preferred companies use borrowed funds rather than decreasing the distribution of dividends by checking certain stability in the dividend policy over the various economic exercises.
Considered as a seminal theory of this theme, the foundation ideas are empirically tested in past decades, as in the studies of Grullon et al.
(2005), Benzinho (2007), Júnior et al. (2010), Ribeiro (2010), and Mubin et al. (2014).
2.2 Bird in the Hand heory
In the 1950s, Gordon and Shapiro (1956) presented a model of stock evaluation which assumes that the dividend grows at a constant rate, under the premise of a direct relationship between the dividend policy and the market value of the company. his model suggests that a stock is worth on the basis of future expectations, and the dividends inluence the market value of the company.
hese authors share the view that investors are rational and generally risk averse, demanding a higher return before greater uncertainty and risk. his risk premium increases the cost of
invested capital and reduces the share price. he distribution of dividends reduces the uncertainty and the required return, being preferable the dividends to the retention of the results; this was a universal accepted idea in the 1960s decade, but has been fading over the years.
Dividends are considered “cash in hand”, while capital gains are merely potential. his relationship became known in the world of business inance as “bird in the hand theory”, that is, as a bird in a hand.
2.3 Irrelevance heory of Dividends
In an opposite line to the relevance of dividends, Modigliani and Miller (1961) found evidence that the dividends paid did not affect the company’s value or profitability of investors, that is, irrelevant to the value of the company. However, this irrelevance of dividends depends on certain assumptions, such as: facing rational expectations, tax and no transaction costs, information asymmetry and other market imperfections being the capital market perfect and eicient.
In a perfect market, the company’s value is determined by the investment policy and the return that its assets ofer, in other words, by its ability to generate proit.
Modigliani and Miller (1961) argued that the debt recourse is a cheaper source of inancing, and preferable to the use of equity for retained earnings and the issuance of capital. Under this perspective, the distribution of dividends will change the need for the use of external funds.
Although the conclusions reached by Modigliani and Miller (1961) are accepted, there are numerous opinions contrary to the hypothesis of perfect and eicient markets, including the premises of the authors, particularly concerning costs and taxes, personiied as an example in cost agency (Jensen & Meckling, 1976).
is the possibility of obtaining abnormal proits; three types of eiciency are distinguished: weak, semi-strong and strong. Due to the criticism sufered, Fama (1991) made more lexible HME, postulating that this hypothesis implies that bond prices reveal fully all available information.
However, the HME continued to be criticized by several authors as Shiller (1981), Le Roy and Porter (1981), Summers and Shleifer (1990), Genotte and Lelland (1990), Haugen (1999), and, more recently, it is stated the empirical study about Brazilian shares of Cordeiro and Machado (2013).
2.4 Residual heory of Dividends
he residual theory is based on the guiding principle that the distribution of dividends will proceed only after an optimal investment decision by the company. his distribution, in turn, will decrease the availability for investments to be inanced by issuing new shares or debt capital. However, this capital has an associated cost that exceeds the cost of own equity. Dividends are seen as waste and the dividend policy as residual.
he return is inluenced by the investment policy and not by the dividend policy. On the other hand, investors are indifferent to the consideration form of its return, given that it is at least equal to that required by the market (Salsa, 2010).
2.5 signaling heory
This theory is based on information asymmetry, which is characterized by one of the parties privileged access to information, that is, managers are holders of more information in the future of the company than the market. his diference in information detention characterizes the asymmetry and managers use it as an “added value” to signal the market about their future expectations through the dividend policy (Miller & Rock, 1985).
he inancial markets assess the actions of managers and their implications on the results and
in the future value of the company (Damodaran, 2001), being the dividends considered “vehicles” of information, easily accessible and inexpensive.
Lintner (1956) and Modigliani and Miller (1961) obtained empirical evidence consistent with this theory, inding that most of the companies maintained the dividend payout. Ali (2010) concluded to the Bangladesh case that the chosen period of time for the dividend distribution announcement signals the investors.
Lintner (1956) and Lie (2005) document a resistance from administrators in increasing dividends when there are good chances of reconsidering this decision. These authors consider that, at equilibrium, companies have a dividend policy consistent with their prospects for future growth. The study of Brugni et al. (2012) supports this conclusion, finding evidence that the results of the companies analyzed together with the dividends had better information in predicting prices than when analyzed individually, thus reinforcing the idea that dividends are carriers of an information signal. However, authors such as Grullon et al. (2002) have a diferent view of signaling theory, through the “maturity hypothesis”, which argues that dividends do not signal good news, because a company should only pay dividends when their investment opportunities have been exhausted, linking dividends to risk and decrease proits.
his theory is still setting for empirical studies, as Corso et al. (2010), Pietro et al. (2011), and Moreiras et al. (2012).
2.6 Pecking Order heory
his theory, also known as theory of order or hierarchy, was reformulated by Myers and Majluf (1984). he authors argue that companies prioritize their sources of funding, based on the premise that the cost of inancing increases with asymmetric information, discussing that it is cheaper to use than the debt issue of new bonds.
order by managers (Myers, 1984; Fama & French, 2002).
Myers (1984) recognizes that this model does not explain the distribution of dividends, but must be considered to afect the dividend decisions, and the payout ratio is negatively related to the investment and inancial leverage. Managers retain proits to inance the investments passing over the distribution of dividends to shareholders, not having to submit to supervision and external market assessment, and establish smaller dividend payouts.
2.7 Agency heory
Theor y developed by Jensen and Meckling (1976), which considers the company as a set of contracts, where the shareholders are entitled to company assets and cash low. Shareholders and managers try to act in defense of their own interests, where each tries to maximize its usefulness. his maximization is achieved under diferent views and perspectives that create differences and conflicts between the two parties. These conflicts tend to be eliminated, and this elimination operation generates costs, which are called agency costs. Jensen and Meckling (1976) argue the increasing dependence of the wages of managers in function of the results. These authors have suggested that the level of debt and the distribution of dividends are control instruments for managers. On the other hand, it is discussed the increasing dependence of winning results; the authors contend further that the level of debt and payment of dividends are instruments of control of managers because the decrease of available cash low increases the pressure of shareholders on the company/managers from the market, and this pressure leads to control agency costs. The authors also argue that the growth of opportunities provides an increase in debt, forcing executives to be more eicient.
In this way, the payment of dividends has a positive efect on the market value of the companies; before the distribution of dividends,
the available capital decreases, reducing the scope of managers to handle the company’s resources (Silva, Santos & Almeida, 2011).
DeAngelo et al. (2004) concluded that companies pay dividends to reduce agency costs associated with an indicator of low debt and high cash lows. A view with unanimous acceptance is that the lexibility of management is the missing piece in solving the puzzle.
he rules followed by managers in order to mitigate agency conlicts have been investigated in the form of “corporate governance”, which considers the concentration of ownership, the constitution of the board and the debt as control instruments of conlict between managers and shareholders (Reyna, 2012).
Almeida et al, (2010) and Lameira (2012) conclude that the adoption of good corporate governance practices makes room for a more transparent management, reducing information asymmetry and agency conlict.
2.8 client Efect
During the 1970s, researchers and theorists have added a new variable in the discussion of the determinants of dividend policy, the efect of taxes, concluding that dividends create a tax disadvantage for investors because they are taxed at a higher rate than capital gains, reducing the net rate of return.
DeAngelo et al. (2009) argue, contrarily to the information provided, that there are investors with a preference for stocks that pay dividends; investors have diferent attitudes for the same alternatives, and this preference is considered clientele efect. his efect was originally suggested by Modigliani and Miller (1961), who proposed that companies, through their dividend policy, draw themselves their own “clientele”; each investor chooses the company that will invest in according to their needs and views.
evidence that the distribution of dividends does not tax or penalize investors; they keep the portfolio shares with a distribution of dividends related to its tax brackets.
Other factors, such as risk, liquidity and tax situation of each shareholder, are on investors’ choice of support. In the same context, the work of Holanda and Coelho (2012) indicates that the clientele efect inluences the dividend policy of Brazilian companies.
2.9 catering heory
Developed by Baker and Wurgler (2004), this is a theory in the ield of behavioral inance that advocates that decisions on dividends are inluenced by investor demand, and this may be inluenced by feelings. Managers practice a high dividend policy, when investors are willing to pay a higher value for the shares that distribute dividends.
Whether for psychological reasons or for professional reasons, the type of dividends demanded by investors varies over time, between income shares or growth stocks. Another idea put forward by the authors on the basis of this theory are the arbitrage strategies in that building a stock portfolio can diversify and eliminate the speciic risk; however, systemic risk is assumed.
3 H Y P O T H E s E s , D A T A A N D METHODOLOGY
Initially, it was proceeded to the framework of research discussions to be developed and the enunciation of diferent hypotheses to be tested in a second phase. After the formulation of hypotheses, took place the presentation and description of the sample, referencing information sources used, the data treatment process and the operational deinition of variables, dependent and independent, included in the study. he choice of these was done within the scope of most relevant inancial variables used in empirical studies with
similar goals to ours, highlighting the proitability, capital structure, the size, risk and results. In the third phase, the research methodology used is described, that is, the econometric model used to estimate the empirical results.
3.1 Hypotheses
he research hypotheses are part of the theoretical logic of the research problem, based on the reviewed literature, and the logic to test the determinants of dividend policy. he explanatory variables of dividend policy are grouped into groups such as proitability, size, market value, risk, inancial structure, liquidity and stability in the payment of dividends, among others, taken as explanatory attributes of the dividend policy and various inancial theories.
In the following sections, the research hypotheses based on the literature review resulting from the articulation of used methods in model building concerning variables to be tested are presented.
3.2 Basic Literature and Formulation of Hypotheses
Proitability is one of the recurring tax groups in explaining dividend policy, considered by many empirical studies and inancial theories; this inancial tax proitability shows that the same company mirrors the available capital and the distribution of these funds in the dividends.
Authors such as DeAngelo et al. (2004), Fama and French (2001), Lie (2005), Ribeiro (2010) and Yegon et al. (2014) concluded that companies with higher proitability levels have a higher tendency for the payment of dividends. his conclusion leads to expecting a positive relationship between proitability and dividends.
Hypothesis 1: he proitability of the company is positively related to the dividends distributed by Portuguese companies, ceteris paribus.
Hypothesis 2: he inancial results of the company are positively related to the dividends distributed by Portuguese companies, ceteris paribus.
he risk measure for the stability of the results is also taken into account and studied in several empirical studies, and it has a negative relationship with dividends. Lintner (1956) and Grullon et al. (2002) conclude that companies with lower risks are more likely to pay higher dividends.
Lie (2005) shares the same conclusion, but instead of using the net income, uses the operating results and inds evidence that a lower volatility in operating results leads to increased dividends. It is concluded that after the increase of dividends to earnings, volatility decreases. Authors such as Ribeiro (2010) and Moreiras et al. (2012) also tested the relationship between income and the distribution of dividends. his possible expected negative relationship between the variability of results and dividends led to the formulation and testing for the following hypothesis:
Hypothesis 3: The variability of the proitability of the company is negatively related to the distribution of dividends, ceteris paribus.
Lintner (1956) argues that there is a certain stability in the distribution of dividends, opinion also advocated by Ferreira et al. (2010), who found a positive relationship between current dividends and those paid in the previous year.
Grullon et al. (2005) conclude that dividends are afected by past and present results, and future results show no evidence on dividends.
Ribeiro (2010) suggests that the net income and dividends for the previous iscal year
have a positive and statistically signiicant efect for companies in the PSI 20. Recently, Mubin et al. (2014) tested the stability as a determinant of dividend payments.
Based on the above, as to the results and dividends from the previous year, it is expected a positive relationship for the two variables in order to test these taxes; the following hypothesis is formulated:
Hypothesis 4: he dividends paid in the previous iscal year are positively related to dividend distribution in the following year, ceteris paribus.
Authors such as Lintner (1956) and Ribeiro (2010) conclude that the increase in the dividend amounted leads to an increased market value of the company.
A positive relationship between the dividends paid and the market value of the company is expected, measured by the price of its shares and its market capitalization. hus, under these fundamentals, the stock price and market capitalization of each company were used as explanatory variables of the dividend per share.
Hypothesis 5: The level of dividends distributed is positively related to the market value, ceteris paribus.
Size is another factor of much relief in similar studies. Recent studies like Gizelle
et al. (2013) and Mubin et al. (2014) support the
conclusion of Salsa (2010) that the dimension shows statistically signiicant evidence in the dividend distribution of the explanation. Based on this relationship between the size and the distribution of dividends, it was tested the following hypothesis:
Hypothesis 6: Dividends distributed are positively related to company size, ceteris paribus.
/ investment companies. DeAngelo et al. (2004) veriied a negative relationship between growth opportunities and investment and the amount distributed in dividends; companies tend to only distribute dividends when they have high levels of liquidity: low debt and lack of project investment is what distributes dividends (Lie, 2005). Operational performance indicators are seen as opportunities for growth and investment indicators.
Financial autonomy is an indication, among others, of the inancial stability analysis of companies, used to estimate the impact of debt and risk in the dividend policy. Another indicator often used in similar studies is the solvency, in order to assess the level of solvency of the company. Islam Aamir et al. (2012) found a negative relationship between debt and dividends, conclusion conirmed by DeAngelo et al. (2004).
However, according to Ribeiro (2010), the results are not consensual among the various empirical studies. hus, inancial autonomy, the debt structure indicator to test the debt related to dividends, will be used. Additionally, two more hypotheses were formulated:
Hypothesis 7: Dividends distributed are negatively related with the debt level of the company, ceteris paribus.
Hypothesis 8: Dividends distributed are negatively related with investment opportunities/ company growth, ceteris paribus.
3.3 Operational Definition of Empirical Variables
For the assumptions to be seen as scientiic hypotheses, it is necessary that they are susceptible to empirical refutation. herefore, in search for answers to the research hypotheses, the value of the dividend paid per share (DIVAC) was considered as a dependent variable. This represents the amount, in Euros, that the company distributes to shareholders as dividends for each one of the
economic exercises which the present study is focused on. he choice of this indicator is related to its use in many empirical studies with similar objectives for this study, including Lintner (1956), Watts (1973), Arrazola et al. (1992), Bagüés and Fumás (1995), Escuer and Cabestre (1995), Naceur et al. (2006), Benzinho (2007), Ribeiro (2010) and Yegon et al. (2014).
A set of independent variables was used for the explanation of the dividend value distributed per share, and therefore of the determinants of Portuguese companies and dividend policies. Relative to independent variables, there are several economic and inancial indicators associated with the study hypotheses; 13 variables were shown to be statistically signiicant after the application of stepwise method, which is explained below:
Payout Ratio (PAYOUT) - his indicator shows the share of net proits that were distributed in the form of dividends in a given iscal year. his variable was included in our study in order to assess the stability policy in the payment of divi-dends, which led us to include the variable in our model (PAYOUTANT), e.g. the payout indicator of the previous year.
Operational Proitability of Asset (RENDOPAT) - Active Operating proitability (RENDOPAT) - he proitability of the company’s assets or re-turn on assets indicator shows the ability of the company’s assets to generate results; this variable is included in the study in order to test the sig-niicance of proitability in the dividend policy. he choice of these variables lies in studies such as Grullon et al. (2002) and Ribeiro (2010).
shares. hese attributes are often used in studies with goals similar to ours, such as Salsa (2010) and Ribeiro (2010).
Market value – he market value is an attribute tested in several empirical studies (Ribeiro, 2010), it is estimated by the value of the share price. In this study, the calculation of share price for the last day of each year was used, creating the variable quotation (COT). Another variable used was the value of stock market capitalization (CAPBOLS) of each company regarding the end of each year. he DIVYELDANT variable can also be related to the market value factor for demonstrating the dividend proitability index to the value of the share price of the previous year.
Dividend Yield (DIVYELD) - his indicator shows the percentage of return on shareholder dependent on the dividend. Studies of Campbell and Shiller (1998), with US data, show that there is a positive relationship between the dividend yield and the market value of the company. In our study, DIVYELDANT was introduced as a variable in order to test the stability of the divi-dend policy.
Net proit per share Earnings (RESLIQAC) – he net income is used in empirical studies with similar goals until present, highlighting the results obtained by Lintner (1956) and Ribeiro (2010). It was used the net proit obtained by the com-pany and evidenced at the end of each iscal year, divided by the number of shares.
Operating Income (RESOP) – he operating income is used with the same purpose than the net result, this is the value obtained by the com-pany and evidenced at the end of each iscal year. However, this is an indicator of operating perfor-mance of the company, which for many is seen as an indicator for evaluating growth opportunities.
Dividend of the previous year (DIVEXANT) - In the present empirical study, this variable was introduced in order to check the stability in the
distribution of dividends, which is apparent in the dividends per share that the company distributes to its shareholders over the previous iscal year.
Financial autonomy (AUTFIN) - he inancial autonomy, being an indicator that is part of an analysis of the inancial balance in the medium and long term and that allows to assess the level of debt and risk associated with the company; it also allows analyzing the inancial structure of a company. It appears as another indicator proposed in literature reviewed explaining the company’s dividend policy. his indicator determines the percentage of assets that are inanced by equity, relecting the company’s dependence on third par-ty capital. In general terms, the higher the value, the better and greater is the inancial stability of the company.
3.4 sample
he present work focuses on the Portuguese stock market, and the sample companies meet the following selection criteria:
i. Companies that remained constantly listed in the stock exchange during the time period from 1997 to 2011 (15 years) were included in the inal sample;
iii. Companies of inancial and supporting nature were not included in the final sample due to the speciicity that these sectors have, as well as for its account structures. This criterion had been followed by others, as Papadopoulos and Charalambidis (2007) and Ribeiro (2010).
he inal sample was reduced thus to 12 companies that fully comply with the selection criteria set out above.
3.5 Data sources
he present empirical study used various data sources to obtain the necessary data, which are the Euronext Lisbon and the Portuguese Securities Market Commission (CMVM).
In the Porto delegation of the CMVM, annual inancial accounting reports on corporate governance of sample companies were consulted in paper format, compiling this data to be used in determining the empirical variables.
hrough Euronext Lisbon, the following data was collected: quotation of the companies related to the closing price of the year that every share had and the amount of dividends distributed to shareholders.
3.6 Data processing
The sample was selected through the Euronext Lisbon website, from where a list of companies quoted on December 31, 2011 was pulled out, making a match with the list of companies on December 31, 1997, obtained from the BVL.
However, the Portuguese economic and inancial context admitted during the period under analysis admitted two changes that had to be taken into account in the analysis of accounting and inancial reports of the companies concerned. The first was the conversion of the national currency from the previous Portuguese currency, Escudo, to the ongoing European Union currency, the Euro. Reports and company accounts from 1997 to 2000 includes values presented in
Escudos, in order to have uniform values and all in the same coherence unit. herefore, it was proceeded the Escudo-Euro exchange, making up the correspondence of 1 Euro amount to 200.482 Escudos3. he second was the change in
the accounting system Oicial Plan of Accounts (POC) for the Accounting Standardization (CNS).
Once these features were applied, the calculation of a set of economic and inancial indicators took place. The data necessary to calculate the dependent variable and attributes to be tested were irst imported into spreadsheets, where some of the changes were made. Despite the base year of the study being 1997, data from 1996 was consulted to calculate some variations and indicators.
After the calculations of the different indicators, as well as considered necessary transformations cited above, the data was exported to the Statistical Package of Social Sciences (SPSS) software, version 19, with the purpose of statistical analysis.
3.7 Methodology of the Multiple Linear Regression Model
In order to test the determinants of dividend, an inevitability arose to proceed with the estimation of an econometric model in order to conclude what kind of relationship presents the independent variables to explaining the dependent variables.
We opted for the realization of a quantitative and correlational research; quantitative because it resorts to numerical and correlational data and because it aims to explore and determine the existence of relationships between variables in the hypergeometric plan.
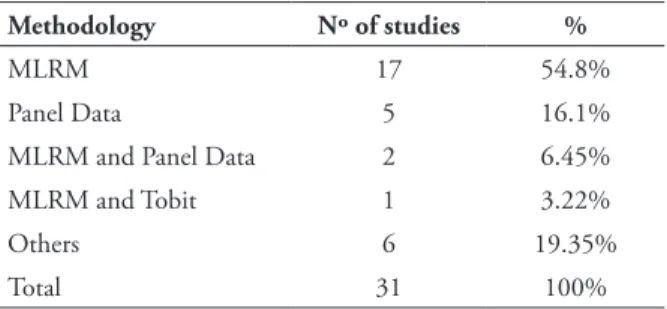
and a set of explanatory variables, or independent variables (Gujarati, 2003). he use of MLRM was also motivated by the fact that it is the recurrent methodology in studies in the ield of Corporate Finance. Table 1 summarizes the methodology used in 31 studies similar to ours, verifying that 54.8% of the analyzed studies applied a MLRM.
TABLE 1 – Methodologies used in similar studies in this ield
Methodology Nº of studies %
MLRM 17 54.8%
Panel Data 5 16.1%
MLRM and Panel Data 2 6.45%
MLRM and Tobit 1 3.22%
Others 6 19.35%
Total 31 100%
source: he authors
In regression performed, the p-value was considered for 5% signiicance level. he selection of variables with discriminative power was performed using the stepwise method in order to get the best possible model. his method consists in joining two other methods, Standard Regression and Hierarchical or Sequential
Regression, that is, a mixture of Forward and Backward methods which, according to Marôco (2011, p. 547), enables the analysis gradually adding or subtracting the variables analysis process automatically according to their discriminative capacity and fulillment of assumptions. After obtaining the best model, assumptions of MLRM were tested for examining the correlation coeicient (R), the coeicient of determination (R2), the results of the Durbin-Watson tests to
the residuals, and the Kolmogorov-Smirnov normality.
The coefficient of determination (R2)
is a measure of the dimension of the efect of the independent variable on the dependent variable, as described by the regression model (Marôco, 2011), and measures the total variability that is explained by the regression. Gujarati (2003) claims that the variables used in the MLRM must be according to the assumptions of residual normality, homoscedasticity and linearity coeicients, with no correlation between the waste and multicollinearity.
he functional relationship presented in MRLM between the dependent variable and the independent variables are the type:
Y
i=
b
0+
b
1X
1i+
β
2X
2i+
b
3X
3i+
β
4X
4i+
...+
β
k
X
ki+
ε
i (1)( i = 1,...n)
Yi - dependent variable, e.g. the dividends per share indicator;
β – coeicients of the regression to estimate;
X i - independent variables;
εi – error or random variable.
In this context, the explanatory power of the independent variables on the dependent variable were tested, and the inal model includes only the variables that have statistically signiicant and satisfactory assumptions of MLRM.
The least squares method is used to estimate the model parameters, in which the estimates of regression coeicients are obtained so that the errors or the residuals of the linear regression model, calculated by ei = yi − yˆi, were the minimum possible, in other words, the
distance between yiand ˆyibeing the lower possible, and where ˆyiare the expected values according to the model. hus, the estimation of the regression coeicients (b) is obtained after considering the effect of other independent variables on the dependent variable by determining the minimum of the function of the sum of squared errors (SSE) of the model.
The assumptions were tested by the recurrence of adjustment tests and by a graphical interpretation.
One of the model assumptions to validate is the homogeneity of the residuals, tested empirically through the White test (White, 1980), under the following assumptions:
H 0: t h e r e s i d u a l s v a r i a n c e s a r e homogeneous;
H1: the variances of the residuals are not homogeneous.
he statistical test of White (White, 1980) is given by:
(3)
he assumption of normal distribution of errors can be veriied graphically (Marôco, 2011) through the normal probability plot.
Other assumptions of the model to be validated are the multicollinearity of the explanatory variables, which occurs when they are highly correlated. his assumption can be measured by the variance inlation factor (VIF). his indicator shows when the value 1 corresponds to the absence of autocorrelation; when it presents values above the threshold value of 5, it is considered the existence of autocorrelation (Marôco, 2011).
The independence of the residuals is another assumption to be validated. It veriies, through the Durbin-Watson statistic - which measures the correlation between each residue and the residue to the immediately preceding period -, tests for the presence of autocorrelation between errors or residuals of the linear regression model. If the autocorrelation is present in a data set, the regression model could be seriously compromised.
he residuals independence assumption is tested by the following hypotheses:
H0: ρ=0 existence of independence. H1:
ρ≠0 existence of dependence.
(4)
According to Marôco (2011), in an empirical way, H0 is not rejected if d ≈ 2,0 (±0,2), but in a more accurate manner for this test, one should compare the value of d with the lower limit (dL) and an upper limit (dU) - these limits derive from the table “Critical Values for
the Durbin-Watson Test” - for a 5% signiicance
level, in order to test the hypotheses H0: no autocorrelation between residuals versus H1: there is autocorrelation between residuals. he Kolmogorov-Smirnov test with Lilliefors correction is a test of adjustment to normality under the following hypotheses, H0: X ~ N (μ, σ) vs H1: X ~ N (μ, σ).
he test statistic is given by the biggest diference between these two diferences, e.g. D= max {max (|F(xi)-F0(xi)|; Max (|F(xi-1)-F0(xi)|)} where F0(X)~N(μ,σ), the critical value of the Kolmogorov-Smirnov distribution is tabulated, being rejected H0 if D≥D table (α).
he stationary of the series was another of the assumptions to be scanned. According to Gujarati (2003), a time series is stationary if in all the moments of its probability distribution, the mean and the variance are constant over time. It is expected that the errors are independent. To verify the presence of diferent variances, graphical representation of the standardized residuals and estimated values were used. If the residuals are distributed more or less randomly around zero, the variance is constant. he assumption of normal distribution of errors is investigated through the normal probability plot, with recourse to the unit root test in order to assess the stationary of the series.
4 ANALYsIs OF THE MODEL, REsULTs AND DIscUssION
methodologies MLRM and Panel Data; and secondly, the analysis and discussion of the obtained results.
4.1 Analysis of the Estimation
In the MRLM, by applying the stepwise method, 15 diferent models were proposed and tested as well as 13 independent variables, which were selected. All the variables considered are statistically signiicant to a signiicance level of 5%, and traduces, as in Ribeiro (2010), in the method of ordinary least squares (OLS) with robust standard errors. This method proves to be suitable to fill any heteroscedasticity problems, susceptible to arise in sectional samples. To demonstrate the statistical inference of the regression model, which are considered more explanatory and robust, it was started an approach to the analysis of variance model, allowing to test the hypotheses H0: β1=β2=...=βk=0 vs H1: ∃i≠βi≠0; (i=1,...,k).. he value of the F statistic that has F-Snedecor distribution has a value of 45.018. his statistic is associated with a p-value = 0.00, which means that it is statistically signiicant for a signiicance level of 5%, rejecting H0 instead of H1, from which one can conclude that the model is essential.
After estimating the regression, it is veriied that it has a high explanatory capacity, that is, the tested independent variables explain 77.9% of the variations in the dependent variable. he explanatory power is much greater than that
presented by similar studies, since dividends follow a random walk4.
The presence of multicollinearity was checked by the VIF, and the model does not present multicollinearity problems, and through the Pearson correlation matrix it is concluded that the variables do not show strong correlation.
For the residual independence assumption, through the table “Critical Values for the Durbin-Watson Test”, H0 is not rejected, so it can be concluded that there is no autocorrelation between residuals.
hrough the analysis of the residual plots - normal probability plot - is possible to conclude that the residuals have a normal distribution, and also by the analysis of the scatter plot chart that are not in the presence of homocedasticity, being the series stationary, which was corroborated by the unit root test.
he Kolmogorov-Smirnov test, used to determine whether the errors follow a normal distribution to provide a p-value 0.223 higher than the 0.05 signiicance level, supports the conclusion for not rejecting H0, that is, the data have normal distribution, and it is possible to conclude that in the models there is no apparent breach of assumptions.
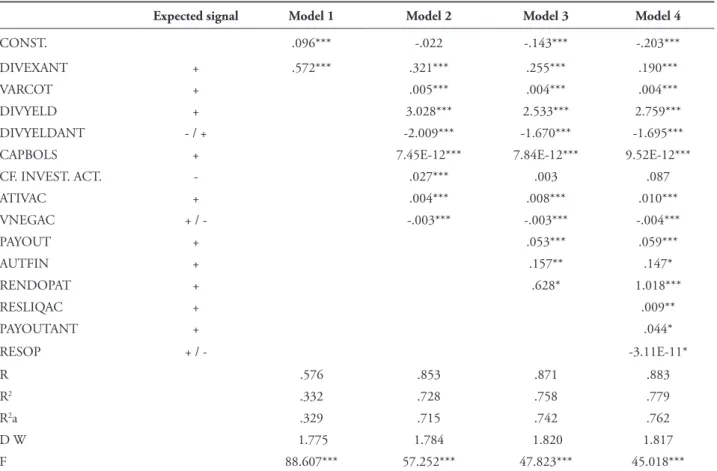
TABLE 2 – Summary of the outputs of some statistically signiicant models
Expected signal Model 1 Model 2 Model 3 Model 4
CONST. .096*** -.022 -.143*** -.203***
DIVEXANT + .572*** .321*** .255*** .190***
VARCOT + .005*** .004*** .004***
DIVYELD + 3.028*** 2.533*** 2.759***
DIVYELDANT - / + -2.009*** -1.670*** -1.695***
CAPBOLS + 7.45E-12*** 7.84E-12*** 9.52E-12***
CF. INVEST. ACT. - .027*** .003 .087
ATIVAC + .004*** .008*** .010***
VNEGAC + / - -.003*** -.003*** -.004***
PAYOUT + .053*** .059***
AUTFIN + .157** .147*
RENDOPAT + .628* 1.018***
RESLIQAC + .009**
PAYOUTANT + .044*
RESOP + / - -3.11E-11*
R .576 .853 .871 .883
R2 .332 .728 .758 .779
R2a .329 .715 .742 .762
D W 1.775 1.784 1.820 1.817
F 88.607*** 57.252*** 47.823*** 45.018***
Depent variable: value of the dividend per share.
*p signiicance <0.05; ** p signiicance <0.01; *** p signiicance <0.001
4.2 Discussion and analysis of results
For the analysis of the absolute values of standardized regression coeicients, it is veriied that the variables that have higher relative contributions in explaining the dividends per share are active per share, the dividend yield, the market capitalization, the operating proitability of the asset and turnover per share.
Analyzing the explanatory effect of independent variables on the dependent variable, it is proved, relatively to DIVEXANT variable, that the results show a signiicant positive efect on the dividends per share paid to shareholders, suggesting, therefore, that non-inancial companies listed on the market of Portuguese capital have a tendency to maintain a certain stability in its dividend policy. his stability is ensured by the variables PAYOUT, PAYOUTANT, DIVYELD,
meeting the conclusions of authors such as Lintner (1956), Ferreira et al. (2010) and Ribeiro (2010).
On a different note, the variable DIVYELDANT shows a negative relationship with the amount of dividends distributed, which is justiied due to respect of this indicator evidences the percentage of the remuneration of dependent shareholders of the dividend, while occurring a distribution in the form of dividends that will produce an increase in the quotation value. his appreciation of the price share changes the percentage of the remuneration to shareholders as dividends in the following year, ceteris paribus.
capital markets allow investors to earn higher amounts of dividends by action. his conclusion is also supported by the analysis of DIVYELD and DIVYELDANT variables, as referenced previously, and meets the conclusions reached by Gordon (1959) and Ribeiro (2010), who claim that the increase in the dividend amounted leads to the increase in the market value of the company, and vice versa.
The RESLIQAC variable evidences a significant and positive effect in relation to dividends, leading to the conclusion that a larger result shown at the end of iscal year provides greater distribution of dividends. his conclusion is consistent with that found by Lintner (1956) and the relevance theory of dividends, and contrary to the evidence of a negative relationship between net income and dividends, found by Ribeiro (2010).
Inconsistent with the assumption made on net income, the RESOP operating results demonstrate that the company’s operational activity results are statistically signiicant in the model, but have a negative relationship with the distribution of dividends. his negative relationship can be explained by the creation of growth and investment opportunities that a high value presented by these results creates for businesses.
Investment and growth opportunities are inancial variables with high use in studies with similar goals to ours, often measured by sales growth. However, this variable was not signiicant in explaining dividends in Portuguese case. his non-signiicance is coincident with the study of Ribeiro (2010).
The results presented by the variable RESOP suggest that the low from operating activities allows to create investment opportunities for companies, and the distribution of dividends to unsuccessful investment, looking to reinforce the idea that companies tend to retain the results to invest at the expense of its distribution, which is defended by DeAngelo et al. (2004) and Patra
et al. (2012).
The RENDOPAT variable, by the evidenced positive sign, leads us to conclude
that increased profitability provides greater distribution of dividends. This conclusion coincides with those obtained by DeAngelo et al. (2004), Fama and French (2001), Naceur
et al. (2006) and Holanda and Coelho (2012),
conlicting with the evidence found by Guzmán (2004) and Ribeiro (2010).
he VNEGAC variable as an indicator of the business dimension, contrarily to expectations, has a negative relationship with dividends distributed with signiicant statistical evidence. This result contradicts the evidence found by Ribeiro (2010), although these have been obtained for the turnover in absolute value and not for the value per share.
The relationship presented by this variable with the dividends paid per share, in that an increase in turnover provides growth opportunities of the company, allows us to observe that an increase in value presented by this variable takes the company to invest in order to grow in market, national or international, away from investment dividends. he inding of this negative relationship between growth opportunities and the dividend distribution is consistent with the empirical evidence and conclusions found by authors like Patra et al. (2012) and Gizelle et al. (2013).
he companies’ size, measured by ATIVAC variable, has a positive and statistically signiicant relationship with the dividends, defending the idea that larger companies pay more dividends, which meets the conclusion advocated by Holanda and Coelho (2012) and Gizelle et al. (2013).
Since the inancial autonomy indicator determines the percentage of assets that are inanced by equity, in general terms, the higher is this indicator, greater financial stability is presented by the company, inding also obtained by DeAngelo et al. (2009). However, Ribeiro (2010) suggests that the inancial autonomy is not statistically signiicant.
As to their solvency, the inancial stability of the company in the present study was not statistically signiicant.
The risk, measured by the stability/ volatility of the results, was tested empirically. Statistically significant explanation was not observed in the distributed dividend amount per share, contrarily to the results of Litner (1956) and Grullon et al. (2002). hese authors concluded that an increase in dividends is made by companies with lower risk.
5 cONcLUsIONs
As stated in the initial part of the work, the dividend policy has been one of the areas of corporate inance that has designed more works of empirical and theoretical research. his study was based on identifying the determinants of non-inancial companies’ dividend policy of the Portuguese capital market, and applied a MLRM, where the dependent variable is the dividend per share that the company distributes to its shareholders.
According to the Agency heory of Jensen and Meckling (1976), when the profitability is distributed in the form of dividends, it may have a mediating function of conlicts between investors and managers. Yet under the genesis of the Signaling heory, the distribution of dividends may be one way of signaling the market.
he indings for the indicator proitability allow meeting the view that the companies listed on the Portuguese stock market, which show a higher level of proitability and net income per share, are more likely to pay dividends. his is in line with the Relevance heory of Dividends.
Conflicting with the evidence of net income, a negative relationship by operating results was obtained, which allows concluding that this indicator has an opposite movement of the explained variable and indicating that it is not a higher value of operating results that will increase the amount distributed in dividends. herefore, it can be concluded that before growth opportunities, companies choose to retain results to invest.
Regarding the influence on dividend policy by the debt level presented by the company, it is possible to conclude that the dividends are negatively related to debt, in other words, a very indebted company tends to pay less dividends. his study shows that for the companies listed on Euronext Lisbon to distribute dividends, they must have an appreciation of the price of its shares and consequently of its market capitalization.
Companies that remained in the stock market index of Euronext Lisbon, from 1997 to 2011, have a maintenance trend and stability in the payout, granting privilege to practice stability in its dividend policy, evidence that coincides with the Lintner model (Lintner, 1956). As for the indication of companies’ dividend policy in a given iscal year, it is positively afected by dividends in the previous year.
Regarding the business dimension, the results obtained through a positive and signiicant relationship allow to conclude that larger companies show a trend to pay more dividends, which is consistent with the Agency heory.
The conclusions of several empirical studies on the dividend policy, as stated before, are not consensual, which leads us to believe that much can still be investigated upon in this area.
NOTAs
1. Cash low is the balance between the inlow and outlow of liquid assets (cash), resulting from the activities of the company.
2. Trade-of means a situation of conlict of choice, to
3. Escudo was the national currency of Portugal from May 22, 1911 until the entry into circulation of the Euro on January 1st, 2002.
4. Random Walk is the terminology used to describe the
random walk that dividends show as following.
REFERENcEs
Ali, M. (2010). Efect of dividend on stock price in emerging stock market: a study on the listed private commercial banks in DSE. International Journal of
Economics and Finance, 2(4), 52-64.
Almeida, M., Santos, J., Ferreira, L., & Torres, F. (2010). Determinantes da qualidade das práticas de governança corporativa das empresas brasileiras de capital aberto que possuem investimentos públicos. Revista Brasileira de Gestão de Negócios,
12(37), 369-387.
Arrazola, M., Hevia, J., & Mato, G. (1992). Determinantes de la distribucion de dividendos.
Investigaciones Económicas, 16(2), 235-258.
Bagüés, E., & Fumás, V. (1995). Explicaciones alternativas para la política de dividendos: análisis empírico con datos empresariales españoles.
Investigaciones Económicas, 19(3), 329-348.
Baker, M., & Wurgler, J. (2004). A catering theory of dividends. Journal of Finance, 59(3), 1125-1165.
Benzinho, J. (2007). he dividend policy of the Portuguese corporations: evidence from Euronext Lisbon. [MPRA Paper nº 1137]. Instituto Superior de Contabilidade e Administração de Coimbra –
ISCAC, Coimbra, Portugal.
Black, F. (1976). he dividend Puzzle. Journal of
Portfolio Management, 2(2), 5-8.
Brugni, T., Sarlo, A., Neto, Bastianello, R., & Paris, P. (2012). Inluence of dividends on the earnings informativeness: empirical evidence in the BM&FBovespa. Revista Universo Contábil,
8(3), 82–99.
Campbell, J., Shiller, R. (1998). Valuation Ratios and the long-run stock market outlook. Journal of
Portfolio Management, 24(2), 11-26.
Collins, J., & Kemsley, D. (2000). Capital gains and dividend taxes in irm valuation: evidence of triple taxation. he Accounting Review, 75(4), 405-427.
Cordeiro, R., & Machado, M. (2013). Estratégia de valor ou de crescimento? Evidências empíricas no Brasil. Revista Brasileira de Gestão de Negócios,
15(46), 91-111.
Corso, R. M., Kassai, J. R., & Lima, G. A. S. F. (2010, julho). Distribuição de dividendos e juros sobre capital próprio versus retorno de ações. Anais do Congresso USP Controladoria
e Contabilidade, são Paulo, sP, Brasil, 10.
Recuperado de http://www.congressousp.ipecai. org/web/artigos102010/141.pdf
Damodaran, A. (2001). Corporate inance: theory
and practice. (2nd ed.). Hoboken, NJ: Wiley.
DeAngelo, H., DeAngelo, L., & Skinner, D. (2004). Are dividends disappearing? Dividend concentration and the consolidation of earnings.
Journal of Financial Economics, 72(3), 425-456.
DeAngelo, H., DeAngelo, L., Skinner D., & Douglas J. (2009). Corporate Payout Policy.
Foundations and Trends in Finance, 3(2-3), 95-287.
Escuer, M., & Cabestre, F. (1995). El valor informativo de los dividendos sobre los beneicios futuros en el mercado de capitals español. Revista
Española de Financiación y Contabilidad, 24(82),
201-220.
Fama, E. (1970). Eicient capital markets: a review of theory and empirical work. Journal of
Finance, 25(2), 383-417.
Fama, E. (1991). Eicient capital markets II.
Journal of Finance, 46(5), 1575-1617.
propensity to pay? Journal of Applied Corporate
Finance, 14(1), 67-79.
Fama, E., & French, K. (2002). Testing trade-of and pecking order predictions about dividends and debt. he Review of Financial Studies, 15(1), 1-33.
Ferreira, W., Jr., Nakamura, W., Martin, D., & Bastos, D. (2010). Evidências empíricas dos fatores determinantes das políticas de dividendos das irmas listadas na Bovespa. FACEF, 13(2), 190-203.
Genotte, G., & Lelland, H. (1990). Market liquidity, hedging and crashes. American Economic
Review, 80(5), 999-1021.
Gizelle, P., Allen, M., & Weeks, S. (2013). Determinantes da política de dividendos para as empresas de ADR. Administração Financeira,
39(12), 1155 – 1168.
Gordon, J., & Shapiro, E. (1956). Capital equipment analysis: the required rate of proit.
Review Management Science, 3(1), 102-110.
Gordon, J. (1959). Dividends, earnings and stock price. Review of Economics and Statistics, 41(2), 99-105.
Grullon, G., Michaelly, R., & Swaminathan, B. (2002). Are dividend changes a sign of irm maturity?. he Journal of Business,75(3), 387-424.
Grullon, G., Michaelly, R., Banertzi, S., & haler, R. (2005). Dividend changes do not signal changes in future proitability. Journal of Business, 78(5), 1659-1682.
Gujarati, D. (2003). Basic econometrics (4th ed.). Boston: McGraw-Hill.
Haugen, A. (1999). he ineicient stock market.
Upper Saddle River, NJ: Prentice Hall.
Holanda, A., & Coelho, A. (2012). Dividendos e efeito clientela: evidência no mercado brasileiro.
Revista de Administração de Empresas, 52(4),
448-463.
Islam, T., Aamir, M., Ahmad, A., & Saeed, M. (2012). Determinants and motivators of dividend policy: a study of cement industry of Pakistan.
Mediterranean Journal of Social Sciences, 3(2),
103-108.
Jensen, C.; Meckling, W. (1976). Theory of the firm: managerial behaviour, agency costs and ownership structure. Journal of Financial
Economics, 3(4), 305-360.
Lameira, V. (2012). As relações entre governança e risco nas companhias abertas brasileiras. Revista
Brasileira de Gestão de Negócios, 14(42), 7-25.
Le Roy, F., & Porter, R. (1981). he present value relation: teste implied variance bounds. Journal
Econometric Society, 49(3), 555-574.
Lie, E. (2005). Financial lexibility, performance and the corporate payout choice. he Journal of Business,
78(6), 2179-2201.
Lintner, J. (1956). Distribution of incomes of corporations among dividends, retained earnings and taxes. American Economic Review, 46(2), 97-113.
Marôco, J. (2011). Análise Estatística com o SPSS
Statistics. Lisboa: Edições Sílabo.
Miller, H., & Rock, K. (1985). Dividend policy under asymmetric information. he Journal of
Finance, 40(4), 1031-105
Modigliani, F., & Miller, H. (1961). Dividend policy, growth and the valuation of shares. Journal
of Business, 34(4), 411-433.
Moreiras, L., Tambosi Filho, E., & Garcia, F. (2012). Dividendos e informação assimétrica: análise do novo mercado. Revista Administração, 47(4), 671-682.
Myers, S., & Majluf, N. (1984). Corporate inancing and Investment decisions when irms have information that investors do not have.
Journal of Financial Economics, 13(2), 187-221.
Naceur, S., Goaied, M., & Belane,S. A. (2006). On the determinants and dynamics of dividends policy.
International Review of Finance, 6(1-2), 1-23.
Papadopoulos, D. & Charalambidis, D. (2007). Focus on presente status and determinants of dividend payout policy: Athens stock exchange in prespective. Journal of Financial Management
and Analysis, 20(2), 24-37.
Patra, T., Poshakwale, S. & Ow-Yong, K. (2012). Determinants of corporate dividend policy in Greece. Applied Financial Economics, 22(13), 1079-1087.
Pietro, J., Neto, Decourt, R., & Galli, O. (2011). Proventos – a teoria da sinalização: variações de mercado. Revista de Administração Faces, 10(4), 150-168.
Reyna, J. (2012). A interação entre mecanismos internos e externos da governança como propulsor na criação de valor: um estudo internacional.
Revista Brasileira de Gestão de Negócios, 14(43),
143-158.
Ribeiro, A. (2010). Determinantes da política de dividendos: evidência empírica para as empresas não inanceiras cotadas na Euronext Lisbon. Revista
Portuguesa e Brasileira de Gestão, 9(1-2), 15-25.
Salsa, M. L. C. R. (2010). Politica de dividendos e ciclo de vida das empresas. Encontros cientíicos,
Tourism e Management Studies, 6, 162-174.
Shiller, J. (1981). Do Stock prices move too much to be justiied by subsequent changes in divi-dends. American Economic Review, 71(3), 421-436.
Silva, E., Santos, J., & Almeida, M. (2011). Conselho de administração: uma análise da inluencia nos níveis de endívidamento. Revista
Brasileira de Gestão de Negócios, 13(41), 440-453.
Summers, H., & Shleifer, A. (1990). he noisy trade approach to inance. Journal of Economic,
4(2), 19-33.
Tavares, F. (2013). Avaliação imobiliária: entre a
ciência da avaliação e a arte da apreciação. Porto:
Editora Vida Económica.
Watts, R. (1973). he information content of dividends. Journal of Business, 46(2), 191-211.
White, H. (1980). A heteroskedasticity-consistent covariance matrix estimator and a direct test for heteroskedasticity. Econometrica, 48(4), 817-838
Yegon, C.; Cheruiyot, J., & Sang, J (2014). Efects of dividend policy on irm’s performance: econometric analysis of listed manufacturing irms in Kenya. Research Journal of Finance and