Gender Differences in Spatial Cognition: Wayfinding Performance
and Sketch Mapping Activity of German Speakers
A Master Thesis
by
Vanessa Joy Alconaba Anacta
Institut für Geoinformatik (IFGI), Universität Münster Instituto Superior de Estatística e Gestão de Informação
(ISEGI), Universidade Nova de Lisboa Dept. Lenguajes y Sistemas Informaticos (LSI),
Universitat Jaume I, Castellón
Advisory Committee:
Angela Schwering, Assistant Professor at IFGI, University of Muenster Advisor
Co-supervisors:
Werner Kuhn, Professor at IFGI, University of Muenster Joaquin Huerta, Professor at LSI, Universitat Jaume I
! "
# $! % %
& "
" # '#(! # " (#'! ) '#
( * "
(#' * *
" "
+ , " *
" * # ' *
- './0'
"
" '#(
* * *
1 " " '
" & 2 " & 3 &
"
" "
! " !
! # $ %
& "
"
" ! # ' ( ) * +! # , - &
)., + )., +!
% !
! % ! ! * ! , ! # !
! ( ! , ! & ! # ! ! , "! # ! ! ! !
' ! / ! $ ! , ! 0 ! & ! % ! $ ! ( (! , ! ! !
( ! ! 1 ! # ! $ ! ( &! 2 ! % 2 ! 3 ! &
* 4 ''.
1
$ ! "
"
#
. #
$ ! " *
" "
TABLE OF CO TE TS
LIST OF FIGURES . . . .iii LIST OF TABLES. . . iv 1. I TRODUCTIO . . . 1
!
2. REVIEW OF RELATED LITERATURE. . . 4 " !
# $ %
! &
3. METHOD. . . .10
' ( ) ' ) * + , - . + /
01 ! /
'
4. RESULTS. . . .16
2 + ! 3 / 3 %
4 !
/ - 5
+ ( + $ $ ! )
* !
2 %
5 5. DISCUSSIO . . . 39
2 + ! 3 / 3 6
4 ! )
/
-+ ( + $ $ ! 5
! &
2 6
)
% ' + ! 0 )
% ' )
%
% 7 $
6. CO CLUSIO . . . .54
% # /
% # /
% " 8 5
REFERE CES. . . 58 APPE DIX
LIST OF FIGURES
List of Figures Page
" * *
" * ,
" 2 + 2 ! ,(- , -(, # 5
" 2 + 2 ! * 8 ! &
" ( ,(- -(, )
" % ( * 8 !
" 5 8 + -(,
,(-" & 8 + * 8 !
" 6 4 ! ,(- -(,
" ) 4 ! * 8 ! 5
" 4 ! -(, ,(- # &
" 4 ! * 8 ! )
" ! $ ,(- -(,
" 4 ! ! $ * 8 ! %
" 7 $ ,(- -(, %
" % 7 $ * 8 ! 5
" 5 $ $ ,(- -(, 5
" & $ $ * &
" 6 4 ! ,(- -(,
" ) 4 ! ! $ !
" 4 ! -(, ,(- #
" 4 ! * 8 !
" ( -(,
,(-" ( ! $ ! %
LIST OF TABLES
List of Tables Page
2 + 2 8 ( $ ( 0 # ,(- -(, 2 + 2 ! %
2 + 2 8 ( $ ( 0 # 2 + 2 ! &
2 + 2 8 ( $ ( 0 # / 6
2 + 2 8 ( $ ( 0 # / )
2 + 2 8 ( $ ( 0 # 8 +
2 + % 2 8 ( $ ( 0 # 8 +
2 + 5 2 8 ( $ ( 0 4 ! 9-(, ,(-:
2 + & 2 8 ( $ ( 0 4 ! 9# : %
2 + 6 2 8 ( $ ( 0 4 ! / &
2 + ) 2 8 ( $ ( 0 4 ! / 9# : 6
2 + 7 + 2 + # ,(- -(,
2 + / 9 /:3 3 / 3 ( + ,(- #
2 + / 3 3 / 3 ( + -(, #
2 + / * 8 !
2 + 7 + 2 + * 8 !
2 + % / 3 3 / 3 ( + *
2 + 5 / 3 3 / 3 ( + 8 !
CHAPTER 1 I TRODUCTIO
! "
# $
"
" %
&' ( ! ) %
& )
Objectives * )
+)
+ -)
Background of the Study !
%
$
& +..-)
% / %
0 !
$
% " &+..1)
2
& 333) 2
4 &+..5) 2
+,6 %
7
-Significance
"
" !
" 8 &+..9)
0
"
2 ,
"
Hypotheses )
,
+)
-)
Limitation of the Study
2 "
!
"# $%%&' (
)
* +
!
, "$%%-' .
"/ 011-2 .3 011-'
5
# "$%%&' 6
) 7 *
8
9 7
9
: ;
# "011$'
! 8 < =
< =
"> $%?-' :
"! $%?5'
@ "011-'
A;! A;!
+ A;!
A "$%%0' 9 ,
"A $%%B' # "011$'
C !
# "$%%%'
D "$'
&
7 8
, F
"@ 4 011?' ! F
@
"# $%%&'
@
"(*# > $%%?'
!
7 ".
. $%??'
@
" 011B' 8
" ! $%%B2
E $%%%'
G ! "$%% '
7 +
-7 ! "011-'
>>E B
7 1
) "$%%%' 7
9
7
+ @
"# $%%&'
# "$%% ' +
@ . 8
+ "# 4 011$' ! 9 "$%%-'
9 A @
+ 9 @
7 + +
,
* @ "
'
"! 0111' )
"4 011-' @ G
?
@ ! "$%%-'
+ @ +
9
"$%?&'
. . "011&'
! "011%' !
* "(*# > $%%?' >
! * *
"$%%1' *
9 *
9 "$%%1' "$%%&'
: > "$%?&'
" :!'
! ",
%
8
+ !
@ 4 "011?'
8 8 , , 8
@ A
!! !" # !$ "% #
& # & ' #
( ) #
# (
& *
+ * *
& ( (
( ,
# # & (
*
& #
& # # #
& #
& ' &
&
& (
# !$ # #
! ! - . #
!. "" #
/ & # 01
2 + 3 4 ' # #
6 & * # *#
# (
& #
* * #
# (
* # #
( & (
+ *
#
Study Area
# # 0 & #
7 ) #
& / & # 01 ) 8 ) / & 8 01
9&' * ) + * +
# : # #
#
& # * ( # / & #
01 * #
!
Fig. 2 Study Area
Route 1
Route 2
Route 3 Route 4
Route 5 Route 6
Route 7 Route 8
Route 9
Route 10
ROUTE B
. The Route Instructions
& 9 5 9 + !
9 5 & 9 &
' * ;! $
! . ( & # &
, & *
( *
& * & < :
* & * 5
& 9 . = > # (
? / # @ # ,
7 # ? A 5( 8 #
? + ( # B
= >Bitte biegen Sie an der Apotheke links ab und laufen geradeaus. Sie sehen die Ulf
Import Fahrschule zu Ihrer Rechten. Überqueren Sie eine Straße. Zu Ihrer Linken sehen Sie das
Restaurant Haus +iemann [ ]. Vor Ihnen sehen Sie die Johanniter Akademie Gästehaus.
Außerdem sehen Sie eine Kirche und einen Schlecker Supermarkt zu Ihrer Rechten.“
* >) ( % ?
/ @ # , 7
? A 5( 8 ?
+ ( '+' B =
>Bitte laufen Sie 70 Meter in Richtung +orden. Sie sehen die Ulf Import Fahrschule im Osten.
Überqueren Sie nun eine Ost6West verlaufende Straße. Sie sehen das Restaurant Haus +iemann
[ ] im Westen. Sie sehen die Johanniter Akademie Gästehaus im +orden. Außerdem sehen Sie
eine Kirche im OSO und einen Schlecker Supermarkt im Osten.“ 5
$ Self6report Sense of Direction
+ * + 6 +
=CC # * CD #C C * : E *
& F # ( + & E
& >0# > B & # B G
E & # ( > H * & #
B E & *
& # &
& 5 9 5* 9 & 9 5 9 &
5* E * (
& 9 5 * &
9 ( &
* ( ( C (
3 9 5 9 5 5. < & *#
# ( + * +
6 + I
( & C 5
: +C * ( &
( * &
( C # C
* &
# & *
:
* 5 :
# (
5 9 5 ( * ( #
C ( 9
( # (
16
CHAPTER IV
RESULTS
This chapter discusses the results of the outdoor wayfinding experiment using the Mixed ANOVA (Analysis of Variance) in SPSS. This statistical analysis tests the mean differences between two or more independent variables while subjecting participants in repeated measures. The indicators that were analyzed to examine the participant’s wayfinding performance are travel time, speed, number of stops, number of deviations and the off-route distance travelled. The results for both the groups A-R and R-A as well as the performance of men and women in both frames of reference.
Travel Time, Distance and Speed
Travel Time for A-R and R-A
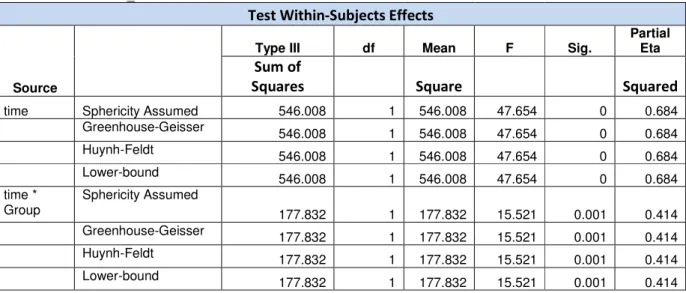
In the Mixed ANOVA result shown in Table 1 where the time spent in the first five set of routes was the within-subject factor and the group (A-R and R-A) as the between-subject factor, it shows that the main effect of time was significant as well as time and group interaction, F (1,22) = 47.65, p < 0.001 and F(1,22) = 15.52, p < .01, respectively. Hence, this means that there are differences in the travel time between groups. Although, as shown in the result for the between-subjects which is the group, the effect is less significant having (.097), p < .05.
Table 1. Test Within-and Between-Subjects Effects of Groups A-R and R-A Travel Time
Measure: MEASURE_1
Test Within-Subjects Effects
Source
Type III df Mean F Sig.
Partial Eta
Sum of
Squares Square Squared
time Sphericity Assumed 546.008 1 546.008 47.654 0 0.684
Greenhouse-Geisser 546.008 1 546.008 47.654 0 0.684
Huynh-Feldt 546.008 1 546.008 47.654 0 0.684
Lower-bound 546.008 1 546.008 47.654 0 0.684 time *
Group
Sphericity Assumed
177.832 1 177.832 15.521 0.001 0.414
Greenhouse-Geisser 177.832 1 177.832 15.521 0.001 0.414
Huynh-Feldt 177.832 1 177.832 15.521 0.001 0.414
17
Source Type III df Mean F Sig.
Partial Eta
Sum of
Squares Square Squared
Error(time) Sphericity Assumed 252.069 22 11.458
Greenhouse-Geisser 252.069 22 11.458
Huynh-Feldt 252.069 22 11.458
Lower-bound 252.069 22 11.458
Test Between-Subjects Effects
Measure: MEASURE_1
Transformed Variable: Average
Source
Type III df Mean F Sig.
Partial Eta
Sum of
Squares Square Squared
Intercept 18374.274 1 18374.27 1321.392 0 0.984 Group 41.869 1 41.869 3.011 0.097 0.12
Error 305.915 22 13.905
Fig. 3 shows the plotted travel time for both the A-R and R-A groups. It would take a longer time for participants to follow absolute instructions in both goups. The A-R group took an average of 40.99 minutes to finish the experiment while it took 36.89 minutes for the R-A group. The average time spent for R-A and A-R groups in Route A is 19.87 and 25.8 minutes, respectively. For Route B, on the other hand, it took an average time of 17.02 minutes for R-A group and 15.19 minutes, respectively.
R-A A-R Group 30 25 20 15 10 T ra v e l T im e 2 1 Route Set A B
18
Travel Time for Gender
Table 2 shows that there is a significant effect of the travel time of route set with F(1,22) = 5.031, p < .05. This means that there are differences of time spent by men and women for each route set. Although, the effect for the interaction of gender and the interaction is not significant.
Table 2. Test Within-and Between-Subjects Effects of Gender
Test Within-Subjects Effects
Source
Type III df Mean F Sig.
Partial Eta
Sum of Squares Square Squared
Routeset_time Sphericity Assumed 180.226 1 180.226 5.031 0.035 0.186
Routeset_time * Gender
Sphericity
Assumed 5.556 1 5.556 0.155 0.698 0.007
Error(Routeset_time)
Sphericity
Assumed 788.059 22 35.821
Test Between-Subjects Effects
Source
Type III df Mean F Sig.
Partial Eta
Sum of Squares Square Squared
Intercept 18197.83 1 18197.83 1092.289 0 0.98 Gender 1.916 1 1.916 0.115 0.738 0.005
Error 366.526 22 16.66
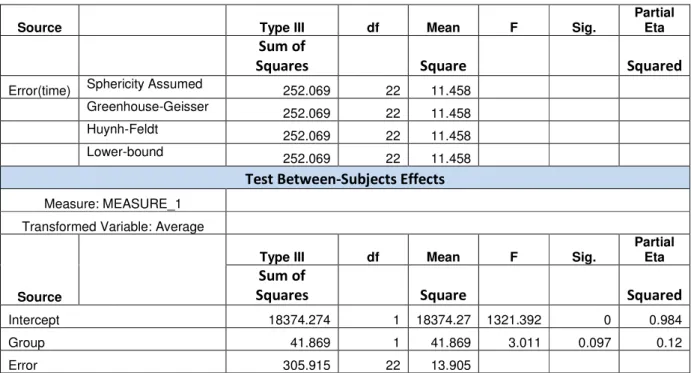
For the whole experiment, the average time spent by both men and women is 38.54 and 39.69 minutes, respectively. Fig. 4 shows the comparison of the time spent for both men and women. It shows that there is more time spent in travelling the absolute instructions than in relative directions.
Fig. 4 Travel Time of Men and Women Absolute Relative
19
Distance travelled by A-R and R-A (focus on off-route)
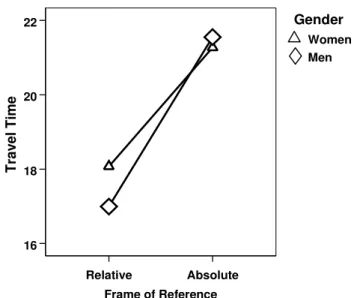
There is a significant effect of off-route distance and group interaction, F (1,22) = 4.96, p < .05 (see Table 3). Although, there is no significant effect seen in distance and between-subject variable, Group since p > .05.
Table 3. Test Within-and Between-Subjects Effects of Distance (A-R and R-A)
Test Within-Subjects Effects
Source
Type III df Mean F Sig.
Partial Eta
Sum of Squares Square Squared
Routeset_distance
Sphericity Assumed
11718.75 1 11718.75 1.486 0.236 0.063
Routeset_distance * Group
Sphericity Assumed
39102.083 1 39102.08 4.958 0.037 0.184
Error(Routeset_distance)
Sphericity Assumed
173498.167 22 7886.28
Test Between-Subjects Effects
Source
Type III df Mean F Sig.
Partial Eta
Sum of Squares Square Squared
Intercept 101200.333 1 101200.3 9.277 0.006 0.297 GROUP 3960.333 1 3960.333 0.363 0.553 0.016 Error 239986.333 22 10908.47
20
Distance of Gender
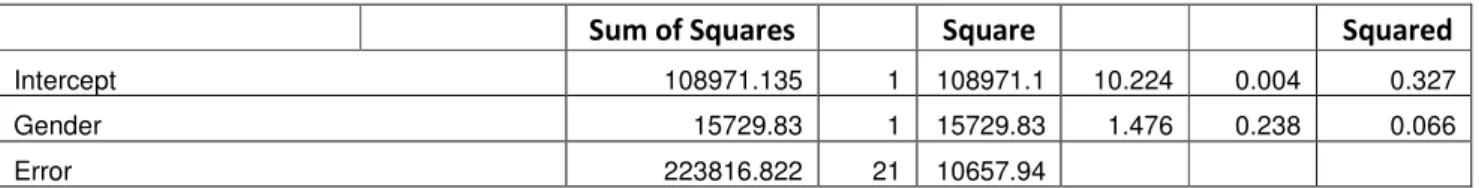
In terms of the off-route distance for gender, the main effect of frame of reference set was significant, F (1, 22) = 5.15, p < .05. Both men and women walked longer off-route distances in the absolute frame of reference. However, it shows that there is no significant effect of the interaction of gender and route set and gender per se.
Table 4. Test Within-and Between-Subjects Effects for Gender
Test Within-Subjects Effects
Source
Type III df Mean F Sig.
Partial Eta
Sum of Squares Square Squared
Routeset_distance
Sphericity
Assumed 42525.158 1 42525.16 5.155 0.034 0.197
Routeset_distance * Gender
Sphericity
Assumed 10296.55 1 10296.55 1.248 0.277 0.056
Error(Routeset_distance)
Sphericity
Assumed 173220.277 21 8248.585
Test Between-Subjects Effects
Source Type III df Mean F Sig.
Partial Eta R-A A-R Group 100 75 50 25 0 O ff -R o u te D is ta n c e ( m ) 2 1 Route Set A B
21
Sum of Squares Square Squared
Intercept 108971.135 1 108971.1 10.224 0.004 0.327 Gender 15729.83 1 15729.83 1.476 0.238 0.066
Error 223816.822 21 10657.94
As seen in Fig. 6, it shows that men walked longer distances when they went off the route in both frames of reference. Men walked 1.24 km off-route in the absolute frame while women traveled 548 m off-route distance. In the relative frame, on one hand, men walked 240 m off-route while women walked 177 m.
Speed of A-R and R-A
The walking speed was recorded in terms of steps per minute of each participant in every route. It was averaged for both Route A and Route B to examine whether there had a been a change in their speed. Route set was the within-subject factor and the group was the between-subject factor. In Table 5, It showed that there is no significant effect in terms of walking speed for both groups, F (1, 22) = 2.78, p > .05. This means that participants maintained their normal walking speed
Fig. 6 Off-route distance of Men and Women Absolute Relative
22 when a shift to another frame of reference was given. But, for the route set and group interaction, there is a significant difference with F (1, 22) = 6.23, p < .05.
Table 5. Test Within-and Between-Subjects Effects of Walking Speed (A-R and R-A)
Test Within-Subjects Effects
Source
Type III df Mean F Sig.
Partial Eta
Sum of Squares Square Squared
Routeset_speed
Sphericity
Assumed 26.181 1 26.181 2.781 0.11 0.112
Routeset_speed * Group
Sphericity
Assumed 58.631 1 58.631 6.227 0.021 0.221
Error(Routeset_speed)
Sphericity
Assumed 207.139 22 9.415
Test Between-Subjects Effects
Source
Type III df Mean F Sig.
Partial Eta
Sum of Squares Square Squared
Intercept 552863.273 1 552863.3 6451.893 0 0.997 Group 19.956 1 19.956 0.233 0.634 0.01
Error 1885.182 22 85.69
Fig.7 shows the plotted result of group’s walking speed. For A-R group, the participants had an average of 104.83 steps per minute in the absolute frame of reference whereas, in the relative frame of reference, the average walking speed was 108.52 steps per minute. In the R-A group, there was not much of a difference as they had walked an average of 108 steps per minute for each major route.
R-A A-R Group 110 109 108 107 106 105 104 W a lk in g S p e e d 2 1 Route Set A B
23
Speed of Gender
There was a significant effect of the frame of reference set, F (1,22) = 4.86, p < .05. There was a difference of the walking speed in the absolute and relative frame of reference of men and women. Although, for the interaction and the gender, there was no significant effect.
Table 6. Test Within-and Between-Subjects Effects of Walking Speed of Gender
Test Within-Subjects Effects
Source
Type III df Mean F Sig.
Partial Eta
Sum of Squares Square Squared
Routeset_speed
Sphericity
Assumed 52.605 1 52.605 4.863 .038 .181
Routeset_speed * Gender
Sphericity
Assumed .788 1 .788 .073 .790 .003
Error(Routeset_speed)
Sphericity
Assumed 237.998 22 10.818
Test Between-Subjects Effects
Source
Type III df Mean F Sig.
Partial Eta
Sum of Squares Square Squared
Intercept 556302.906 1 556302.906 5992.703 .000 .996 Gender 333.644 1 333.644 3.594 .071 .140
Error 2042.261 22 92.830
24
Number of Stops
A-R and R-A
The number of stops was recorded for each route when the participant stopped for 15 seconds or longer. The video was the basis in reviewing the wayfinding performance of each participant. The stops mean that s/he is trying to understand the verbal route instructions and to figure out whether s/he is heading the right path.
In Table 7, there was a significant effect of Route set(stops) and Route set (stops) x Group interaction with F (1,22) = 7.615, p < .05 and F (1,22) = 10.36, p < .01, respectively. This means that participants made many stops on one set of five routes. Also, there was a significant main effect of Group with F (1,22) = 4.25, p =.05. Hence, there was a difference with the number of stops each group made.
Fig. 8 Walking speed of Men and Women Absolute Relative
25 Table 7. Test Within-and Between-Subjects Effects of Number of Stops (A-R and R-A)
Test Within-Subjects Effects
Source
Type III df Mean F Sig. Partial Eta
Sum of Squares Square Squared
Routeset_stops
Sphericity
Assumed 12 1 12 7.615 0.011 0.257
Routeset_stops * Group
Sphericity
Assumed 16.333 1 16.333 10.365 0.004 0.32
Error(Routeset_stops)
Sphericity
Assumed 34.667 22 1.576
Test Between-Subjects Effects
Source
Type III df Mean F Sig. Partial Eta
Sum of Squares Square Squared
Intercept 60.75 1 60.75 25.62 0 0.538 GROUP 10.083 1 10.083 4.252 0.051 0.162
Error 52.167 22 2.371
Fig. 9 shows the plotted result for A-R group, the participants made more stops in the first set of routes with absolute instructions and made fewer stops in the second set with relative instructions. For R-A group the participants made more stops in the second set of routes with the absolute directions. R-A A-R Group 3.0 2.5 2.0 1.5 1.0 0.5 0.0 N u m b e r o f S to p s 2 1 Route Set A B
26
Gender
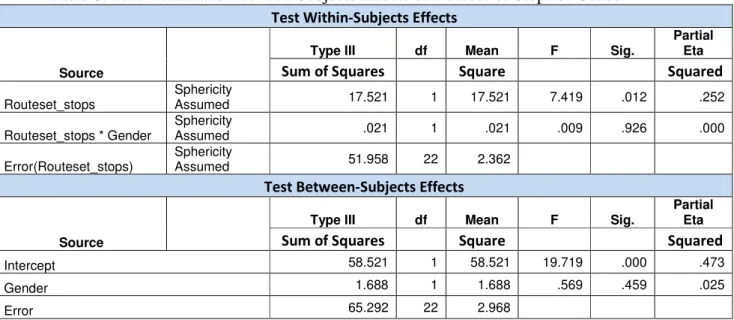
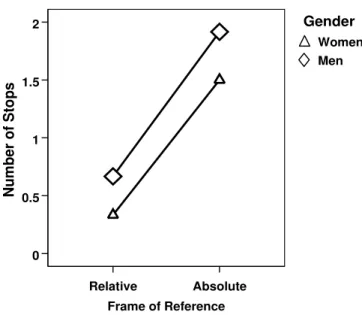
The main effect of frame of reference set was significant, F (1, 22) = 7.42, p < .05. This means that there is difference on how men and women perform in absolute and relative frame of reference. That they tend to make more stops in absolute directions. There was no significant effect shown for the route set and gender interaction as well as the gender showing p > .05.
Table 8. Test Within-and Between-Subjects Effects of Number of Stops of Gender
Test Within-Subjects Effects
Source
Type III df Mean F Sig.
Partial Eta
Sum of Squares Square Squared
Routeset_stops
Sphericity
Assumed 17.521 1 17.521 7.419 .012 .252
Routeset_stops * Gender
Sphericity
Assumed .021 1 .021 .009 .926 .000
Error(Routeset_stops)
Sphericity
Assumed 51.958 22 2.362
Test Between-Subjects Effects
Source
Type III df Mean F Sig.
Partial Eta
Sum of Squares Square Squared
Intercept 58.521 1 58.521 19.719 .000 .473 Gender 1.688 1 1.688 .569 .459 .025
Error 65.292 22 2.968
27
Deviation of Routes
A-R and R-A
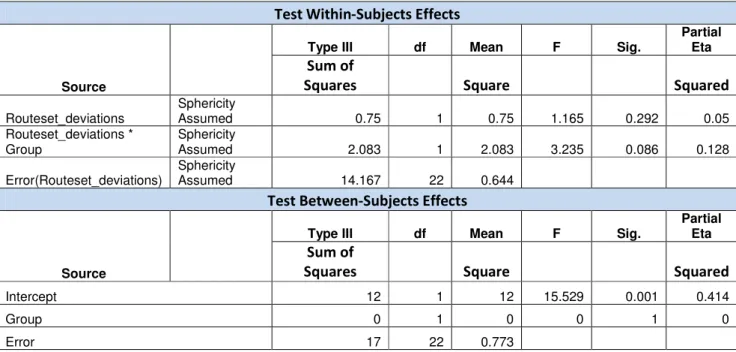
Deviation of the route whether just few meters were recorded in each route. Also, the off-route distances were taken into account to determine how far each participant deviated from a particular route. Similar to the number of stops, mixed ANOVA was used for analysis. Table 9 shows that the main effect of group was not significant F (1,22) = 4.25, p > .05. Also, there was no significant effect of route set with F (1,22) = 1.165, p > .05 whereas route set x group interaction showed less significant effect, F (1,22) = 3.235, p < .1. However, it should be pointed out that although, there is no resulting significant effect, it does not mean that it is not important to studyany differences in the performance. Looking at the estimated mean for the group deviations, it could be observed that there is a difference of the mean for the A-R group in both route set which means that participants deviated more in the absolute frame of reference.
Fig. 10 Number of stops of Men and Women Absolute Relative
28 Table 9. Test Within-and Between-Subjects Effects of Number of Deviations (A-R and R-A)
Test Within-Subjects Effects
Source
Type III df Mean F Sig.
Partial Eta
Sum of
Squares Square Squared
Routeset_deviations
Sphericity
Assumed 0.75 1 0.75 1.165 0.292 0.05 Routeset_deviations *
Group
Sphericity
Assumed 2.083 1 2.083 3.235 0.086 0.128
Error(Routeset_deviations)
Sphericity
Assumed 14.167 22 0.644
Test Between-Subjects Effects
Source
Type III df Mean F Sig.
Partial Eta
Sum of
Squares Square Squared
Intercept 12 1 12 15.529 0.001 0.414
Group 0 1 0 0 1 0
Error 17 22 0.773
Looking at Fig. 11, it could be observed that the A-R group had many deviations when the instructions started in the absolute frame and they improved when it shifted to relative directions. In a similar observation for the R-A group, the participants made few deviations in the relative frame but incurred many deviations when the absolute direction was given.
R-A A-R Group 1.00 0.75 0.50 0.25 0.00 N u m b e r o f D e v ia ti o n s 2 1 Route Set A B
29
Gender
Table 10 shows that the difference of route set for the gender with F (1,22) = 3.14, p < .05. This means that there was there was an effect of both absolute frames of reference with how the participants fared in the task. Although, it showed that there was no significant effect for the interaction of route set and gender as well as gender showing F (1,22) = .503, p > .1 and F (1,22) = 1.01 p > .1, respectively.
Table 10. Test Within-and Between-Subjects Effects of Number of Deviations (Gender)
Test Within-Subjects Effects
Source
Type III df Mean F Sig.
Partial Eta
Sum of
Squares Square Squared
Routeset_deviations
Sphericity
Assumed 2.083 1 2.083 3.143 0.09 0.125 Routeset_deviations *
Gender
Sphericity
Assumed 0.333 1 0.333 0.503 0.486 0.022
Error(Routeset_deviations)
Sphericity
Assumed 14.583 22 0.663
Test Between-Subjects Effects
Source
Type III df Mean F Sig.
Partial Eta
Sum of
Squares Square Squared
Intercept 12 1 12 16.246 0.001 0.425 Gender 0.75 1 0.75 1.015 0.325 0.044
Error 16.25 22 0.739
30
Sense of Direction Self-Report and Relationship with the Wayfinding measures
In the Sta. Barbara sense of direction questionnaire, the mean was calculated for each participant. However, the negative questions were translated into positively type statement so that the higher the number means that they have high sense-of-direction. The result was then correlated with the number of stops, deviations, and off-route distances taking into account the absolute frame of reference only.
To evaluate the correlation between the participants and the wayfinding performance, the result in the absolute instructions was used following the previous study. Table 11 shows the correlation of Sense of Direction (SOD) of both A-R and R-A participants to the wayfinding measures. It means that there was a negative correlation of for the number of stops which means participants with high SOD tend to make more stops. Whereas, for deviations and off-route distances, a positive correlation resulted, which means that participants with high SOD tend to make fewer deviations and did not go off the route more frequently.
Fig. 12 Number of route deviations of Men and Women Absolute
Relative
31 Table 11. Correlation Table for Groups A-R and R-A
A-R and R-A GROUP
SOD Stops Deviations Off-Route
SOD Pearson Correlation 1 -0.373 0.108 0.128
Sig. (2-tailed) 0.072 0.615 0.551
N 24 24 24 24
Table 12 shows the result of the SOD of each participant in the A-R group. As shown in the result, the participant who rated himself to have a high SOD did not make any stop, deviation and did not travel longer off-route distance.
Table 12. Sense of Direction (SOD), Stops, Deviations, and Off-route distance result of A-R Group*
SOD Stops Deviations
Off-route distance
3.13 3 0 0
3.13 8 2 154
3.53 5 2 232
3.67 0 0 0
3.73 2 1 113
3.8 4 0 0
3.87 2 1 210
3.93 3 1 345
3.93 3 1 65
3.93 0 0 0
3.93 4 2 71
4.13 0 0 0
*in absolute frame of reference
32 Table 13. Sense of Direction, Stops, Deviations, and Off-route distance result of R-A Group*
SOD Stops Deviations
Off-route distance
3.1 0 0 0
3.4 0 0 0
3.53 0 0 0
3.8 0 0 0
3.87 1 0 0
4.1 1 1 15
4.1 2 0 0
4.13 0 0 0
4.27 1 2 60
4.33 3 4 522
4.33 0 0 0
4.4 0 0 0
*in absolute frame of reference
The descriptive statistics in Table 14 shows that there is higher mean for most of the performance measures of men than women. There is a big difference in terms of the mean for the off-route distances made in the absolute frame.
Table 14. Descriptive Statistics of Men and Women
N
Men Women
Mean
Std.
Deviation Mean
Std. Deviation
SOD 12 3.8767 0.38431 3.7958 0.38587
Stops 12 2.08 1.676 1.42 2.429
Deviations 12 0.92 1.24 0.5 0.798
Off-Route 12 103.25 172.009 45.67 74.224
33 sense of direction made less stops, less deviations, as well as off-route distances. Whereas, men who had better sense of direction made less stops but with more deviations, and travelled long off-route distances.
Table 15. Correlation Table for Men and Women
Men
SOD Stops Deviations Off-Route
SOD Pearson Correlation 1 -0.217 0.427 0.282
Sig. (2-tailed) 0.498 0.167 0.375
N 12 12 12 12
Women
SOD Stops Deviations Off-Route
SOD Pearson Correlation 1 -0.456 -0.312 -0.269
Sig. (2-tailed) 0.137 0.324 0.397
N 12 12 12 12
Table 16 shows the result of the SOD scale for men. It shows that most participants who have better SOD tend to have more stops, deviations, and travelled longer off-route distances. Although, there was one who was able to judge himself to have a better SOD who did not incur any stop, deviation and off-route distance.
Table 16. Sense of Direction, Stops, Deviations, and Off-route distance result of Men*
SOD Stops Deviations
Off-route distance
3.13 3 0 0
3.4 0 0 0
3.53 5 2 232
3.67 0 0 0
3.8 4 0 0
3.93 3 1 345
3.93 3 1 65
4.1 1 1 15
34
SOD Stops Deviations
Off-route distance
4.27 1 2 60
4.33 3 4 522
4.33 0 0 0
3.88 25 11 1239
*in absolute frame of reference
In the case of women, those who rated themselves to have better SOD did not make any stop, deviation and did not travel off the route. Although, there was one participant who judged herself to have poor SOD but ended up not making any stop, deviation and off-route distance.
Table 17. Sense of Direction, Stops, Deviations, and Off-route distance result of Women*
SOD Stops Deviations
Off-route distance
3.1 0 0 0
3.13 8 2 154
3.53 0 0 0
3.73 2 1 113
3.8 0 0 0
3.87 2 1 210
3.87 1 0 0
3.93 0 0 0
3.93 4 2 71
4.13 0 0 0
4.13 0 0 0
4.4 0 0 0
3.796 17 6 548
*in absolute frame of reference
Sketch Mapping Activity
35 after walking through the two sets of route were the landmarks, the correct turns, and the number of streets drawn. The number of landmarks taken into account were those written in the instructions whether they were still able to remember it. This is regardless of how they draw the landmarks on the sketch map. The correct turns show the path the participant took whether s/he remembers how to have reached the goals. The number of streets drawn does not only pertain to those written in the instructions rather including other path they noticed while they were walking through the route.
Landmarks
For the A-R group, participants were not able to remember all the landmarks for Route 1. This also shows with the R-A group as shown in Fig. 13 although, the participants from this group were able to draw more landmarks in this route.
Men drew less number of landmarks than women. An accumulated number of landmarks drawn by men totaled 210 while for women a total of 252 landmarks were drawn. However, there was not much big difference when drawing the other landmarks for the other routes as shown in the
36 graphs. Fig. 14 shows the landmarks drawn by men and women in relation to the total number of landmarks.
Turns
There was a total of 16 turns for the whole experiment. Participants in both A-R and R-A group were able to draw the correct number of turns. Although, Route 4 was a little bit confusing to draw as shown in the result in Fig. 15 for the correct turn of both groups.
Fig. 14 Number of Landmarks drawn by Men and Women
37 Both men and women drew the same total number of correct turns with Route 4 as one confusing route where they had missed a turn. In Route 7, most women also missed s turn going to the next goal. Fig. 16 shows a comparison of the correct turns drawn by men and women vis-a-vis the total number of turns.
Streets drawn
In Route 1, the participants crossed many streets yet, few of them were drawn. Looking at Fig. 17, there is not much difference on the number of streets drawn by both groups. Apart from Route 1, participants also missed to include some streets they crossed in Route 4.
38 There was not much big difference on the number of streets drawn by men and women (Fig. 18). Routes 1 and 4 showed that many streets were missed by most participants.
ROUTE A ROUTE B
Fig. 18 Streets drawn drawn by Men
ROUTE A ROUTE B
39
CHAPTER V
DISCUSSION
This chapter provides an in-depth discussion of the results from the statistical analysis following the same outline in the previous chapter. This also includes a brief description of problems encountered while doing the experiment.
Travel Time, Distance and Speed
Travel Time
A-R and R-A
The time spent by each participant for each route was recorded so with the distance they travelled. There were differences in the time spent for groups A-R and R-A wherein it would usually take a longer time in following absolute frame of reference for each group. Comparing both instructions, it will usually take lesser time to follow when directions are given in relative frame.
Gender
There is a significant difference in comparing the time spent by men and women in both absolute and relative frames of reference. When instructions are in absolute frame, they tend to spend longer time than relative directions. For women, it took them an average of 21.27 minutes for the absolute frame while in the relative frame, it took them 18.07 minutes. For men, on the other hand, it took them 21.55 minutes in the absolute frame and in the relative frame, it took them 17 minutes.
Distance
R-A and A-R
40
Gender
Men travelled more distances than women. This was shown in the result of the off-route distances they made and mostly in the absolute frame of reference. Women tend to travel more distances when they are given the first route set of instructions. But, when it shifted to another set of instruction whether absolute or relative, they did not walk off the route.
Speed
A-R and R-A
There was no big difference in terms of the walking speed for both groups when there was a shift to another frame of reference. This means that the participants walked smoothly through the routes verbally described. Also, regardless of the weather.
Gender
There are no differences of the walking speed for men and women as they tend to maintain the walking speed when a shift from relative to absolute frame of reference or vice versa. In the relative frame, they would usually walk in a fast pace.
Number of Stops
A-R and R-A
41 group in Route A (absolute frame) and 5 stops only in Route B (relative). For the R-A group, 7 stops were recorded for both absolute and relative frames of reference. Fig. 19 shows the number of stops for both groups.
Gender
From the results, it showed that there was a significant effect of the number of stops for both frames of reference. Although, it was not significant in the other statistical result such as gender and the interaction, yet it is still interesting to consider that there were differences in the number of stops made by both men and women. It is in the absolute frame of reference that both genders had many stops. It was a bit confusing for men to follow Routes 3 and Routes 4. Although Route 3 was quite easy to find because it is situated in a corner street, perhaps the name was not quite visible that they had to stop several times. Route 4, on the other hand, was a little bit difficult for men to follow as compared to women. The route was quite hard to describe because of a presence of an island along the main street. In the case of women, Route 2 was a bit confusing for two participants thus, they made two or more stops in this route. Women did not make any stop in Routes 7 and 8 even if the instructions shifted to absolute frame of reference. The number of stops made by women in absolute and relative frames of reference is 18 and 4,
42 respectively. While men made 23 stops in the absolute direction and 8 in the relative frame. Fig. 20 shows the number of stops of all the participants in both A-R and R-A groups.
Deviation of Routes
A-R and R-A
For both A-R and R-A group, it showed that the route set with more deviations was the absolute frame of reference. Once the instructions shifted to a relative frame of reference, participants made few or no deviations. For the A-R group, Routes 1, 3 and 4 incurred more deviations. In Route 1, the major reason why some participants deviated was a different perception of a landmark. The goal for the first route was a telephone booth. It happened that they were still looking for a yellow booth which was recently changed into a pink open telephone stand. Although, the former could still be seen in other areas of the region but the telephone company has already changed the design and deployed them in many locations in the city. (see photos 1 and 2)
In Route 3, participants showed different behavior in walking towards the goal which is a restaurant. This was one of the major reasons why deviations occurred in this route. It was stated in the instruction to “cross the east-west running road”, what others decided was go to the stoplight first and from there crossed the street and went to the goal.
Fig. 20 Number of stops of men and women
43 As stated in the previous discussion, Route 4 has a difficult path to follow. Some of the participants misinterpreted instructions. Also, it would take awhile for some of them to orient themselves from Route 3 to Route 4 because of a unique street network.
In the A-R group, Route 7 incurred many deviations. Those who deviated in this route overestimated the distance from the last goal.
A total of 10 deviations for Route A (absolute directions) was incurred by A-R group whereas for the R-A group, only 3 deviations were made by the participants for the same route set. It was in the absolute frame of reference where more of the deviations occurred. Fig. 21 shows the number of deviations of participants for both R-A and A-R groups.
44
Gender
From the result, men made many deviations than women. The number of deviations men incurred for the relative frame is 4 while in the absolute frame, they incurred 11 deviations. For women, they made 3 deviations in the relative frame and 6 deviations following the absolute direction. It is interesting to know that women had many deviations only in the first set of routes but no deviation occurred when there was a shift to another frame of reference whereas, men deviated several times.
Men tend to travel more distances than women when they went off the route. It is observed that most participants would not pay much attention to distances stated in the instructions, rather they woud refer to the landmarks mentioned. People tend not to use distance information when it implied a target location which means within the landmark configuration (Waller et al, 2002). However, there was a woman participant who said that she would prefer the absolute instructions better because she could estimate where to make a turn based on the distance indicated. For relative reference frame, it is sometimes difficult to estimate where to take the next turn especially when few landmarks are given.
45 Off-Route Distance
A-R and R-A
For A-R group in the absolute frame, participants travelled a total of 1,190 m but in the relative frame, they only went off-route for 130 m. The R-A group, on the other hand, traveled 287 m off-route in the relative frame while 597 m in the absolute direction. Fig. 23 shows the off-route distances travelled by participants in both groups.
Fig. 22 Number of route deviations of Men and Women
Fig. 23 Off-route distance of R-A and A-R group
R-A A-R
46
Gender
Both men and women walked longer off-route distances in the absolute frame of reference. Men walked 1.24 km off-route in the absolute frame while women traveled 548 m off-route distance. In the relative frame, on one hand, men walked 240 m off-route while women walked 177 m. It also shows that women tend not to walk off the route in second set of the route instructions. Whereas men travelled 727 m off-route distance for the second set of routes which are either in a relative or absolute frame of reference.
Fig. 25 shows the off-route distance travelled by men and women in every route regardless of whether in absolute or relative frame of reference. It shows that women walked longer off-route distance in Route 1 while for men it is Route 7. Although, only one person made so many deviations in this route. It is in Routes 3 and 4 where most of the men walked off the route.
Fig. 24 Off-route distance of men and women
R-A A-R
47
Sense of Direction Self-Report and Relationship with the Wayfinding measures
The Sta. Barbara sense-of-direction questionnaire was an indicator of how well the participant judged his spatial and navigational abilities, preferences, and experiences. The questions ranged from assessing how poor his memory is and how well he enjoys reading maps and giving directions. The (see Appendix for the sample questionnaire)
A-R and R-A
Participants in the A-R group who have good sense of direction tend to make less stops, less deviations, and less off-route distances in the absolute frame of reference. It is interesting to see that three participants who assessed that they have good sense of direction made more stops, deviations, and travelled longer off-route distance. The participant who incurred a high score in the sense-of-direction scale did well in the whole experiment without making any mistake.
For the R-A group, it showed that the participant with better sense of direction tend to make more stops, more deviations, and went off the routes. Although, it was only one participant in this group that assessed himself to have a better sense of direction yet took more deviations and frequently went off the route. Also, it is interesting to find out that some participants who
48 assessed themselves having a poor sense of direction fared well in the wayfinding experiment for the absolute frame of reference.
Gender
From the correlation result, it occured that men who assessed themselves to have good sense of direction made less stops but more deviations, and walked longer distances when they went off the route. From tabular data, it shows that there are two men who rated themselves having better sense of direction but each differed in the wayfinding performance.
Women who evaluated themselves having better sense of direction made less stops, less deviations and travelled less off-route distances. It could also be observed that the participant who had poor sense of direction did well in the task for the absolute instructions.
Hence, in looking at the mean of the SOD for men and women, it shows that men had rated themselves to have better sense of direction than women. However, in correlating it with the wayfinding performance measures, they made more stops, more deviations and travelled longer off-route distances.
Sketch Mapping Activity
Different individuals have varying ways of creating sketch maps. Some will take into account the paper size so they would be able to estimate the scale of the map. Whereas, others will draw until they will lack space and then try to disregard the distance of one landmark to another landmark as well as the length of the road.
Landmarks drawn
49 overtime unlike using orientation strategy where there are fixed reference points (Lawton and Kallai, 2002). In the experiment following the absolute frame of reference, participants were paying more attention to the landmarks they saw rather than estimating the distance they have travelled. But, when drawing the sketch map, it is difficult for most people to remember all the landmarks s/he saw along the way. In Route 1, since there were ten (10) landmarks mentioned, perhaps it was quite impossible to remember all of them especially when going to four more routes before drawing the first sketch map. Only one participant was able to remember 9 out of the 10 landmarks for Route 1. Also, the participants from the R-A group drew more landmarks than A-R group where the instructions were given first in relative frame.
Men tend to draw lesser number of landmarks. As shown in the result of the sketch maps drawn by the participants, it occurred that women were able to remember and draw more landmarks. Although, there were two male participants who was able to draw a detailed sketch map.
It is also observed that some participants would draw other landmarks not indicated in the verbal instruction. Some of those they have seen while going to the starting point specifically placing the institute (IfGI) as a reference point. Also, another observation was that they would usually draw the bakery where they draw the first sketch map.
There are cases wherein most landmarks are not drawn in the correct position. Most of the time they would either overestimate or underestimate the placement in the sketch map for as long as they are in correct order such as which landmark came first. Also, there are instances when a visible landmark such as a park was not drawn in the sketch map. In terms of orientation, few participants included the north arrow sign.
Turns
Most of the participants were able to draw the correct number of turns of the route they walked. However, some turns were missed out in confusing routes such as Route 4 where the island was located. Both the A-R and the R-A groups did not perfectly draw the correct turn for this route.
50 turn going to the next goal. This is where the park was located and they had to make a little turn and walk on the right side of it.
Streets drawn
The number of streets that a participant could remember is not only referring to the turns he made but other streets he saw while going through all the routes. Similar to drawing the landmark for Route 1, almost all of the participants were not able to identify the other streets they crossed along the way. Also, with Route 4, where few of them were able to remember the pathways they crossed which were indicated in the instruction.
Streets were drawn differently by participants. Some of them drew a single line for all the street network while others created double lines to represent both major and minor roads. Participants tend to disconnect streets such as the main road they first walked where they had to turn Right-Left-Left. Most of them did not realize they just went back to the main street.
One obsevation in drawing the road is that participants tend to draw a curved road into a straight line such as the first main road they took. Few were able to discern how the street network looks like.
It is also observed that participants who deviated tend to include the streets or path he took whch are not included in the instruction.
There was no difference on the total number of streets drawn by men and women. The result showed that they missed several streets in the same routes. If there were incomplete mention of turns or segments, this might be those where such information is unnecessary due to the presence of cues in the real environment (Lovelace and Montello, 1999).
Problems Encountered
Participants
51 group of students from a mailing list given by former tutors coming from various courses in the university but, nobody responded. This was the period when most students are taking many exams already, hence, this might be one possible reason for not having time to participate. Another problem encountered was when there were participants who turned out to be familiar of the place in the middle of the experiment. Although, it was asked before the experiment was conducted whether they are familiar of the area. Hence, I looked for replacements when I encountered participants who were quite familiar to the study site already. The third problem is conflicting schedules of some participants that is why there had been negotiations with them during their free time. Also, there were instances when rescheduling of the experiment was done because participants could not make it to the assigned schedule.
Season
The experiment started in the last week of November and ended in the last week of December (days before Christmas time). In this season, the days are shorter and the nights are longer. Hence, it was taken into account the time when the experiment should start. Although, I wanted to have three or more respondents a day but, it would be dark already by the time I have my last participant. So, only two respondents a day were possible for the experiment. One in the morning (10 AM) and one in the afternoon (2 PM). The experiment would usually last for approximately 60 to 90 minutes depending on the speed of the participant. It took 17 days to finish with all 24 participants as well as some replacements. All experiment was done on weekdays except for one which was done on a weekend.
Changing weather condition
52 Table 18. Meteorological Data of the 17 Experiment Days
Day Date Mean Temp. Max. Temp Max. Wind Gust Remark
1 25-11-2009 11.0˚C 9.0˚C 13.0 m/s
2 26-11-2009 8.0˚C 6.0˚C 10.0 m/s
3 30-11-2009 6.0˚C 3.0˚C 8.0 m/s
4 01-12-2009 4.0˚C 1.0˚C 7.0 m/s
5 02-12-2009 3.0˚C 0.0˚C 7.0 m/s
6 03-12-2009 8.0˚C 5.0˚C 10.0 m/s
7 07-12-2009 6.0˚C 4.0˚C 9.0 m/s
8 08-12-2009 6.0˚C 4.0˚C 7.0 m/s
9 09-12-2009 6.0˚C 4.0˚C 8.0 m/s
10 10-12-2009 8.0˚C 7.0˚C 9.0 m/s
11 14-12-2009 -1.0˚C -1.0˚C 0.0 m/s
12 15-12-2009 -1.0˚C -3.0˚C 0.0 m/s
13 16-12-2009 -1.0˚C -3.0˚C 0.0 m/s
14 17-12-2009 -2.0˚C -4.0˚C -1.0 m/s Started snowing
15 18-12-2009 -4.0˚C -11.0˚C -2.0 m/s
16 18-12-2009 -12.0˚C -13.0˚C -1.0 m/s Coldest day of the year
17 21-12-2009 -2.0˚C -3.0˚C 0.0 m/s
Source: http://kli.uni-muenster.de/en/weather/stats/index.html
It is interesting to note that since it was quite difficult to find enough women to participate earlier, most of them were scheduled in the last days when the weather was so cold and when it started to snow. Yet, it did not affect their performance. As one female participant commented: “...it’s not the weather, but the clothes you wear.” Hence, people living in Muenster are well-prepared of such varying weather condition.
53 Photo 5. A sunny day (Day 4)
Photo 6. A rainy day (Day 8)
CHAPTER VI
CO CLUSIO
! ! " # $
% ! &# #&
! " # !
$ ' ( !
! ! ! !
! " ! ) !
!
! * + !
%,,-) ! !
. ! " / !
! 0
! ) ! !
* ! " ! #
! ! !
* !
" ! # !
! 1
! !
! 2 " ) ! "
&# ! 3 !
! 4
# !
# ! * * + ! ( " #&
! ! #
*
* "
2 " "
! ! !
! !
! !
3 5 ! "
! ! # ! " " !
! !
! * ! " ! !
* + ! ( ) !
( 2 "
! ! !
6 ! ! " ! !
! ! ! "
3 ! & " !
! ! !
7(8 6 " 99-$ 8 " 99
* ! ! " !
! 2 2 " 9--$ 4 " %,,,$ 4 !
. " %,,:$ 2 " ! ) ! " !
&
! ! " ! !
:
3 !
2 2 99- !
! ! " "
! ! 2 "
! ! # * !
# # " !
! ! ; !
" ! !
! " ! " # 3
* ! " ! !
! ! < " 999$ = 4 ! " 99 "
! ! ! !
! ! 6 " * %,, ! !
! ! ! 2 "
! " ! ! ! !
! " !
! ! ! 7(8
6 " 99- ! ! " "
* " !
" !
2 " ) !
" "
5 ! ! !
! ! "
! 3
* ! ! " &# ! !
" ! " # #&
>
5 ! ! ! ! ! !
!
! ! ! !
!
! .
# ! ! !
* ! 3 ! ! !
!
* " ! 1
4 =
7 !
* !
! ! ?
!
@ !
* ! " !
!
* ! !
#
.
REFERE CES
Gender Differences in Geographical Knowledge Sex Roles
! "# Comparing distortion on sketch maps and MDS configurations The
Professional Geographer $ %$ $ &
' ( ) *!# + , -! . # , Are cognitive sex differences disappearing? Evidence from Spanish populations Personality and Individual Differences/ 0
. , 1# 2 ( & The Hunter"gatherer theory of spatial sex differences: Proximate factors mediating the female advantage in recall of object arrays Ethology and Sociobiology
3 + ) 3 4 !+5 1 Survey versus Route"Based Wayfinding in Unfamiliar
Environments. 6# + 7' ' & # $ 3 ' " 8
7 #2 # " ' #" # # '
3 + ) 3 3 + # - 4 5 1 Spatial Knowledge Aquisition by Children: Route learning and relational distances Annals of the Association of American Geographers / 0 $ &&
9 # + ' 1 9 # + 4 9 Acquisition of Route .etwork Knowledge by Males and Females The Journal of General Psychology &
9: 85 ' : ( , Capturing Indoor Wayfinding Strategies and Differences in Spatial
Knowledge with Space Syntax 8 # + 5 # 1 8 1 ; 1 ( #!( <!
9! ,# #6 - Getting from here to there: Spatial Anxiety, Wayfinding Strategies, Direction Type, and Wayfinding Efficiency Spatial Cognition and Computation. /$0
5#6 = ># ( , Turn to the Left or to the West: Verbal .avigational Directions in Relative and Absolute Frames of Reference - ' 2 /. 0 3 18# 8 ? '1
$ 1 # + + # 9 # < +
5#6 = @!A#= 9 ( # B B6 < Wayfinding with a GPS"based mobile navigation system: A comparison with maps and direct experience Journal of Environmental
Psychology/ 0 &
>#( ? 1 ? - Gender Differences in Spatial .avigation World Academy of Science, Engineering and Technology$
># 8 > ' Age Differences in adults’ spatial abilities, learning environmental layout, and wayfinding behavior Spatial Cognition and Computation $
85# # 1 +# )!++# 3 3 # 8# Gender differences in object location memory in a real three"dimensional environment Brain and Cognition
? = ' & Gender Differences in Way"finding Strategies: Relationship to Spatial Ability and Spatial Anxiety Sex Roles $
? = ' Gender and Regional Differences in Spatial Referents used in Direction giving.
Sex Roles && $ $$
? = ' '5 1 C# . Individual" and Gender"related differences in indoor wayfinding Environment and Behaviour &
? 2# 1 ' Language and Space Annual Reviews on Anthropology $ $ $
? 2 8 > ? 9 + , , 4 Elements of Good Route Directions in Familiar and Unfamiliar Environments ' @ 6 4 , /. 0% 'B1 D ? '1
, E 9 , Sketch maps: Helping students get the big picture Journal of Geography %$ &
,# ' ) 3 Spatial frames of reference used in identifying direction of movement:
An unexpected turn 4 ) , /. 0% 'B1 ? '1
, 4 ? 2 8 > 3 + ) 1 " ' Sex"related differences and similiraties in Geographic and Environmental Spatial Abilities Annals of Association of American Geographers
/$0 $&
BD? !+5 # . B !< 6 1 Use of Landmarks in Cognitive Mapping: Gender Differences in Self Report versus Performance Person,Individual Difference &
) !< , Structuring wayfinding tasks with image schemata , 5 # 3 ! 185 " 7 #2 # " , # 1 # " ( # 18# 8 . +# # +
5 % === + + !8 < ! F !< ? 88 -!
) !< , .+ 5 " , Comparing the complexity of wayfinding tasks in built
environments.Environment and Planning B / 0 $
) !< , # 1 Enriching Wayfinding Instructions with Local Landmarks , -.+ 5 " , 6 4 , /. 0 GIScience ? '1 & &$
) 2 # 85 1!+#( , SketchMap: Supporting Children in drawing ‘Personal Environental Maps’ Joho Shori Gakkai Shinpojiumu Ronbunshu Vol. G o.&G pp. $ &
1 ( - > !"( - 9! 1 . Males and Females use different distal cues in a virtual environment navigation task Cognitive Brain Research/ 0 $ $
185(# E 1 Gender"related strategies in environmental development: Effects of anxiety on wayfinding in and representation of a three"dimensional maze Journal of Environmental Psychology
1# 2 ( '5 # - .on"Euclidean .avigational Strategies of Women: Compensatory Response or Evolved Dimorphism?Evolutionary Psychology & &
1# 2 ( '5 # - , The Hunter"Gatherer Theory of Sex Differences in Spatial Abilities: Data from 40 countries Arch Sex Behav/$ 0
1A: # , Individual Differences in Spatial Cognition and hypermedia navigation '5 .; # + 2#+ #
1 8 H! - - @ + - , 5( - Women match men when learning a spatial skill.
Journal of Experimental Psychology: Learning, Memory, and Cognition. $ &
$
__________. Sta. Barbara Sense of Direction Scale.
5 % === 85 !8 < ! F5 + # !( < " ? 88 1 (<
1 ? # 4 # =#8E 1 How to tell people where to go: Comparing navigational aids International Journal Man/Machine Studies &
1!+#( , ) 2 # . A A# 9 16 85, % A System for Supporting Outdoor Collaborative Learning by Enhancing and Sharing Learner’s Experiences
5 % ( 5# 5#( 85 ''. " ? 88 2 (<
6 ) Using field sketch mapping to teach basic mapping concepts in elementary school
Geography Journal of Geogr 5 %$ $
85 # # 3 9: 85 ' , # # + Building Analysis from a Spatial Cognition Perspective.
5 % === 8 ; ! " ( # $ " ? 88 4 8 (<
4 ? (# - , 3 + ) 3 1 ' Place learning in humans: The role of distance and direction information.Spatial Cognition and Computation & $$$ $ &
1 ? =8 (< B2 @ Turn Left at the Church, or Three Miles .orth: A Study of Direction Giving and Sex Differences. Environment and Behavior % $
# . # < 5 , . $ Sex Differences in cognitive functions Personality and Individual
Differences $ $
# - , I85 1 - 9: 85 ' Taxonomy of Human Wayfinding Tasks: A Knowledege"based Approach. Spatial Cognition and Computation
# > 9 Assessing Geographic Knowledge with Sketch Maps Journal of
Route Verbal Instructions (English and German Language)
Route 1
Absolute:
Walk straight to ESE for 400 meters. You see a block of houses to the north and to the south of the street. You see a restaurant and a hair salon to the north. You see a bakery with an automobile shop beside it to the south. You see a traffic light. You see a park to the north. After the park, you see a kiosk. When you hit an intersection, you see the bakery located ESE. You see a Teleport telephone booth [goal] to the east.
Gehen Sie 400 Meter geradeaus in Richtung OSO. Sie sehen Häuserblocks im Norden und Süden der Straße. Im Norden sehen Sie ein Restaurant und einen Friseur. In Richtung SSO sehen Sie eine Bäckerei neben einem Geschäft für Modellautos. Sie sehen eine Ampel und einen Park in Richtung Norden. Nach dem Park sehen Sie einen Kiosk. Wenn Sie an einer Straßenkreuzung angekommen sind, sehen Sie eine Bäckerei im OSO und eine Telefonzelle [Ziel] im Osten.
Relative:
Walk straight ahead. You see a block of houses on both sides of the street. You see a restaurant and a hair salon to your left. You see a bakery with an automobile shop beside it to your right. Then, you see a traffic light. You see a park to your left. After the park, you see a kiosk. When you hit an intersection, you see a bakery located in the corner of the other side of the street. You see a Teleport telephone booth [goal] to your left.
Laufen Sie geradeaus. Sie sehen Häuserblocks auf beiden Seiten der Straße. Zu Ihrer Linken sehen Sie ein Restaurant und einen Friseur. Zu Ihrer Rechten sehen Sie eine Bäckerei neben einem Geschäft für Modellautos. Danach sehen Sie eine Ampel und zu Ihrer Linken einen Park. Nach dem Park sehen Sie einen Kiosk. Wenn Sie an einer Straßenkreuzung angekommen sind, sehen Sie eine Bäckerei an der Ecke auf der anderen Straßenseite und eine Telefonzelle [Ziel] zu Ihrer Linken.
Route 2
Absolute:
Turn to the south and cross the street. Walk straight for 62 meters. Turn to the ENE when you hit a shared pathway for bicycle and pedestrian. Walk for 220 meters. You pass through a residential area where you see a white building to the north. You pass by an open space to the south. You see a parking space of a restaurant to the south. When you hit a north-south running road, you see a pharmacy [goal] to the north and a restaurant to the south.