Evaluation of raw soapstone (steatite) as adsorbent of trace elements
present in Brazilian spirits
Karine Aparecida Louvera Silva
a, Isabela da Costa Fernandes
a, Eduardo Bearzoti
b,
Raquel Fernanda Milani
c, Marcelo Antonio Morgano
c, Kesia Diego Quintaes
a,⇑ aOuro Preto Federal University (UFOP), Nutrition School (ENUT), Campus Morro do Cruzeiro, s/n, Ouro Preto, MG 35400-000, Brazil bOuro Preto Federal University (UFOP), Statistic Department (DEEST), Campus Morro do Cruzeiro, s/n, Ouro Preto, MG 35400-000, Brazil cInstitute of Food Technology (ITAL), Av. Brasil, 2880, Campinas, SP 13070-178, Brazila r t i c l e
i n f o
Article history:
Received 17 September 2015
Received in revised form 27 December 2015 Accepted 6 January 2016
Available online 7 January 2016
Keywords:
Inorganic contaminants Alcoholic beverages Lead
Nickel Copper
Mineral migration
a b s t r a c t
The impact of soapstone (steatite) upon inorganic element contaminant concentrations in alcoholic bev-erages was investigated. Concentrations of As, Cd, Cu, Ni and Pb levels in 8 Brazilian spirits plus an alco-holic simulant were initially measured, and then measured following each 24 h cycle of exposure to raw soapstone cups, for a total of 4 cycles/sample. The results were compared to the levels established by Brazilian and German regulations. The contact between the spirits and the soapstone reduced the Cu con-tent by up to 50.4% and increased the Ni concon-tent by up to 622.2%, especially in the first contact cycle. The exposure of spirits to the soapstone exhibits a linear reduction in the Pb content (18.3–54.5%) while As and Cd levels remained unaltered throughout the experiments. In conclusion, crude soapstone in contact with alcoholic solutions acts as an adsorbent of trace elements (Cu and Pb) while releasing Ni.
Ó2016 Elsevier Ltd. All rights reserved.
1. Introduction
Spirits are one of the most widely produced alcoholic beverages worldwide. In 2009 the global revenue of spirits was 94.31 billion U.S. dollars, and in 2015 the projected revenue of the global spirits industry is estimated to be about 113.78 billion U.S. dollars (Statista, 2015). Despite the fact that almost a quarter (24.8%) of all alcohol consumed worldwide is in the form of unrecorded alco-hol, of the recorded alcohol consumption, more than half is con-sumed in the form of spirits (50.1%), followed by beer (34.8%) and wine (8.0%) (WHO, 2014).
In 2014 Brazil exported cane spirit to 66 countries, with a rev-enue of US$18.33 million for the sale of 10.18 million liters. In terms of value, the main countries of destiny were: Germany, USA, France, Portugal, Paraguay and Italy, and in terms of volume the main countries of destiny were: Germany, Paraguay, Portugal, USA, France and Bolivia (IBRAC, 2014).
Cane spirit is obtained by distilling the fermented must of sug-arcane juice and has some particular sensory characteristics, an alcohol degree of from 38% to 48% by volume at 20°C, and can have
added sugars of up to 6 g L 1(Ministry of Agriculture, Livestock
and Supply, 2005). It can be divided into its organic and inorganic fractions, the latter being constituted principally of metal and non-metal ions such as aluminum (Al), arsenic (As), cadmium (Cd), cal-cium (Ca), lead (Pb), cobalt (Co), copper (Cu), chromium (Cr), iron (Fe) and nickel (Ni), amongst others (Siebalde, Canuto, Lima, & Silva, 2002).
As, Cu and Pb contents above the levels permitted by Brazilian legislation were observed in cane spirits from the State of São Paulo, Brazil (Caldas, Raposo, Gomes Neto, & Barbosa, 2009). In the State of Minas Gerais, Brazil, responsible for 44% of the Brazil-ian production (CEPA, 2008), it was found that 25% of the cane spir-its produced in stills in the south of the state showed Cu contents above the level permitted by the legislation (Fernandes et al., 2007). Cane spirits coming from the Iron Quadrangle in Minas Ger-ais (QFMG), a region with many steatite deposits were also shown to contain Cu above the legal limits (Fernandes et al., 2013).
Evidence of the contamination of alcoholic beverages by metals has been found throughout the world. Researchers have reported that the quality control of the Greek beverageMouromay be defi-cient as a function of variation in the Pb content (Soufleros,
http://dx.doi.org/10.1016/j.foodchem.2016.01.020 0308-8146/Ó2016 Elsevier Ltd. All rights reserved.
⇑ Corresponding author at: Ouro Preto Federal University (UFOP), Nutrition School (DENCS-ENUT), Campus Morro do Cruzeiro, s/n, Ouro Preto, MG 35400-000, Brazil.
E-mail addresses:[email protected](K.A. Louvera Silva),isabela0107@ gmail.com (I. da Costa Fernandes), [email protected] (E. Bearzoti), [email protected](R.F. Milani),[email protected](M.A. Morgano), [email protected],[email protected](K.D. Quintaes).
Contents lists available atScienceDirect
Food Chemistry
Mygdalia, & Natskoulis, 2004), and wine commercialized in Hun-gary has shown elevated contents of Cu (20–640
l
g L 1), Pb (6–90
l
g L 1) and Cd (0.05–16.5l
g L 1), the amplitude of the valuesbeing explained by the diversity in origin of the beverage and also by the effect of additives and the equipment used in production (Ajtony et al., 2008). The raw materials, substances intentionally added, type of process and storage are also factors interfering in the metal contents of alcoholic beverages (Ibanez, Carreon-Alvarez, Barcena-Soto, & Casillas, 2008).
Despite the fact that alcoholic beverages have been classified as carcinogenic to humans, levels of inorganic elements such as lead or arsenic could further increase their carcinogenic potential (Lachenmeier, Przybylski, & Rehm, 2012) Hence, the removal of inorganic contaminants from alcoholic beverages in order to con-form to legal parameters, and reduce health risks to the consumer, is important.
A recent study provided evidence that the alcohol content of cane spirit and the time of exposure to steatite could influence the transference of inorganic contaminants (Fernandes et al., 2013). Nevertheless the interference of soapstone in the content of contaminants present in alcoholic beverages still needs to be better investigated. Thus the objective of this study was to evaluate the behavior of the inorganic contaminants (As, Cd, Cu, Ni and Pb) present in commercial Brazilian cane spirits when submitted to contactin naturawith soapstone cups, and evaluate if the amounts found before and after four 24-h cycles of exposure to steatite con-formed with the maximum limits established by the Brazilian and German legislations (Ministry of Health, 1965, 2005; BGBl, 2002).
2. Material and methods
Eight distinct brands of cane spirit acquired on the market in Belo Horizonte and Ouro Preto (MG, Brazil) were studied. The selection criteria for the beverages integrating this study consid-ered those produced in the QFMG region and registconsid-ered in the Min-istry of Agriculture (MAPA). In addition to the cane spirits, a simulated alcoholic beverage was also included in the experiment, produced using a 43% (v v 1) ethyl alcohol solution (Merck,
Darm-stadt, Germany) diluted with deionized water (18.2 MX). This additional treatment was carried out with the objective of evaluat-ing the effect of the exposure of ethyl alcoholin naturato the stea-tite cups.
In parallel, twenty seven new soapstone cups, each with a vol-umetric capacity of approximately 20 mL, derived from the district of Cachoeira do Brumado (Mariana, MG, Brazil), were evaluated. All the cups were washed with potable water using a soft new poly-meric sponge and a dilute solution of a commercial detergent, fol-lowed by rinsing with potable water and distilled water. They were dried in an incubator at 150°C for 10 min. The cups were divided
into groups of 3 units, giving a total of 9 groups.
The As, Cd, Cu, Ni and Pb contents were determined in the eight brands of cane spirit and in the ethyl alcohol solution before and after contact with the soapstone cups. A part of each of the cane spirits and the ethyl alcohol solution was poured into a group of three new, clean soapstone cups to 2/3 of their capacity (approxi-mately 14 mL). They were then covered with a watch glass and maintained at a constant temperature and under artificial light, in order to prevent any external interference.
Aliquots of each cane spirit and of the ethyl alcohol were removed after 24 h of contact (1 cycle), and four sequential cycles (24 h each) were carried out. Between each cycle the cups were washed and dried as mentioned above. Samples were removed after each cycle for the chemical analyses using a sterile pipette, without any abrasion of the surface of the cup or loss of the con-tents. The homogenized samples were placed in previously
decon-taminated glass beakers. The cycle times used were based on Fernandes et al. (2013)and also the fact that many soapstone con-tainers are intended for long term exposure to alcoholic beverages (i.e. pots, barrels, flasks).
The concentrations of the elements As, Cd, Cu, Ni and Pb were determined in each aliquot and also in duplicate blanks prepared in decontaminated glass beakers using the same volumes of liquid adopted for the sandstone cups. For each element the final concen-trations were obtained by deducting the contents found in the blanks from the contents found in the aliquots.
2.1. Determination of the inorganic contaminants
For the determinations of As, Cd, Cu, Ni and Pb, 5 mL aliquots of the cane spirit samples and of the simulant were transferred to sterile glass flasks and their volume reduced by half on a digestion block at 80°C. A volume of 1.25 mL of 65% nitric acid was then
added and heated at 95°C for 2 h. After cooling the solution was
quantitatively transferred to a 25 mL volumetric flask and com-pleted to volume with a 5% (v v 1) nitric acid solution, prepared
from concentrated 65% nitric acid (Merck, Darmstadt, Germany) and diluted with deionized water (18.2 MX) (Fernandes et al., 2013; López-Artíguez, Cameán, & Repetto, 1996).
Analytical curves were constructed as from standard 1000 mg L 1solutions of As, Cd, Cu, Ni and Pb (Merck, Darmstadt,
Germany) in the interval from 0.005 to 1.0 mg L 1for As, Cd, Pb
and Ni and from 0.025 to 25 mg L 1for Cu.
2.2. Equipment and operational conditions
The contents of the elements under investigation were analyzed by means of emission spectrometry in duplicate, by direct aspira-tion from the cane spirit samples and simulant, mineralized with nitric acid. The equipment used was an emission spectrometer with a plasma source and inductive coupling (ICP OES) (Vista MPX Varian, Mulgrave, Australia), with axial vision and equipped with a 40 MHz radio frequency source (RF), a charged coupled device (CCD) solid state simultaneous multi-element detector, a peristaltic pump, nebulization chamber and sea spray nebulizer. The system was controlled by the ICP Expert software and used 99.996% pure liquid argon (Air Liquid, SP, Brazil) as the plasma gas. The optimized experimental conditions for operation of the equipment were: RF power (1000 W); nebulization gas flow rate (0.9 L min 1); principal argon flow rate (15 L min 1); auxiliary
argon flow rate (1.5 L min 1); background correction (2 points);
integration and reading times (10 s); number of replicates (3); torch configuration (axial) and wavelengths, As (188.980 nm), Cd (214.439 nm), Cu (324.754 nm), Pb (220.353 nm) and Ni (221.648 nm).
2.3. Evaluation of inorganic contaminants
The contents of the inorganic contaminants detected in the cane spirit samples and simulant were evaluated with respect to the maximum levels established by the Brazilian legislation for cane spirit and by the German legislation for wines, since Germany is the main destination for cane spirits produced in Brazil (IBRAC, 2014). The maximum limits in alcoholic beverages for the inor-ganic contaminants under study, as established by the Brazilian and German legislations are: Cu (5.0 mg L 1 and 2.0 mg L 1); As
(0.100 mg L 1), Cd (0.020 mg L 1 and 0.010 mg L 1); Pb
(0.200 mg L 1 and 0.250 mg L 1), respectively (BGBl, 2002;
Ministry of Agriculture, Livestock and Supply, 2005).
legislation and there was no limit for this element in the German legislation (BGBl, 2002; Ministry of Health, 1965).
2.4. Analytical quality
The analytical method was validated according to the norms of the Brazilian National Metrology, Normalization and Industrial Quality Institute (INMETRO, 2011) evaluating the following param-eters: linearity, sensitivity, (limit of detection – LOD), selectivity, accuracy and precision (repeatability and reproducibility). For pre-cision evaluation, the coefficient of variation was determined using a spiked blank (ethanol solution). For repeatability, seven repli-cates were measured in one day (n= 7) and for reproducibility, seven replicates were measure in two distinct days by the same analyst (n= 14). The accuracy of the method was verified by recov-ery trials, with the addition of a standard solution of the metals in blank solution (ethanol) at the following concentration levels: low (0.05 mg L 1), medium (0.30 mg L 1) and high (0.75 mg L 1). For
Cu the same spike levels were used as for the other elements, but at a higher level (5 mg L 1).
2.5. Statistical analysis
The experiment installed corresponded to a completely random design (Hinkelmann & Kempthorne, 2008), with nine treatments (8 cane spirits and one simulant) and three repetitions. The repeti-tions, or experimental units, corresponded to thein natura soap-stone cups in which the cane spirits and the simulant were evaluated.
The concentrations of each element were fitted to a split plot design model (Hinkelmann & Kempthorne, 2008), with the partic-ularity that the plots in question (in naturasoapstone cups) were split according to time and not space. Since cycles cannot be ran-domized, three possible structures of residual covariance were considered: (i) independent residuals; (ii) compound symmetry and (iii) autoregressive order 1 (Littell, Milliken, Stroup, & Wolfinger, 1996). The structure of compound symmetry implies that the covariance between two measurements made on the same experimental unit is homogenous, independent of the distance in time, and this corresponds to the classical model of a split plot design in space. These three covariance structures were compared using the Akaike Information Criterion (AIC), the Bayesian Informa-tion Criterion (BIC) and the likelihood ratio test (the latter, when applicable).
When there were significant differences (P< 0.05) between the cane spirit brands, their means were grouped using the Scott-Knott cluster analysis method (Scott & Knott, 1974), and when there were significant differences between the evaluation cycles, regres-sion models were fitted. The data were analyzed using R (R Core Team., 2013) and Sisvar (Ferreira, 2011) software environments.
3. Results and discussion
3.1. Analytical quality results
The method validation was performed according toINMETRO (2011) guidelines. In previous work by our group (Fernandes et al., 2013) the method validation was discussed in detail. Briefly, the figures of merit were successfully evaluated and the proposed method provides a high sensitivity response for all contaminants. No spectral interferences in selected wavelengths were observed and analytical curves provided r > 0.999. The limits of detection (LOD = 3s, being s= standard deviation of 10 analytical blanks) were below 0.003 mg L 1for all contaminants, except for arsenic
(0.006 mg L 1).
The accuracy evaluation was verified by using an analytical blank spiked at three levels: 0.05 mg L 1; 0.30 mg L 1 and
0.75 mg L 1, and four levels for Cu: 0.05 mg L 1; 0.30 mg L 1;
0.75 mg L 1 and 5 mg L 1. Recoveries ranged between 97% and
118% for all elements. For precision assessment, the repeatability and reproducibility provided reliable results. Low values of coeffi-cient of variation were for observed for all elements, being below 4% and 7%. For all expositions, the method was considered appro-priate for the evaluation of the inorganic contaminants content in Brazilian spirits storage in raw soapstone cups.
3.2. Contents of the inorganic elements
Table 1shows the concentrations of the inorganic contaminants found in the eight cane spirits and the ethyl alcohol, and also the locations of origin and the respective alcohol contents as stated on the label of each product.
All the alcoholic beverages showed variations in the levels of concentration of all the elements investigated, which were all below the maximum values stipulated by current Brazilian legisla-tion: As 0.025 (0.011–0.085) mg L 1, Cd 0.003 (0.003–0.004)
mg L 1, Cu 2.982 (1.113–4.598) mg L 1, Ni 0.01 (0.003–0.020)
mg L 1and Pb 0.024 (0.006–0.074) mg L 1. Such variation in the
contents of the elements could be attributed to the origin and com-position of the distinct beverages used in the present study.
Lachenmeier et al., 2012reported the maximum levels of As and Pb in recorded spirits as being 0.000027 and 0.006 mg L 1,
respec-tively. With respect to Cd, the mean values found in the cane spirit samples investigated in the present study (0.003–0.004 mg L 1)
were similar to the mean concentrations (0.003 mg L 1) found in
white, rosé and red wine samples consumed in Spain (Mena, Cabrera, Lorenzo, & López, 1995).Lachenmeier et al., 2012 identi-fied the average and maximum levels of Cd in recorded spirits as 0.000006 and 0.0004 mg L 1respectively, values that exceed those
found in beers and wines. The calculation of the margin of expo-sure (MOE) in different drinking scenarios for recorded spirits, beers and wine demonstrate that spirits can be more carcinogenic than the other beverages.
In all, the results found in the present study were contrary to those found in other studies carried out with cane spirits from the State of Minas Gerais, Brazil, which showed Cu contents exceeded the maximum permitted level (5 mg L 1) by percentages
varying from 19% to 25% (Fernandes et al., 2007; Ibanez et al., 2008).
With respect to the adequacy of these elements to the German legislation (BGBl, 2002), it was observed that the values were below the maximum permitted levels with the exception of Cu, which was found at inappropriate levels in five (62.5%) of the eight brands of cane spirit studied. Of these beverages, brands C, D, F, G and H exceeded the legal limit (2 mg L 1) by 97.2; 120.5; 122.2;
129.9 and 6.6%, respectively. Nascimento et al. (1999) reported the Cu content of cane spirits from various regions in Brazil, vary-ing from traces to 14.3 mg L 1, with mean values of 1.67 (0.270–
3.76) mg L 1; 4.40 (ND–14.0) mg L 1and 5.01 (0.34–14.3) mg L 1
according to the category of the sample: export market, national market and small-scale (homebrew) market, respectively. For export category alcoholic beverages, these authors reported mean values of 1.64 (ND–4.59) mg L 1.
3.3. Contents of the elements in the soapstone exposure trial
measurements of the experiment, only five differed from this value, corresponding to a single repetition of each of the following combinations: that from cane spirit B with 1 exposure cycle (0.004 mg L 1), that from cane spirit C with 1 exposure cycle
(0.005 mg L 1), that from cane spirit G with 1 exposure
cycle (0.005 mg L 1), and that from cane spirit F with 2 exposure cycles (0.004 mg L 1).
For the other contaminants, the likelihood ratio test showed significant residual dependence for the elements Cu and Ni. This dependence was not significant for the elements As and Pb and hence these data were fitted to a model with a treatment factorial structure. Although there was significant residual dependence for the elements Cu and Ni, it was noted that the compound symmetry and autoregressive structures led to model fittings with very close values of AIC, BIC and the logarithm of the likelihood function. This showed there was no need to consider an autoregressive covari-ance structure, and thus the classic approach of a split plot design in space was adopted.
Table 2shows theFstatistics of the Analysis of Variance and theirP-values. For the element As, none of the sources of variation – treatments, exposure cycles and interaction between them – were significant. The mean concentration of this contaminant was equal to 0.037 mg L 1.
For the Pb content, there were significant differences (P= 0.010) only between exposure cycles (Table 2). Both the cane spirit brands and the interaction between the brands and the exposure cycles presented elevatedP-values (0.805 and 0.837). This suggests that a single regression model could describe the variation in the Pb concentration as a function of the soapstone exposure cycle. The use of a simple linear regression model indicated a constant fall in the Pb concentration as the exposure cycles proceeded (Fig. 1), representing an adsorption of the contaminant as a function of the exposure cycles.
Although the cane spirits and simulant showed non-toxic con-tents of Pb both before and after contact with soapstone, which is normally free of this element, other authors have reported the contamination with Pb of alcoholic beverages such as liquor, cog-nac and whisky (Camean, Moreno, López-Artiquez, Repetto, & Gonzalez, 2001; Rodushkin, Odman, & Appelblad, 1999; Vilaykumar & Ashwini, 2001).
There was a significant difference between the cane spirit brands with respect to Ni and also between the exposure cycles (Table 2). Although the interaction between the cane spirits and exposure cycles was not significant at a significance level of 5%, the cane spirit brands were statistically different with 1 and 2 exposure cycles. These differences became insignificant as from the third exposure cycle to soapstone. This aspect can be seen in Table 3, which presents the clustering of cane spirit means using the Scott-Knott method in each exposure cycle.
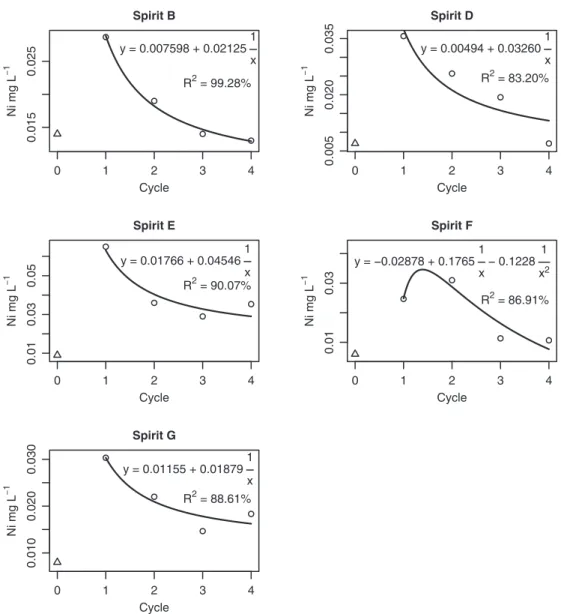
The interaction between the cane spirits and exposure cycles was also sliced by brand of cane spirit, fitting distinct regression models for each one, with the Ni concentration as a function of the cycle of exposure to the soapstone cups (Fig. 2). In such models, the independent variable corresponded to the inverse of the num-ber of cycles, chosen to make satisfactory fits possible. The con-stant term of such models can be interpreted as the value around which the Ni concentration tends to stabilize. For example this concentration was around 0.0076 mg L 1for brand B. For brand F
a parameter referring to the square of this variable had to be included, in order to prevent significant variation due to lack of Table 1
Origin, labeled alcohol content (%) and mean concentration and standard derivation (mg L 1) of inorganic contaminants in Brazilian spirits.
Spirits code City of origin (MG State) Alcohol content (%) Mean concentration and standard derivation (mg L1)
As Cd Cu Ni Pb
A Santa Bárbara 43.5 0.036 ± 0.001 0.004 ± 0.001 1.309 ± 000.1 0.012 ± 0.005 0.015 ± 0.001
B Itabirito 41.0 0.011 ± 0.000 0.003 ± 0.000 1.906 ± 0.008 0.014 ± 0.000 0.006 ± 0.000
C Brumadinho 43.0 0.011 ± 0.000 0.003 ± 0.000 3.945 ± 0.006 0.020 ± 0.003 0.074 ± 0.009
D Sabará 42.0 0.085 ± 0.000 0.003 ± 0.000 4.410 ± 0.006 0.007 ± 0.000 0.037 ± 0.001
E Belo Vale 44.0 0.028 ± 0.004 0.003 ± 0.000 1.113 ± 0.003 0.009 ± 0.001 0.023 ± 0.001
F Belo Horizonte 40.0 0.011 ± 0.000 0.003 ± 0.000 4.444 ± 0.005 0.006 ± 0.001 0.029 ± 0.001
G Ouro Preto 46.0 0.011 ± 0.000 0.004 ± 0.001 4.598 ± 0.001 0.008 ± 0.001 0.006 ± 0.000
H Congonhas 45.0 0.011 ± 0.000 0.003 ± 0.000 2.133 ± 0.006 0.003 ± 0.000 0.006 ± 0.000
Table 2
F-statistics of the analyses of variance.
Source of variation NDFa As Pb Ni Cu
F DDFb P-value F DDFb P-value F DDFb P-value F DDFb P-value
Spirits (S) 8 0.64 72 0.744 0.56 72 0.805 4.09 18 0.006 445.84 18 <0.001
Cycles (C) 3 0.53 72 0.661 4.05 72 0.010 12.79 54 <0.001 486.52 54 <0.001
SC 24 0.88 72 0.631 0.7 72 0.837 1.48 54 0.118 33.58 54 <0.001
aNumerator degrees of freedom. b Denominator degrees of freedom.
0
1
2
3
4
0.000
0.010
0.020
Spirit Mean Response
Cycle
Pb mg
L
1
y = 0.02270 0.003430 x
R
2=71.19%
(0.022)(0.018) (0.019)
(0.009) (0.010)
Fig. 1.Regression model of the concentration of Pb (mg L1) as a function of
Table 3
Concentration of Ni and Cu (mg L1) in Brazilian spirits (A–H) and in an alcohol beverage simulant (I), before and after 4 cycles of exposure to raw soapstone cups.a
Spirits code
Ni concentration (mg L1) Cu concentration (mg L 1)
Initial 1st cycle 2st cycle 3st cycle 4st cycle Initial 1st cycle 2st cycle 3st cycle 4st cycle
A 0.012 0.012 a (0.0%) 0.005 a ( 58.3%) 0.005 a ( 58.3%) 0.014 a (16.7%)
1.309 0.834 a ( 36.3%) 1.074 b ( 18.0%) 1.093 a ( 16.5%) 1.126 a ( 14.0%)
B 0.014 0.029 b
(107.1%) 0.019 b (35.7%) 0.014 a (0.0%) 0.013 a ( 7.1%)
1.906 1.212 b ( 36.4%) 1.420 c ( 25.5%) 1.389 b ( 27.1%) 1.430 b ( 25.0%) C 0.020 0.009 a
( 55.0%) 0.011 a ( 45.0%) 0.006 a ( 70.0%) 0.007 a ( 65.0%)
3.945 2.275 c ( 42.3%) 3.031 d ( 23.2%) 3.339 d ( 15.4%) 3.365 d ( 14.7%)
D 0.007 0.036 b
(414.3%) 0.026 b (271.4%) 0.019 a (171.4%) 0.007 a (0.0%)
4.410 2.826 d ( 35.9%) 3.571 e ( 19.0%) 3.985 e ( 9.6%) 4.062 e ( 7.9%) E 0.009 0.065 c
(622.2%) 0.036 b (300.0%) 0.029 a (222.2%) 0.035 a (288.9%)
1.113 0.695 a ( 37.6%) 0.827 a ( 25.7%) 0.923 a ( 17.1%) 0.939 a ( 15.6%)
F 0.006 0.025 b
(316.7%) 0.031 b (416.7%) 0.011 a (83.3%) 0.011 a (83.3%)
4.444 2.745 d ( 38.2%) 3.642 e ( 18.0%) 3.985 e ( 10.3%) 4.065 e ( 8.5%)
G 0.008 0.030 b
(275.0%) 0.022 b (175.0%) 0.015 a (87.5%) 0.018 a (125.0%)
4.598 3.942 e ( 14.3%) 4.218 f ( 8.3%) 4.503 f ( 2.1%) 4.597 f (0.0%) H 0.003 0.016 a
(433.3%) 0.007 a (133.3%) 0.006 a (100.0%) 0.003 a (0.0%)
2.133 1.058 b ( 50.4%) 1.511 c ( 29.2%) 1.732 c ( 18.8%) 1.764 c ( 17.3%) I 0.003 0.009 a
(200.0%)
0.003 a (0.0%) 0.006 a (100.0%)
0.004 a (33.3%)
0.086 0.112 a (30.2%) 0.086 a (0.0%) 0.086 a (0.0%) 0.086 a (0.0%)
a Values in brackets represent the percentage difference between the observed in the cycle and the initial content of each element in its respective solution. For the same element, means followed by the same letter are statistically similar according to the method of Scott-Knott at 5% probability.
0 1 2 3 4
0.015
0.025
Spirit B
Cycle
Ni mg L
1
y = 0.007598 + 0.02125 1 x
R2 = 99.28%
0 1 2 3 4
0.005
0.020
0.035
Spirit D
Cycle
Ni mg L
1
y = 0.00494 + 0.03260 1 x R2 = 83.20%
0 1 2 3 4
0.01
0.03
0.05
Spirit E
Cycle
Ni mg L
1
y = 0.01766 + 0.04546 1 x R2 = 90.07%
0 1 2 3 4
0.01
0.03
Spirit F
Cycle
Ni mg L
1
y = 0.02878 + 0.1765 1
x 0.1228 1
x2
R2 = 86.91%
0 1 2 3 4
0.010
0.020
0.030
Spirit G
Cycle
Ni mg L
1
y = 0.01155 + 0.01879 1 x R2 = 88.61%
Fig. 2.Regression models of the concentration of Ni (mg L 1) as a function of exposure cycles to raw soapstone cups, in 5 Brazilian spirits. Triangles represent Ni
concentrations before contact with soapstone.
fit to the regression model. The estimate of the constant term for this brand was negative, but not significantly different from zero.
The cane spirit brands A and C did not present significant differ-ences between the exposure cycles. The other brands showed a general tendency for the Ni content to reduce with increase in the number of cycles, although initially contact with the soapstone caused an increase in the content of this contaminant, which can be observed from the position of the points corresponding to the initial values (Fig. 2).
As compared to other transition metals, Ni is a relatively toxic element in high concentrations (Cempel & Nikel, 2006), and the presence of such high levels can cause a skin disease known as ‘‘nickel-eczema” (Cristensen, Kristiansen, Nielsen, Menne, & Byrialsen, 1999). Nickel can be used as an alloying metal in stain-less steel, a material widely employed in the processing and stor-age of foods and beverstor-ages (Dugo, La Pera, Lo Turco, Di Bella, & Salvo, 2004), and may therefore be the main non-intentional vehi-cle of Ni contamination in these products (Cempel & Nikel, 2006).
0 1 2 3 4
0.8
1.0
1.2
Spirit A
Cycle
Cu mg L
1 y = 1.2357 0.3919
1
x R2 = 97.02%
0 1 2 3 4
1.2
1.4
1.6
1.8
Spirit B
Cycle
Cu mg L
1
y = 1.5118 0.2861 1 x R2 = 88.44%
0 1 2 3 4
2.5
3.0
3.5
4.0
Spirit C
Cycle
Cu mg L
1
y = 3.7883 1.5085 1 x R2 = 99.35%
0 1 2 3 4
3.0
3.5
4.0
4.5
Spirit D
Cycle
Cu mg L
1
y = 4.4841 1.6767 1 x R2 = 99.01%
0 1 2 3 4
0.7
0.8
0.9
1.0
1.1
Spirit E
Cycle
Cu mg L
1 y = 1.0174 0.3294
1
x R2 = 97.43%
0 1 2 3 4
3.0
3.5
4.0
4.5
Spirit F
Cycle
Cu mg L
1
y = 4.5460 1.7982 1 x R2 = 99.77%
0 1 2 3 4
3.9
4.1
4.3
4.5
Spirit G
Cycle
Cu mg L
1 y = 5.1582 2.4846
1
x + 1.26761
x2
R2 = 99.38%
0 1 2 3 4
1.0
1.4
1.8
2.2
Spirit H
Cycle
Cu mg
L
1 y = 2.0190 0.9657
1
x R2 = 99.34%
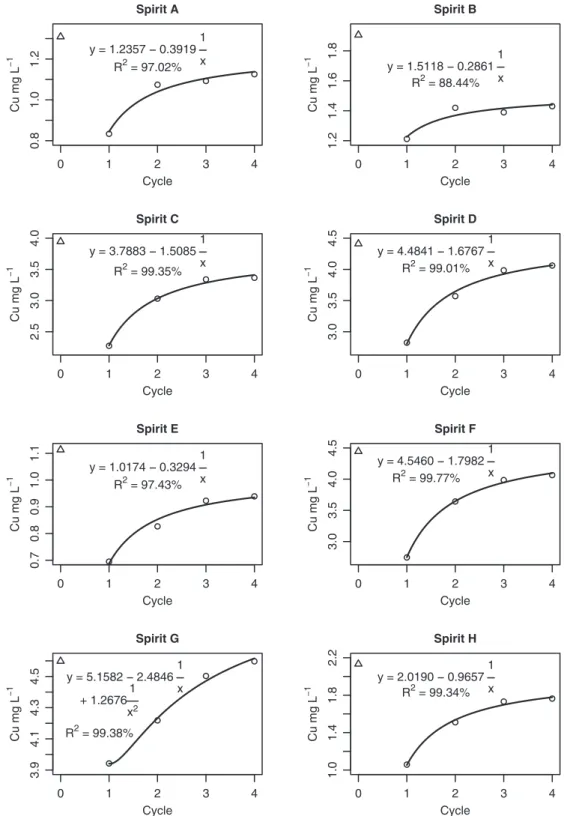
Fig. 3.Regression model of the concentration of Cu (mg L1) as a function of exposure cycles to raw soapstone cups, in 8 Brazilian spirits. Triangles represent Cu
The problem of the transference of Ni from soapstone to foods and simulants was already documented in a study with a food sim-ulant based on acetic acid at 3.0% and 5.0%, in which thein natura
soapstone was considered inappropriate for contact with the foods as a function of the transference of harmful amounts of Ni, espe-cially in the test with the more acid solution (Quintaes, 2006; Quintaes, Farfan, Morgano, & Mantovani, 2002).
However in the present study, although transference of Ni from the soapstone to the beverages was observed specially during the first cycle of contact (up to 622.2%, brand E), the Ni contents always were found conformed to the legal parameters (Table 3).
With respect to Cu, significant differences were noted for all sources of variation (Table 2). Since the interaction between cane spirit brands and exposure cycles was significant, the cane spirit brands were compared for each exposure cycle and also the expo-sure cycles for each cane spirit brand. The cane spirit brand G pre-sented the greatest mean concentration of Cu in all the exposure cycles (Table 3). For the other brands, there were practically no classification changes during the cycles with the exception of brands H and B, which were classified in the same group for the 1st and 2nd exposure cycles to the steatite cups, but in different groups for the 3rd and 4th cycles, brand B showing a Cu concentra-tion significantly lower than that of brand H (Table 3).
The cane spirit brands C, D, F, G and H which initially extrapo-lated the Cu content established by the German legislation (BGBl, 2002), presented percent reductions of 42.3; 35.9; 38.2; 14.3 and 50.4% respectively, after the first 24 h of contact within natura
steatite, favoring the adequacy of brand H (1.058 mg L 1) to the
above mentioned legislation (Table 3). Cu was adsorbed from all such five cane spirit brands in all the cycles, although at a decreas-ing rate. Thus it can be seen that in general, after the last exposure to soapstone, the cane spirits presented reduction in their Cu tents of 14.7; 7.9; 8.5; 0.0; and 17.3% in relation to the initial con-centration, with the exception of brand G. Cane spirit H was the only brand that became adequate and remained as such for the remaining exposure cycles to the soapstone cups. Cane spirits that were originally adequate (A, B and E) remained so throughout the experiment (Table 3).
As can be seen from the fitted regression curves (Fig. 3), there was a tendency for the Cu concentrations to increase in all the cane spirit brands with the progression of the exposure cycles to the soapstone cups.
For brand G a parameter associated to the square of the number of exposure cycles had to be included in the model. After this inclu-sion, lack of fit variation was no longer significant, indicating the adequacy of the model. For the other brands, regression models containing only a constant term and one parameter associated to the inverse of the number of exposure cycles, were satisfactory. In both models the constant term of the model can be interpreted as the value around which the Cu concentration tended to stabilize as the number of exposure cycles progressed. For brand A, the Cu concentration tended to stabilize at around 1.236 mg L 1.
The Cu carried by cane spirit could come from the distillation made in copper stills, with the formation of copper bicarbonate, which could be dissolved by the acidic alcoholic vapors and trans-mitted to the beverage in an unintentional way (Lima, Cardoso, Guimarães, Lima, & Nelson, 2009). A study provided evidence of a tendency to correlation between the ethyl carbamate content and the material the still was made of (Aresta, Boscolo, & Franco, 2001). The utilization of copper-free stills (i.e. stainless steel) rep-resents a good alternative to avoid Cu contamination in cane spirits during production of the beverage.
When considering the Cu contamination of cane spirits, a recent study showed there could be adsorption of the Cu present in cane spirits as a function of contact with steatite (Fernandes et al., 2013). Considerable deposits of this material are located in Minas
Gerais (Brazil) in the QFMG region (Deer, Howie, & Zussman, 1966; Fleischer & Mandarino, 1995; Roeser, Roeser, Mueller, & Tobschall, 1980). The great diversity of chemical elements found in the composition of steatite could respond for part of the reported interactions. It should be pointed out that in addition to cups and jars of soapstone, currently the market is commercializ-ing other steatite artifacts that could come into direct contact with beverages, including the sale of soapstone cubes that aim to substi-tute ice cubes, and could interfere in the final metal concentrations in the beverages.
The results of the present study confirmed that soapstone could adsorb metal elements from cane spirits such as Cu and Pb, with a notable capacity for Cu saturation after the first exposure cycle. The adsorption of the metals Cu and Pb by the material could be justified by the porosity and/or cleavage of the crystals or by the abrasion the steatite suffers on being lathed to produce a utensil. On the contrary, the origin of the migratory elements in alcoholic beverages could be related to the dissolution of terminal portions of the minerals, broken manually during the manufacture of soap-stone cups.
The presence of nickel, principally in samples from the first exposure cycles, could be related to physical ruptures on the sur-face talcum crystals with damaged edges. One should not ignore the influence of the acidity and alcohol content of the beverages, although these were not quantified. This influence could be an explanation for the differences observed in the migration of Ni and adsorption of Cu and Pb amongst the various cane spirits. Additional studies are required aimed at elucidating the adsorption and migration mechanism of chemical elements by soapstone.
4. Conclusions
The cane spirits produced in the Iron Quadrangle (MG, Brazil) that were evaluated in this study conformed with the Brazilian leg-islation with respect to the contents of the contaminants As 0.025 (0.011–0.085) mg L 1, Cd 0.003 (0.003–0.004) mg L 1, Cu 2.982
(1.113–4.598) mg L 1, Ni 0.010 (0.003–0.020) mg L 1 and Pb
0.024 (0.006–0.074) mg L 1. However this was not the case with
respect to German legislation, since 62.5% of the brands of cane spirit evaluated showed more than the maximum permitted amount of Cu (2 mg L 1) by 97.2; 120.5; 122.2; 129.9 and 6.6%,
respectively.
With respect to the behavior of the inorganic contaminants, evi-dence was found that the contact of alcoholic beverages within natura soapstone could reduce the Cu content by up to 50.4%, and increase the Ni content by up to 622.2%, in the first 24 h of con-tact. During exposure of the cane spirits to soapstone there was also a linear reduction in the mean Pb content for all the beverages, varying from 18.3% to 54.5% in the first and last cycles, respec-tively. On the other hand, there was no significant variation in the As and Cd contents during the experiment.
In naturasoapstone in contact with alcoholic solutions contam-inated with Cu and Pb could promote a reduction in the contents of these elements, favoring adequacy of these elements to the param-eters established by the legislation, which have a view to the safety of the individuals. However, due to the imminent risk of transfer-ring Ni, steatite should not be in contact with alcoholic beverages which present a content of this element close to the maximum legal limit, since this could represent a health risk to the consumer.
Conflict of interest statement
Acknowledgements
The authors are grateful to Oliveira APF and Dedini CA for help with chemical analysis and English review, respectively. Thanks to Fundação de Amparo à Pesquisa do Estado de Minas Gerais (FAPE-MIG – Brazil) for the financial support (APQ 01558-09 and APQ-02246-14) and to Coordenação de Aperfeiçoamento de Pessoal de Nível Superior (CAPES – Brazil) to the master grant to Louvera Silva KA.
References
Ajtony, Z., Szoboszlai, N., Suskó, E. K., Mezei, P., György, K., & Bencs, L. (2008). Direct sample introduction of wines in graphite furnace atomic absorption spectrometry for the simultaneous determination of arsenic, cadmium, copper and lead content.Talanta, 76, 627–634.
Aresta, M., Boscolo, M., & Franco, D. W. (2001). Copper (II) catalysis in cyanide conversion into ethyl carbamate in spirits and relevant reactions.Journal of Agricultural and Food Chemistry, 49, 2819.
BGBl. Weinverordnung in Der Fassung Der Bekanntmachung. vom 14. Mai 2002 (BGBl. I, S. 1583), zuletzt geändert durch die Verordnung vom 28. März 2003 (BGBl. I, S. 453).
Caldas, N. M., Raposo, J. L., Jr., Gomes Neto, J. A., & Barbosa, F. Jr., (2009). Effect of modifiers for As, Cu and Pb determinations in sugar-cane spirits by GF AAS.Food Chemistry, 113, 1266–1271.
Camean, A. M., Moreno, I., López-Artiquez, M., Repetto, M. A., & Gonzalez, A. G. (2001). Differentiation of Spanish brandies according to their metal content.
Talanta, 54, 53–59.
Cempel, M., & Nikel, G. (2006). Nickel: A review of its sources and environmental toxicology.Polish Journal of Environmental Studies, 15, 375–382.
CEPA. Conselho Estadual de Política Agrícola. Câmara Técnica de Cachaça de Alambique. Plano setorial da cachaça de alambique. Belo Horizonte, Minas Gerais. 2008. 14 p.
Cristensen, J. M., Kristiansen, J., Nielsen, N. H., Menne, T., & Byrialsen, K. (1999). Nickel concentrations in serum and urine of patients with nickel eczema.
Toxicology Letters, 108, 185–189.
Deer, W. A., Howie, R. A., & Zussman, J. (1966).An Introduction to the Rock Forming Minerals. Essex: Longman Press.
Dugo, G., La Pera, L., Lo Turco, V., Di Bella, G., & Salvo, F. J. (2004). Determination of Ni (II) in beverages without any sample pre-treatment by adsorptive stripping chronopotentiometry (AdSCP).Journal of Agricultural and Food Chemistry, 52, 1829–1834.
Fernandes, J. W., Cardoso, M. G., Vilela, F. J., Morais, A. R., Silva, V. F., & Nelson, D. L. (2007). Physicochemical quality of a blend of domestic cachaças from the south of Minas Gerais.Journal Food Composition and Analysis, 20, 257–261. Fernandes, I. C., Fausto, M. A., Bezerra, O. M. P. A., Quintaes, K. D., Morgano, M. A., &
Cerqueira, I. B. (2013). Levels of inorganic contaminants in Brazilian cachaças from the Quadrilatero Ferrífero region stored in steatite (soapstone)in natura
cups.Quimica Nova, 36, 1360–1365.
Ferreira, D. F. (2011). Sisvar: A computer statistical analysis system.Ciência e Agrotecnologia, 35, 1039–1042.
Fleischer, M., & Mandarino, J. A. (1995).Glossary of mineral species. Tucson: The Mineralogical Record, Inc. 280p.
Hinkelmann, K., & Kempthorne, O. (2008).Design and analysis of experiments(Vol. 1). Hoboken: John Wiley & Sons. 631p.
Ibanez, J. G., Carreon-Alvarez, A., Barcena-Soto, M., & Casillas, N. (2008). Metals in alcoholic beverages: A review of sources, effects, concentrations, removal, speciation, and analysis.Journal Food Composition and Analysis, 21, 672–683. IBRAC. (2014). Instituto Brasileiro da Cachaça. Fonte: MDIC – ALICEWEB – NCM
2208.40.00/Elaboração: Instituto Brasileiro da Cachaça – IBRAC. Brasília,
Distrito Federal. URL <http://www.ibraccachacas.org/index.php/servicos/ estatisticas/mercado-externo> Accessed 02.10.14.
INMETRO – Instituto Nacional de Metrologia, Normalização e Qualidade Industrial. Orientação Sobre Validação de Métodos Analíticos. DOQ-CGCRE-008. Rev.: 04, 1–20, Jul. 2011.
Lachenmeier, D. W., Przybylski, M. C., & Rehm, J. (2012). Comparative risk assessment of carcinogens in alcoholic beverages using the margin of exposure approach.International Journal of Cancer, 131, E995–E1003.http:// dx.doi.org/10.1002/ijc.27553.
Lima, A. J. B., Cardoso, M. G., Guimarães, L. G. L., Lima, J. M., & Nelson, D. L. (2009). Efeito de substâncias empregadas para remoção de cobre sobre o teor de compostos secundários da cachaça.Quimica Nova, 32, 845–848.
Littell, R. C., Milliken, G. A., Stroup, W. W., & Wolfinger, R. D. (1996).SASÒ
system for mixed models. Cary, NC: SAS Institute Inc. 633p.
López-Artíguez, M., Cameán, A. M., & Repetto, M. (1996). Determination of nine elements in sherry wine by inductively coupled plasma-atomic emission spectrometry.Journal of AOAC International, 79, 1191–1197.
Mena, C., Cabrera, C., Lorenzo, M. L., & López, M. C. (1995). Cadmium levels in wine, beer and other alcoholic beverages: Possible sources of contamination. The Science of the Total Environment, 181, 201–208.
Ministry of Agriculture, Livestock and Supply. Instrução Normativa n°13, de 29/06/ 2005. Padrões de identidade e qualidade para aguardente de cana e para cachaça. Diário Oficial [da] República Federativa do Brasil. Brasília, DF, 30 jun. 2005.
Ministry of Health. Agência Nacional de Vigilância Sanitária. Decreto n°55.871, de 26 de março de 1965. Diário Oficial [da] República Federativa do Brasil. Brasília, DF, 9 abr. 1965.
Nascimento, R. F., Bezerra, C. W. B., Furuya, S. M. B., Schultz, M. S., Polastro, L. R., Lima Neto, B. S., & Franco, D. W. (1999). Mineral profile of Brazilian cachaças and other international spirits.Journal Food Composition and Analysis, 12, 17–25. Quintaes, K. D. (2006). A influência da composição do esteatito (pedra-sabão) na migração de minerais para os alimentos: Minerais do esteatito.Cerâmica, 52, 298–305.
Quintaes, K. D., Farfan, J. A., Morgano, M. A., & Mantovani, D. M. B. (2002). Soapstone (steatite) cookware as a source of minerals.Food Additives Contaminants, 19, 134–143.
R Core Team. (2013).R: A language and environment for statistical computing. Vienna: R Foundation for Statistical Computing, URL <http://www.R-project.org/> Accessed 13.02.15.
Rodushkin, I., Odman, F., & Appelblad, P. K. (1999). Multielement determination and lead isotope ratio measurement in alcoholic beverages by high-resolution inductively coupled plasma mass spectrometry.Journal Food Composition and Analysis, 12, 243–257.
Roeser, U., Roeser, H., Mueller, G., & Tobschall, H. J. (1980).Anais do XXXI Congresso Brasileiro de Geologia, 4, 2230–2245.
Scott, A. J., & Knott, M. A. (1974). A cluster analysis method for grouping means in the analysis of variance.Biometrics, 30, 507–512.
Siebalde, H. G. L., Canuto, M. H., Lima, G. M., & Silva, J. B. B. (2002).Informe Agropecuário, 23, 59.
Soufleros, E. H., Mygdalia, A. S., & Natskoulis, P. (2004). Characterization and safety evaluation of the traditional Greek fruit distillate ‘‘Mouro” by flavor compounds and mineral analysis.Food Chemistry, 86, 625–636.
Statista.The statistics portal. Revenue forecast of the global spirits industry from 2009 to 2015 (in billion U.S. dollars). URL <http://www.statista.com/statistics/233496/ revenue-forecast-of-the-global-spirits-industry> Accessed 03.12.15.
Vilaykumar, S. I., & Ashwini, K. A. (2001). Voltammetric determination of lead at chemically modified electrodes bases on crown ethers.Analytical Sciences, 17, 605–608.