Adsorption of Cd, Cu, Ni and Zn in tropical soils under
competitive and non-competitive systems
Cindy Silva Moreira
1; Luís Reynaldo Ferracciú Alleoni
2*
1
USP/CENA – Programa de Pós-Graduação em Ciências, C.P. 96 – 13400-970 Piracicaba, SP, Brasil. 2
USP/ESALQ – Depto. de Ciência do Solo, C.P. 9 – 13418-900 – Piracicaba, SP, Brasil. *Corresponding author <[email protected]>
ABSTRACT: The adsorption of heavy metals in soils affects their behavior in the environment and their bioavailability to plants. The knowledge of the adsorption mechanisms in competitive systems allows a more realistic evaluation of the metals’ behavior in the soil than the single metal adsorption. The objectives of this study were (i) to evaluate Cd, Cu, Ni, and Zn adsorption in 14 surface samples (0–0.2 m) of representative soils of the Brazilian humid-tropical region, in competitive and non-competitive systems, and (ii) to establish metal affinity sequences for each soil, based in the maximum adsorption capacity (MAC) estimated by the Langmuir model. The Rhodic Eutrudox, the Kandiudalf Eutrudox, the Arenic Hapludalf, the Arenic Hapludult and the Typic Argiudoll had the highest metals’ adsorption capacity, whereas the Typic Quartzipsamment and the sandy-textured Arenic Hapludult had the lowest values. In general, the MAC values for metals were lower in the competitive than in the non-competitive system. In the non-competitive system, the most common affinity sequence was Cu > Zn > Ni > Cd, whereas the most common sequence was Cu > Cd > Zn > Ni in the competitive system. In general, the Langmuir model fitted well the adsorption data of metals on the studied soils.
Key words: heavy metals, competition, tropical soil
Adsorção de Cd, Cu, Ni e Zn em solos tropicais em
sistemas competitivo e não-competitivo
RESUMO: A adsorção de metais pesados em solos afeta seu comportamento e biodisponibilidade às plantas. O conhecimento dos mecanismos de adsorção em sistemas competitivos permite uma avaliação mais realista do comportamento dos metais no solo do que estudos com adsorção de cada metal, isoladamente. Os objetivos desse trabalho foram: (i) avaliar a adsorção de Cd, Cu, Ni e Zn em amostras superficiais (0-0,2 m) de 14 solos representativos da região tropical úmida, em sistema competitivo e não-competitivo, e (ii) estabelecer sequências de afinidade metálica para cada solo, com base nos valores de capacidade máxima de adsorção (CMA) dos metais estimados por meio do modelo de Langmuir. O Rhodic Eutrudox, o Kandiudalfic Eutrudox, o Arenic Hapludalf (Alf2), o Arenic Hapludult (Ult2) e o Typic Argiudoll apresentaram elevadas capacidades de adsorção dos metais, ocorrendo o inverso para o Typic Quartzipsamment e para o Arenic Hapludult textura arenosa. No geral, a CMA dos metais aos solos foi menor no sistema competitivo. A sequência de afinidade mais comumente encontrada no sistema não-competitivo foi Cu > Zn > Ni > Cd. No sistema competitivo, a sequência foi Cu > Cd > Zn > Ni. Em geral, o modelo de Langmuir simulou de maneira satisfatória a adsorção dos metais nas amostras de solo.
Palavras-chave: metais pesados, competição, solo tropical
Introduction
High amount of heavy metals such as Cd, Ni, Zn, and Cu in the soil can decrease crop yield due to tox-icity and imply the risk of biomagnification and bioaccumulation in the food chain (Coscione et al., 2009). These metals may accumulate in the soil solid phase in several forms with specific energy levels and variable degree of reversibility of their reactions. Ion exchange, specific adsorption, organic matter complex-ation, precipitation and dissolution, and redox reac-tions define the content of bioavailable elements in the soil solution (Chang et al., 2002). Among those pro-cesses, adsorption is the most important (Silveira et al., 2002).
Detailing the chemical mechanism is essential to model plant toxicity and groundwater contamination. The interaction between ionic species in solution and the variety of soil components increase the complex-ity of this mechanism (Casagrande et al., 2004). In ad-dition, these ionic species compete for the adsorption sites on the soil colloidal surfaces. Such complexity jus-tifies the need of studies in tropical soils, because they have contrasting chemical, physical and mineralogical characteristics (Soares et al., 2005; Fontes and Alleoni, 2006).
surface layer of representative soils of the Brazilian hu-mid tropical region; and (ii) to establish the sequences of preference of metallic ions for each soil, based on the values of maximum adsorption capacity for the metals, estimated by the Langmuir model.
Material and Methods
Surface samples (0-0.2 m) from 14 non-cultivated soils were collected in areas under native vegetation or an-cient reforestation in the State of São Paulo, Brazil. The natural vegetation is the evergreen Atlantic Forest, some fragments of the semideciduos forest, and remnants of the Cerrado biome (Soares and Alleoni, 2008).
Chemical characterization was performed in air-dried soil samples passed through a 10 mesh (2 mm) sieve (air-dry fine earth, ADFE). The pH was potentially de-termined in H2O and M KCl solution (soil:solution ra-tio 1:2.5), and the difference ΔpH = pHM KCl – pHH2O was used to estimate the sign of the net charge (Mekaru and Uehara, 1972). Organic carbon was quantified by oxida-tion with potassium dichromate in the presence of sul-furic acid, followed by titration with ammonium FeII sul-fate (Nelson and Sommers, 1996).
Cation exchange capacity (CEC) was calculated as the sum of exchangeable basic cations (Ca + Mg + K + Na), extracted by an ionic exchange resin (van Raij et al., 1986), plus the total acidity (H+Al), extracted with a 1 M calcium acetate (pH 7 buffered) solution, with fur-ther determination by titration with ammonium hydrox-ide (0.025 M). Ca and Mg were determined by atomic absorption spectrometry (AAS), and Na and K by flame photometry. Mineralogical analyses of the clay fraction were performed in an X-ray diffractometer, operating at 40kV and 40 mA, using Cu-Kα radiation and scanning from 2 to 35o after their treatment with H
2O2 and Na-citrate-dithionite-bicarbonate (Na-cdb) to remove the organic matter and the Fe oxides, respectively.
Iron, aluminum was extracted using a 9 M H2SO4 so-lution, and silicon was removed with NaOH from the residue of the acid attack. Contents of Fe and Al were determined using AAS, and Si was quantified by gravim-etry. The Ki weathering index was calculated by Ki =
(%SiO2/60)/(%Al2O3/102). Na-cdb solution was used to extract the ‘free’ iron oxides (Fed) according to the method of Mehra and Jackson (1960). The hydrometer method was used for particle-size analysis after disper-sion in 0.015 M (NaPO3)6.Na2O/M NaOH and overnight shaking.
Initial concentrations of Cu as Cu(NO3)2.2H2O, Ni as Ni(NO3)2.6H2O, Cd as Cd(NO3)2 , and Zn as Zn(NO3)2 were prepared in 20 mL of a 0.01 mol L–1 NaNO
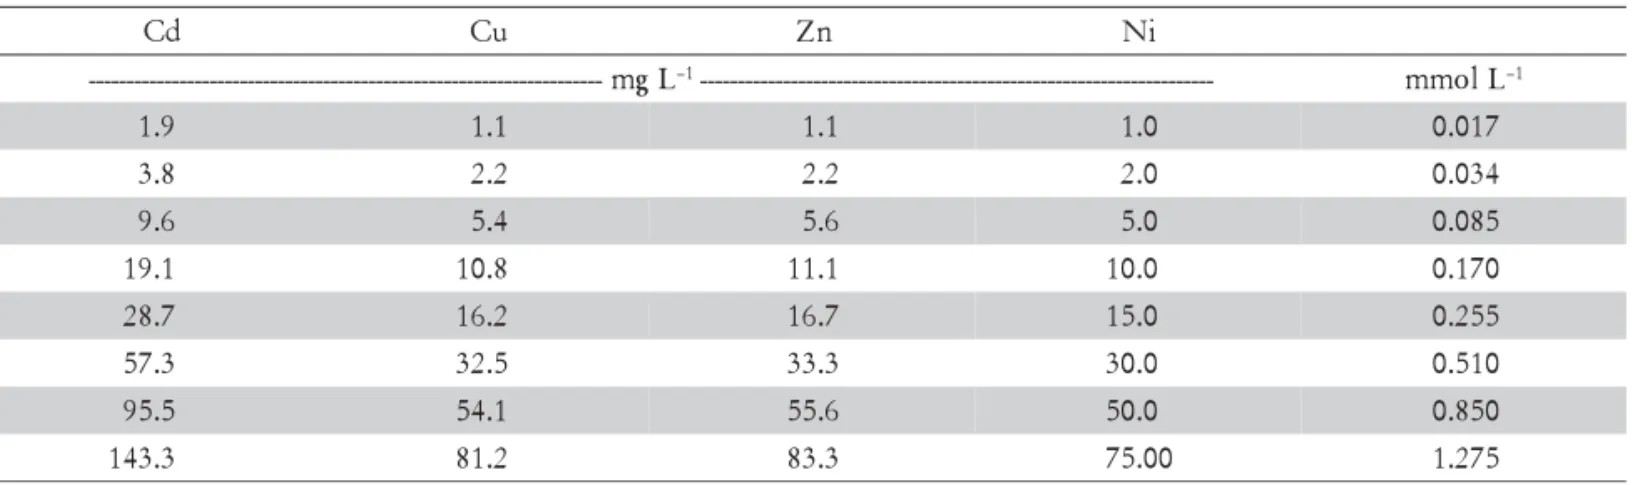
3 solu-tion (1:10 ratio). Both non-competitive and competitive solutions were prepared and mixed with 2 g of the ADFE. Nitrate was chosen as the supporting electrolyte because it has a small capacity to complex metallic cat-ions (Msaky and Calvet, 1990; Silveira et al., 2003). Con-centrations were standardized by molar conCon-centrations, suppressing the mass effect difference among the metal ions (Table 1) (Echeverría et al., 1998).
Each batch was shaken for 1 h in a horizontal shaker at 100 cycles per minute (Fontes and Gomes, 2003). Af-ter shaken, samples were centrifuged at 1,100 x g for 10 minutes and filtered. Concentration of Cd, Cu, Ni and Zn were determined by AAS.
Metal concentrations of adsorbed heavy metals were estimated by Cads = (C0 – Ceq) DF; where Cads is the amount of metal adsorbed onto the solid phase, C0 is the concentration of metal in the initial solution, Ceq is the concentration of metal in the solution after interac-tion with soils, and DF is the diluinterac-tion factor (in the present case, 20 mL of solution to 2 g of ADFE, DF=10). Adsorption isotherms were adjusted using the algo-rithm Fitfunc.bas (Barrow 1987), which adjusts non-lin-ear equations to the results using the “minimum devia-tion” method (Mead, 1981; Shani et al., 1992) to calcu-late the maximum adsorption for each metal. In soils with high Cu adsorption, the isotherm could not be fit-ted to the experimental data even in the cases of small concentration in the solution (Ox1, Ox5, Oll and Alf1). In such cases, the data did not fit the model, because er-rors in the estimation of the maximum adsorption may reach 50% (Harter, 1984).
Values of maximum adsorption capacity (MAC) were obtained after the linearization of experimental data of each metal according with the equation Ceq / Cads =
d
C Cu Zn Ni
L g m
---- –1 -------------------------------------------------------------------- mmolL–1
9 .
1 1.1 1.1 1.0 0.017
8 .
3 2.2 2.2 2.0 0.034
6 .
9 5.4 5.6 5.0 0.085
1 . 9
1 10.8 11.1 10.0 0.170
7 . 8
2 16.2 16.7 15.0 0.255
3 . 7
5 32.5 33.3 30.0 0.510
5 . 5
9 54.1 55.6 50.0 0.850
3 . 3 4
1 81.2 83.3 75.00 1.275
(1/ K x MAC) + Ceq / MAC; where Ceq is the ion con-centration in the solution at equilibrium with the solid phase, Cads is the amount of ion adsorbed in the solid phase, K is the affinity constant and MAC is the maxi-mum adsorption capacity. Considering the large num-ber of isotherms obtained in the present study, this pa-per presents those with contrasting adsorptive behavior. The experiment was designed to be completely ran-domized. Comparison among soil samples and the pref-erence sequences were made based on the maximum ad-sorption values.
Results and Discussion
Soil characterization
Most of the soil samples were acidic (pH in H2O≤ 5.5) (Table 2). All samples had a negative balance of charge (ΔpH < 0) probably due to the contribution of organic matter. Organic carbon (OC) content was higher than 15 g kg–1 for the majority of samples, except for the Arenic Hapludult (Ult1), Typic Quartzipsamment and Arenic Hapludalf. The Typic Eutraquox and the Typic Medifibrist had the highest contents of OC (130.7 and 119.1 g kg–1, respectively). Rhodic Eutrudox, Rhodic Acrudox and Kandiudalfic Eutrudox were very clayey (>600 g kg–1 clay), while Rhodic Hapludox, Anionic Acrudox, Arenic Hapludalf (Alf2), Typic Eutraquox and Typic Argiudoll were clayey (350-600 g kg–1). On the other hand, the Arenic Hapludult (Ult1) and the Typic Quartzipsamment were sandy (<150 g kg–1 clay). The re-maining samples were medium-textured (150-350 g kg–1 clay) (Table 2).
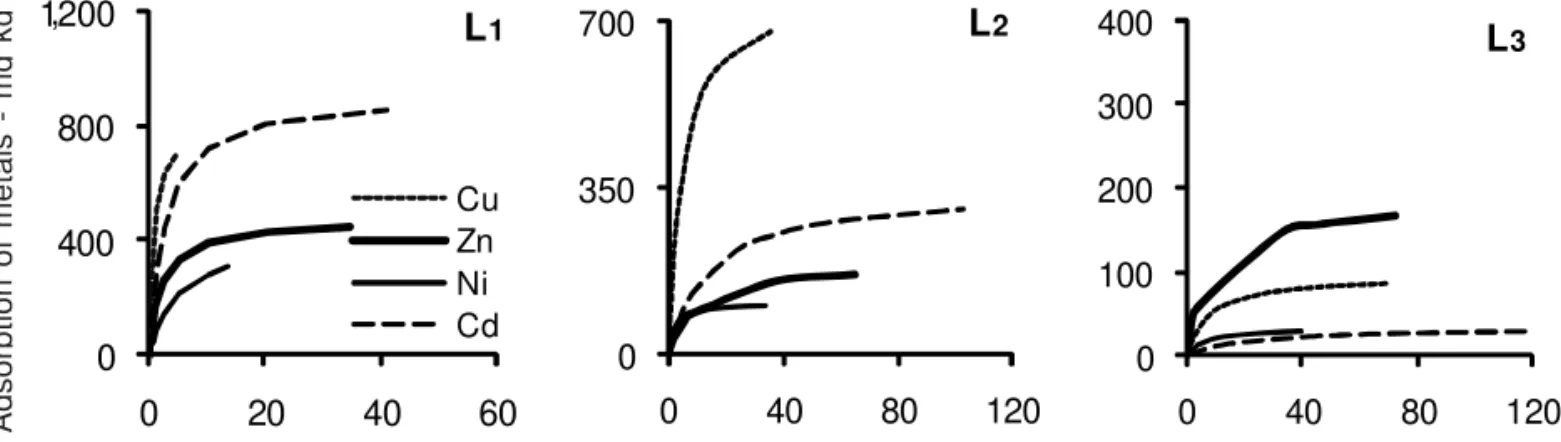
Adsorption isotherms for Cd, Cu, Ni and Zn The adsorption curves fitted well to a Langmuir-type isotherm in both the competitive (CS) and non-competi-tive (NCS) systems and were divided into three sub-groups: L1 (maximum adsorption up to 1,200 mg kg–1 and equilibrium concentration up to 15 mg L–1 for the NCS; maximum adsorption up to 1,200 mg kg–1 and equilib-rium concentration up to 60 mg L–1 for the CS); L2 (maxi-mum adsorption up to 700 mg kg–1 and equilibrium con-centration up to 60 mg L–1 for the NCS; maximum ad-sorption up to 700 mg kg–1 and equilibrium concentra-tion up to 120 mg L–1 for the CS); and L3 (maximum ad-sorption up to 400 mg kg–1 and equilibrium concentra-tion up to 120 mg L–1 for both systems (Table 3).
Non-competitive system
It was not possible to obtain the isotherm for Ox1 in the non-competitive system because the adsorption was exceedingly higher than the other soils. This behavior halted the linearization procedure and the determination of the maximum adsorption capacity. These findings were in agreement with the high adsorption capacity of this soil, as reported by Silveira et al. (2002) for Cu. Isotherms that had similar equilibrium concentration for different metal concentration may have had metal precipitation during the experiments (Brümmer et al., 1983). Therefore, the high pH of sample Ox1 (7.2) may have induced metal pre-cipitation. For the remaining soils, a more contrasting be-havior among metals was observed. The smaller steep-ness of the isotherms of these soils implies that most of the metals were adsorbed even at the smaller concentra-tions, decreasing as the metal concentration increased.
y m o n o x a T S
U 1 Symbol Geographical
s e t a n i d r o o
c pHH2O ∆pH
2 CEC3 OC4 Clay Fe b d c
5 Ki6 Qualitative y g o l a r e n i m 7 g k l o m
m –1 ------------gkg–1----------
--x o d u r t u E c i d o h
R Ox1 21º05'S,47º08'W 7.3 -0.6 64.1 64.9 684 185 1.1 Kt,Gb
x o d u l p a H c i d o h
R Ox2 22º43'S,47º38'W 4.6 -1.2 66.7 23.9 530 87 1.2 Kt
x o d u r c A c i d o h
R Ox3 21º10'S,47º48'W 4.7 -0.9 66.6 35.5 716 208 1.0 Kt,Gb
x o d u r c A c i n o i n
A Ox4 20º10'S,48º02'W 4.7 -1.0 53.4 25.5 470 113 0.9 Kt,Gb
x o d u r t u E c i f l a d u i d n a
K Ox5 21º10'S,47º48'W 5.5 -0.8 97.1 35.7 658 192 1.6 Kt,Gb
x o u q a r t u E c i p y
T Ox6 22º43'S,47º38'W 4.9 -1.1 144.0 130.7 476 5 2.1 Kt
t l u d u l p a H c i n e r
A Ult1 22º32'S,47º54'W 5.3 -1.0 10.0 4.2 60 3 2.3 Kt
t l u d u l p a H c i n e r
A Ult2 22º38'S,47º11'W 5.4 -0.8 61.6 19.1 247 33 2.8 Kt
f l a d u l p a H c i n e r
A Alf1 22º12'S,49º56'W 5.4 -1.1 85.9 20.7 100 5 3.0 Kt,Il
f l a d u l p a H c i n e r
A Alf2 22º12'S,49º39'W 5.8 -2.0 13.5 6.4 40 8 4.5 Kt,I,lHIV
t n e m m a s p i z t r a u Q c i p y
T Ent 22º32'S,47º54'W 4.4 -0.6 14.6 4.9 80 3 2.4 Kt
t s i r b i f i d e M c i p y
T Ist 24º43'S,47º52'W 4.0 -0.6 124.7 119.1 275 9 2.4 Kt
t p e h c o r t s y D c i p y
T Ept 22º22'S,46º56'W 4.3 -0.7 39.6 17.6 243 19 1.9 Kt
l l o d u i g r A c i p y
T Oll 22º07'S,47º39'W 5.8 -1.7 153.6 28.7 543 113 2.6 Kt
Table 2 – Selected chemical, physical, and mineralogical properties of 14 Brazilian superficial samples from different soil orders, collected under native vegetation.
1 USDA Soil Taxonomy (Soil Survey Staff, 2010); 2ΔpH = pH
M KCl – pHH2O;
3 CEC = cation exchange capacity; 4OC = organic carbon; 5Fe
dcb = iron content extracted by Na citrate-dithionite-bicarbonate solution;
6Ki = weathering index; 7Kt = kaolinite; Gb=gibbsite;
For all soils, the amount of adsorbed Cd, Cu, Ni and Zn increased as the concentration of the metals in-creased, although the rate of the increase became smaller as lesser adsorption sites were available (Petruzzelli et al. 1985; Ross 1994). Almost the whole amount of met-als added were adsorbed in soils Oll, Ult2, Alf1 and Ox5, as can be seen by the steep isotherms of the group L1 (Figure 1). This behavior demonstrated the high af-finity of metals by the adsorption sites of these soils.
Cu adsorption was higher than the adsorption of other metals (Figure 1, Groups L1 and L2), except for the soils of Group L3 - Arenic Hapludult (Ult1) and Typic Quartzipsamment (Ent) (Figure 1). Similar results were reported by Matos et al., (1996); Fontes et al., (2000); Gomes et al., (2001); Alumaa et al., (2001) and Silveira and Alleoni (2003) for highly-weathered tropical soils.
The maximum adsorption capacity (MAC) of metals was high for Oll, Ult2, Alf1, Ox5 and Ox1 (Table 4). Conversely, Ent and Ult1 had smaller MAC, which may be explained by the small OC contents (4.9 and 4.2 g kg–1,
respectively) and the sandy texture of these soils (Table 1). The Cd isotherm for Ent was not shown because the linearization of the isotherm was impossible. The re-maining soils had intermediate values of MAC.
Competitive system
For the competitive system, the amount of adsorbed metal also increased as the concentration increased (Fig-ure 2). As the concentration increased, the competition among the metals influenced their adsorption in differ-ent degrees. Such results were similar to those reported by Basta and Tabatabai (1992) and Echeverría et al. (1998) in Haplaquolls, Hapludols, Xerochrept, Xerorthent and Haplumbrept. Fontes and Gomes (2003) evaluated the competitive adsorption of metals in samples of tropical soils (Oxisols, Ultisols and one Alfisol) and observed that Cu, Cr and Pb kept the high affinity for soil solid surfaces, while Ni, Zn and Cd were displaced from the adsorbing surfaces. Ni, Zn and Cd are more affected by the electrostatic interactions with the surface exchange
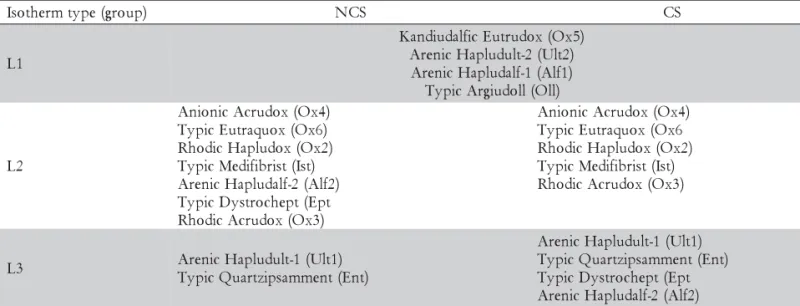
Table 3 – Soil Classification, grouped according to the adsorption behavior of the adjusted Langmuir isotherm for the competitive (CS) and non competitive (NCS) systems.
L1: Maximum adsorption up to 1,200 mg kg–1 and equilibrium concentration up to 15 mg L–1 for the NCS; maximum adsorption up
to 1,200 mg kg–1 and equilibrium concentration up to 60 mg L–1 for the CS; L2: Maximum adsorption up to 700 mg kg–1 and
equilibrium concentration up to 60 mg L–1 for the NCS; Maximum adsorption up to 700 mg kg–1 and equilibrium concentration up
to 120 mg L–1 for the CS; L3: Maximum adsorption up to 400 mg kg–1 and equilibrium concentration up to 120 mg L–1 for both system. ) p u o r g ( e p y t m r e h t o s
I NCS CS
1 L ) 5 x O ( x o d u r t u E c i f l a d u i d n a K ) 2 t l U ( 2 -t l u d u l p a H c i n e r A ) 1 f l A ( 1 -f l a d u l p a H c i n e r A ) l l O ( l l o d u i g r A c i p y T 2 L ) 4 x O ( x o d u r c A c i n o i n A ) 6 x O ( x o u q a r t u E c i p y T ) 2 x O ( x o d u l p a H c i d o h R ) t s I ( t s i r b i f i d e M c i p y T ) 2 f l A ( 2 -f l a d u l p a H c i n e r A t p E ( t p e h c o r t s y D c i p y T ) 3 x O ( x o d u r c A c i d o h R ) 4 x O ( x o d u r c A c i n o i n A 6 x O ( x o u q a r t u E c i p y T ) 2 x O ( x o d u l p a H c i d o h R ) t s I ( t s i r b i f i d e M c i p y T ) 3 x O ( x o d u r c A c i d o h R 3
L ArenicHapludult-1(Ult1) ) t n E ( t n e m m a s p i z t r a u Q c i p y T ) 1 t l U ( 1 -t l u d u l p a H c i n e r A ) t n E ( t n e m m a s p i z t r a u Q c i p y T t p E ( t p e h c o r t s y D c i p y T ) 2 f l A ( 2 -f l a d u l p a H c i n e r A 0 400 800 1200
0 3 6 9 12 15 Cu Zn Ni Cd
L
1 , 0 350 7000 20 40 60
L
2 0 100 200 300 4000 20 40 60 80 100120
L
3--- Equilibrium concentration - mg L–1
---Adsorption of metals - mg kg
–1
sites, while Cu is more affected by covalent binding to mineral surfaces (McBride, 1994). Such ideas are in agree-ment with the findings of Matos et al. (1996), Fontes et al. (2000), Gomes et al. (2001) and Fontes and Gomes (2003).
The majority of soils revealed a decrease in MAC of metals in the non-competitive system, except for Cu ad-sorption in Ox4 and Ist, and for Cd in Ult2, Alf1, Ox5 and Oll and for (Table 4). For these soils, the competi-tion among metals did not change the adsorpcompeti-tion behav-ior but somehow increased the specific retention. The
MAC values reported the dominance of Cu in the ad-sorption complex, particularly for Ox1, Ult2, Oll, Ox5, Alf1 and Ist. The high adsorption capacity for Cu into these soils implied that, besides the covalent, specific binding, Cu retention was also related to ionic binding (Silveira et al., 1999). Similar results were reported for
Cu in Oxisols, Ultisols and Alfisol (Fontes and Gomes, 2003) and other soil orders (Haplaquolls, Hapludols, Xerochrept, Xerorthent, Haplumbrept) (Basta and Tabatabai, 1992; Echeverría et al., 1998). Fontes and Gomes (2003) observed that the presence of Cu in the system decreased the adsorption of Cd, Zn and Ni; the maximum adsorption and the distribution coefficient of the metals were greater in the non competitive system as compared to the competitive system.
For the majority of soils, Cu adsorption was the one with less contrast between the two systems, indicating that the ionic competition did not affect its preferential binding to specific adsorption sites. Although Ent, Ox4, Ult1 and Ox3 had small CEC, these soils had the small-est decrease in the maximum adsorption for Cu in the competitive system. This behavior may be related to the preferential adsorption of Cu, particularly when there
Table 4 – Maximum adsorption of Zn, Ni, Cu, and Cd, estimated by fitting metal adsorption data to the Langmuir model
in the non competitive (NCS) and competitive (CS) systems.
l i o
S NCS CS
i
N Cu Zn Cd Ni Cu Zn Cd
--- mgkg–1(mmol
ckg 1
–)*-------------------------------------------------------------------------------
--2 x
O 288.2(4.9) 584.5(9.2) 385.2(5.9) 438.2(3.9) 88.2(1.5) 412.9(6.5) 143.6(2.2) 247.2(2.2)
1 x
O - - - - 452.9(7.7) 997.4(15.7) 1423.4(21.8) 1999.9(17.8)
3 x
O 417.6(7.1) 622.6(9.8) 555.0(8.5) 505.6(4.5) 300.0(5.1) 476.5(7.5) 182.8(2.8) 303.4(2.7)
4 x
O 347.1(5.9) 584.5(9.2) 417.9(6.4) 449.4(4.0) 111.8(1.9) 584.5(9.2) 156.7(2.4) 258.4(2.3)
1 t l
U 105.9(1.8) 165.2(2.6) 352.6(5.4) 370.8(3.3) 64.7(1.1) 146.1(2.3) 84.9(1.3) 101.1(0.9)
2 t l
U 835.3(14.2) 2,001.2(31.5) 999.0(15.3) 662.9(5.9) 400.0(6.8) 908.5(14.3) 398.3(6.1) 831.4(7.4)
1 f l
A 911.8(15.5) 1,664.5(26.2) 907.6(13.9) 764.0(6.8) 347.1(5.9) 768.7(12.1) 476.6(7.3) 910.1(8.1)
t n
E 76.5(1.3) 101.6(1.6) 84.9(1.3) - 41.2(0.7) 95.3(1.5) 19.6(0.3)
-5 x
O 835.3(14.2) 1,245.2(19.6) 829.2(12.7) 764.0(6.8) 335.3(5.7) 832.2(13.1) 476.6(7.3) 910.1(8.1)
6 x
O 417.6(7.1) 622.6(9.8) 430.9(6.6) 471.9(4.2) 111.8(1.9) 590.8(9.3) 182.8(2.8) 370.8(3.3)
t s
I 382.4(6.5) 584.5(9.2) 476.6(7.3) 449.4(4.0) 105.9(1.8) 768.7(12.1) 189.4(2.9) 337.1(3.0)
t p
E 205.9(3.5) 400.2(6.3) 587.6(9.0) 393.2(3.5) 58.8(1.0) 343.1(5.4) 137.1(2.1) 179.8(1.6)
2 f l
A 258.8(4.4) 343.1(5.4) 666.0(10.2) 415.7(3.7) 88.2(1.5) 190.6(3.0) 117.5(1.8) 179.8(1.6)
l l
O 711.8(12.1) 1,111.8(17.5) 999.0(15.3) 764.0(6.8) 452.9(7.7) 832.2(13.1) 620.3(9.5) 1,101.1(9.8)
(-)not linearized isotherm. * values in parenthesis are expressed in mmol kg–1.
Figure 2 – Adsorption isotherms of Cd, Cu, Ni and Zn for H, L1, L2 and L3 groups in competitive system (CS).
--- Equilibrium concentration - mg L–1
---0 350 700
0 40 80 120
L
20 100 200 300 400
0 40 80 120
L
3Adsorption of metals - mg kg
–1
0 400 800 1200
0 20 40 60
Cu Zn Ni Cd
L
1was a small number of adsorption sites. In the soils with high CEC, the ionic competition was greater, but still the high affinity of Cu by the specific adsorption sites seemed not to be affected appreciably. As it occurred in the non-competitive system, the MAC for Cd was not estimated for the Ent soil due to the impossibility of the isotherm linearization (Table 4).
Metal affinity sequences
The most common sequence of metal affinity in the NCS was Cu > Zn > Ni > Cd (Table 5). For the CS, the most common sequence was Cu > Cd > Zn > Ni, resulting from the preference for Cd over Zn and Ni. The sequence for the NCS was in agreement with the sequence of the negative log of the first hydrolysis dis-sociation constant for these metals [Cu (8.0); Zn (9.0); Ni (9.9) and Cd (10.1)]. In this case, the covalent bind-ing was the main mechanism of metal retention, as a re-sult of metallic hydrolysis. Similar affinity sequences, based on the hydrolysis constants, were reported for soils with high clay and iron oxide contents (Tyler and McBride, 1982; Tiller et al., 1984). The Oxisols used in this study (except Ox1) had a high affinity for all the four metals tested. Such results reinforce the role of oxides in the metal retention by highly-weathered soils. In addition to the Oxisols, the Arenic Hapludult (Ult2), the Typic Medifibrist (Ist) and the Typic Argiudoll (Oll) also pre-sented the same sequence Cu > Zn > Ni > Cd, in ac-cordance with the hydrolysis constant of these metals.
Except for Cd, the Arenic Hapludalf (Alf2), Typic Quartzipsamment (Ent), Kandiudalfic Eutrudox (Ox5) and Typic Eutraquox (Ox6) had affinity sequences
fol-lowing the “hardness” degree of metals [Cd (3.04); Cu (2.89); Ni (2.82) and Zn (2.34)]. This concept is derived from the Pearson’s hard/soft theory for acids (Pearson, 1963) and is an estimate of the degree of covalence of the chemical bonds between the metals and soil. Except for Zn, there was a relationship between electronegativ-ity parameters [Cu (2.0); Ni (1.91); Cd (1.69) and Zn (1.65)] of metals and the sequence obtained in the NCS, which emphasizes the importance of covalent binding in metal adsorption by soils. The electronegativity indi-cates the tendency of an atom to attract electrons. The ionic potential (ratio between the charge and radius of an ion) is a measure of the ability of an ion to bind through electrostatic bond [Ni (5.71); Cu (5.48); Zn (5.33) and Cd (4.21)] and was also observed in the NCS in the majority of cases, except for Ni.
In the CS, there was a small variability in sequences among soils, as a consequence of metal competition. The sequence of metal affinity in the CS is in accordance with Basta and Tabatabai (1992); Fontes et al. (2000); Gomes et al. (2001); Fontes and Gomes (2003) and Agbenin and Olojo (2004).
The dominance of Cu in the majority of affinity se-quences is in agreement with its hydrolysis constant, re-inforcing the role of specific binding mechanisms with high stability and binding energy (James and Healy, 1972) in the behavior of this metal in soil. The sequence Zn > Ni found in most soils is also in agreement with the hydrolysis of metals.
Although soils had a greater affinity for Cu and Cd than for Zn and Ni, the sequences resulted from the CS for the four metals were in agreement with the “hard-ness” of these elements. Regarding the electronegativity, there was agreement only for the sequence Cu > Cd > Zn in the Rhodic Hapludox (Ox2), Arenic Hapludult (Ult2), Kandiudalfic Eutrudox (Ox5), Typic Medifibrist (Ist) and Typic Argiudoll (Oll). Except for Ni, these re-sults are in agreement with those reported by Basta and Tabatabai (1992), obtained in Haplaquolls and Hapludols (Pb > Cu > Ni ≥ Cd ~ Zn).
The affinity sequences did not correlate with the ionic potential for the four metals in any soil in the CS. The poor agreement between the experimental results and those expected based on the ionic potential imply that the retention of these metals by soils is not of elec-trostatic nature in scenarios of high competition.
Conclusions
Competition has affected the adsorption of all the metals, in general, it diminished the maximum adsorp-tion. The most common sequence of affinity in the non competitive system was Cu > Zn > Ni > Cd. In the competitive system, the most common sequence was Cu > Cd > Zn > Ni. In the competitive system, Rhodic Eutrudox (Ox1), Kandiudalfic Eutrudox (Ox5), Arenic Hapludult (Ult2), Arenic Hapludalf (Alf2) and Typic Argiudoll (Oll) had the largest metal adsorption capac-ity, and the opposite was observed for Typic
Table 5 – Affinity sequences of Cd, Cu, Ni, and Zn, based on the maximum metal adsorption data for the non competitive (NCS) and competitive (CS) systems.
*Affinity sequences based on the visual observation of the adsorption isotherms.
l i o
S NCS CS
2 x
O Cu>Zn>Ni>Cd Cu>Cd>Zn>Ni 1
x
O Cu≅Zn≅Cd≅Ni* Zn>Cd>Cu>Ni 3
x
O Cu>Zn>Ni>Cd Cu>Ni>Zn>Cd 4
x
O Cu>Zn>Ni>Cd Cu>Zn>Cd>Ni 1
t l
U Zn>Cd>Cu>Ni Cu>Zn>Ni>Cd 2
t l
U Cu>Zn>Ni>Cd Cu>Cd>Ni>Zn 1
f l
A Cu>Ni>Zn>Cd Cu>Cd>Zn>Ni t
n
E Cd>Cu>Ni>Zn Cu>Zn≅Cd>Ni* 5
x
O Cu>Ni>Zn>Cd Cu>Cd>Zn>Ni 6
x
O Cu>Ni>Zn>Cd Cu>Cd>Zn>Ni t
s
I Cu>Zn>Ni>Cd Cu>Cd>Zn>Ni t
p
E Zn>Cu>Cd≅Ni Cu>Zn>Cd>Ni 2
f l
A Zn>Cu>Ni>Cd Cu>Zn>Cd>Ni l
l
Quartzipsamment (Ent) and Arenic Hapludult (Ult1). The Langmuir model satisfactorily simulated the metal adsorption by soils in the majority of cases.
Acknowledgements
To CNPq for the MSc. grant for the first author and the Researcher grant for the second author.
References
Agbenin, J.O.; Olojo, L.A. 2004. Competitive adsorption of copper and zinc by a Bt horizon of a savanna Alfisol as affected by pH and selective removal of hydrous oxides and organic matter. Geoderma, 119: 85-95.
Alumaa, P.; Steiness, E.; Kirso, U.; Petersel, L. 2001. Heavy metal sorption by different stonian soil types at low equilibrium solution concentrations. Proceedings of the Stonian Academy Science Chemistry, 50: 104-115.
Barrow, N.J. 1987. Reactions With Variable-Charge Soils. Martinus Nijjhoff, Dordrecht, Germany.
Basta, N.T.; Tabatabai, M.A. 1992. Effect of cropping systems on adsorption of metals by soils. III. Competitive adsorption. Soil Science, 153: 331-337.
Casagrande, J.C.; Jordão, C.B.; Alleoni, L.R.F.; Camargo, O.A. 2004. Copper desorption in a soil with variable charge. Scientia Agricola, 61: 196-202.
Chang, T.W.; Wang, M.K.; Lin, C. 2002. Adsorption of copper in the different sorbent/water ratios of soil systems. Water, Air, and Soil Pollution, 138: 199-209.
Coscione, A.R.; de Abreu, C.P.; Santos, G.C.G. 2009. Chelating agents to solubilize heavy metals from oxisols contaminated by the addition of organic and inorganic residues. Scientia Agricola, 66: 64-70.
Echeverría, J.C.; Morera, M.T.; Mazkiran, C.; Garrido, J.J. 1998. Competitive sorption of heavy metal by soils: isotherms and fractional factorial experiments. Environmental Pollution, 101: 275-284.
Fontes, M.P.F.; Alleoni, L.R.F. 2006. Electrochemical attributes and availability of nutrients, toxic elements, and heavy metals in tropical soils. Scientia Agricola 63: 589-608.
Fontes, M.P.F.; Gomes, P.C. 2003. Simultaneous competitive adsorption of heavy metals by the mineral matrix of tropical soils. Applied Geochemistry 18: 795-804.
Fontes, M.P.F.; Matos, A.T.; Costa, L.M.; Neves, J.C.L. 2000. Competitive adsorption of zinc, cadmium, copper and lead in three highly-weathered Brazilian soils. Communications in Soil Science and Plant Analysis 31: 2939-2958.
Gomes, P.C.; Fontes, M.P.F.; Da Silva, A.G.; Mendonça, E.S.; Netto, A.R. 2001. Selectivity sequence and competitive adsorption of heavy metals by Brazilian soils. Soil Science Society of America Journal 65: 1115-1121.
Harter, R.D. 1984. Curve-fit errors in Langmuir adsorption maxima. Soil Science Society of America Journal 48: 749-752.
James, R.O.; Healty, T.W. 1972. Adsorption of hydrolysable metals at the oxide-water interface. III. A thermodynamic model of adsorption. Journal of Colloid Interface Science 40: 65-80. Matos, A.T.; Fontes, M.P.F.; Jordão, C.P.; Da Costa, L.M. 1996.
Mobility and retention of heavy metals in a red-yellow Latosol. Revista Brasileira de Ciência do Solo 20: 379-386. (in Portuguese, with English abstract).
McBride, M.B. 1994. Environmental Chemistry of Soils. Oxford University Press, New York, NY, USA.
Mead, J.A. 1981. A comparison of the Langmuir, Freundlich and Temkim equations to describe phosphate adsorption properties. Australian Journal of Soil Research 19: 333-342. Mekaru, T.; Uehara, G. 1972. Anion adsorption in ferrugineous
tropical soils. Soil Science Society of America Proceedings 36: 296-300.
Msaky, J.J.. Calvet, R. 1990. Adsorption behavior of copper and zinc in soils: influence of pH on adsorption characteristics. Soil Science 150: 513-521.
Nelson, D.W.; Sommers, L.E. 1996. Part 3. Total carbon, organic carbon and organic matter. In: Sparks, D.L.; Paga, A.L.; Helmke, P.A.; Loeppert, R.H.; Soltanpour, P.N.; Tabatabai, M.A.; Johnston, C.T.; Summer, M.E., eds. Methods of soil analysis: chemical methods. Soil Science Society of America, Madison, WI, USA.
Petruzzelli, G.; Guidi, G.; Lubrano, L. 1985. Ionic strength effect on heavy metal adsorption by soil. Communications in Soil Science and Plant Analysis 16: 971-986.
Raij, B. van; Quaggio J.A.; Silva N.M. 1986. Extraction of phosphorus, potassium, calcium and magnesium from soils by an ion exchange resin procedure. Communications in Soil Science and Plant Analysis 17: 547–566.
Ross, S.M. 1994. Retention, transformation and mobility of toxic metals in soils. p. 63-152. In: Ross, S.M., ed. Toxic metals in soil-plant systems. Wiley, New York, NY,USA.
Shani, U.; Dudley, L.M.; Hanks, R.J. 1992. Model of boron movement in soils. Soil Science Society of America Journal 56: 1365-1370.
Silveira, M.L.A.; Alleoni, L.R.F. 2003. Copper adsorption in tropical Oxisols. Brazilian Archives of Biology and Technology 46: 529-536. (in Portuguese, with English abstract).
Silveira, M.L.A.; Alleoni, L.R.F.; Casagrande, J.C.; Camargo, O.A. 2002. Copper adsorption in oxidic soils after removal of organic matter and iron oxides. Communications in Soil Science and Plant Analysis 33: 3581-3592.
Silveira, M.L.A.; Alleoni, L.R.F.; Casagrande, J.C.; Camargo, O.A. 1999. Free energy of copper adsorption in acric Oxisols. Lembrar de colocar no final. Scientia Agricola 56: 1117-1122. (In Portuguese, with English abstract)
Soares, M.R.; Alleoni, L.R.F. 2008. Contribution of soil organic carbon to the ion exchange capacity of tropical soils. Journal of Sustainable Agriculture 32: 439-462.
Soares, M.R.; Alleoni, L.R.F.; Vidal-Torrado, P.; Cooper, M. 2005. Mineralogy and ion exchange properties of the particle size fractions of some Brazilian soils in tropical humid areas. Geoderma 125: 355-367.
Soil Survey Staff. 2010. Keys to Soil Taxonomy. 11ed. USDA-Natural Resources Conservation Service, Washington, D.C., USA. Tiller, K.G.; Gerth, J.; Brümmer, G. 1984. The relative affinities of
Cd, Ni and Zn for different soil clay fractions and goethite. Geoderma 34: 17-35.
Tyler, L.D.; McBride, M.B. 1982. Influence of Ca, pH and humic acid on Cd uptake. Plant and Soil 64: 259-262.